Next week President Obama is expected to send Congress his new budget. It’s a huge, sprawling document; last year’s was 2,476 pages in four volumes. Because no one can absorb all that instantly, here’s an insider’s guide to the budget for fiscal year 2015, which begins Oct. 1, 2014.
The first trick: Skip the rhetoric. (“This budget takes critical steps to grow our economy, create jobs and strength the middle class….”) Do what the pros do: Go directly to the tables.
Summary tables – helpfully labeled with the prefix “S” – at the back of the main budget book offer a good overview. Table S-1 shows what the president is proposing for taxes, spending and deficits each year for the decade. The following tables put price tags on his specific proposals: The ones with bigger numbers are almost always the most important, though not always the most-discussed. There’s usually a list of the programs that the president wants to cut or consolidate, often the same list that he proposed the year before and Congress ignored.
After more than a quarter of a century of looking at White House budgets, I’ve found a couple of tables, particularly those in the Historical Tables volume, to be particularly illuminating.
Interest rates
Where to find it: Table S-5 in the main budget volume and table 8.4 in the Historical Tables
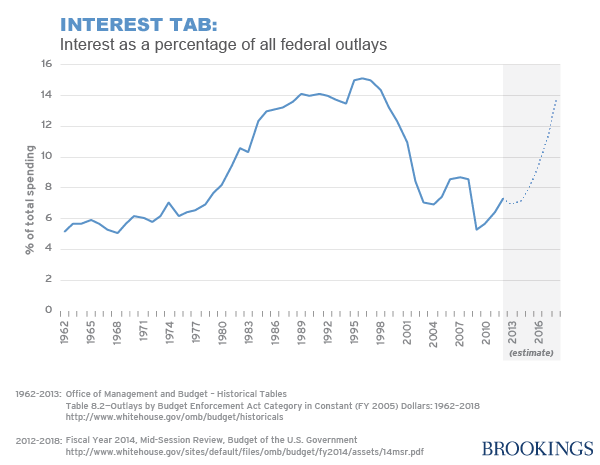
With unemployment still high, interest rates low and the deficit falling fast, it’s hard to understand why anyone should worry about today’s budget deficit. And for good reason: Today’s deficit is not a problem. But tomorrow’s is – and here’s one reason. Last summer, the White House predicted that the U.S. government would spend $223 billion on interest in the current fiscal year. That’s a lot of money – more than the combined spending this year of the departments of Commerce, Energy, Education, Energy, Interior, Justice, Labor and the Environmental Protection Agency. It works out to a bit under 6% of all federal spending.
Run your finger down the table and see what the president projects 10 years from now. If the economy does as well as White House economists predict (and White House economist invariably are optimistic about the long run), and if Congress accepts every Obama proposal on taxes and spending, then interest will take about 14% of all federal spending in 2023. That’s money that won’t be available for other, more productive purposes. And since about half the federal debt is held overseas, about half of that money will flow to foreigners.
There are two reasons that interest rates represents a growing slice of the federal budget: (1) As long as the federal government spends more than it takes in, it’ll be borrowing more each year; and (2) the interest rates the U.S. Treasury pays on its borrowing are really low now, but they won’t stay low forever.

Investing in the future
Where to find it: Table 8.4, Historical Tables.
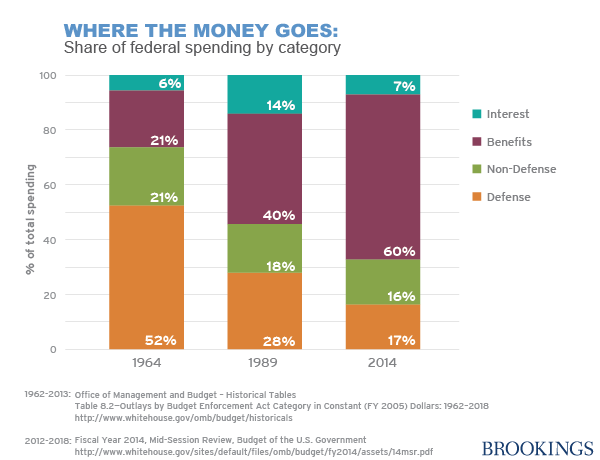
The federal government spends a lot of money: $3.5 trillion this year. Two-thirds goes to pay for benefits programs, including Social Security, Medicare, Medicaid, farm subsidies, veterans pensions and interest on the debt. The remaining third, appropriated annually by Congress, is split roughly 50-50 between defense and non-defense.
That last slice covers everything from paying the salaries of the folks who answer the phones for Social Security to funding National Institute of Health research grants – and it includes pretty much everything that represents an investment in the economic future (along with a lot of other things, of course.) This is the spending that politicians and the public usually have in mind when they complain about “the size of government.”
As a share of all federal spending, and as a share of the overall economy, this “non-defense discretionary spending” has been shrinking, and it’s going to keep shrinking if Congress sticks to the spending ceilings written into law. Indeed, measured as a share of the economy, this would be lower than any time since 1962, the earliest year for which comparable data is available data.
In other words, total federal spending is growing, but spending on those things that will make life better for our children and our grandchildren is under severe pressure. The latest Congressional Budget Office numbers show that domestic spending will amount to 3.4% of the gross domestic product this year. That’s slightly lower than it was during most of George W. Bush’s presidency. A starker fact is CBO’s projection that spending ceilings set in law will take this spending to 2.5% of GDP a decade from now. This spending hasn’t been below 3% at any time since John F. Kennedy – and there’s a substantial chance that Congress and a future president won’t be able to stick to the ceilings to which this Congress and this president have agreed.

Health
Where to find it: Table 16.1 in the Historical tables.
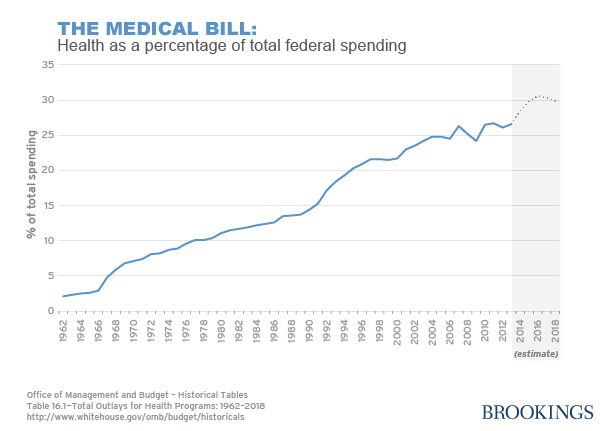
It’s almost impossible to overstate the importance of health care spending on the federal budget outlook. If the rate of growth in spending per person on Medicare and Medicaid slows – or even if it simply persists at today’s historically slow pace – then the budget deficit and federal debt are much less serious problems. Here’s one clear ways to see the importance of health care spending: In 1962, before Medicare and Medicaid got going, overall health spending (Medicare, Medicaid, VA, government employees health insurance, etc.) amounted to 2% of all federal outlays. By 1992, it was up to 17%. This year, it will be around 28%. The White House last year projected it would top 30% in a couple of years.

Taxes
Where to find it: Table 2.2 historical tables
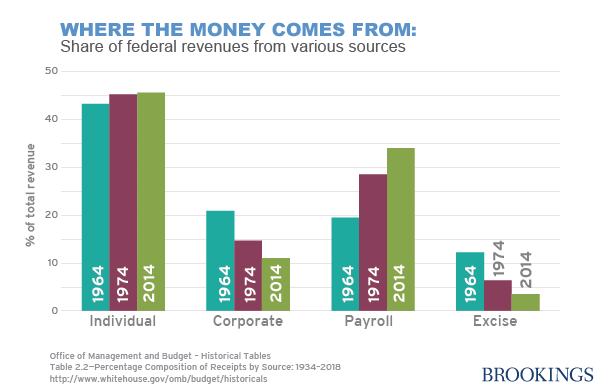
Of course, all this money has to come from somewhere. This year, Washington will borrow about 14 cents for every dollar it spends. (That’s a sharp contrast to the worst year of the recession when it borrowed 44 cents for every dollar spent.) The rest comes from taxes. Measured as a share of the economy, taxes in the current fiscal year will be about 17.5% of GDP, roughly in line with the 17.4% average for the past 40 years. But the source of those revenues has changed significantly over the years: The payroll tax levied on wages to financial Social Security and Medicare accounts for a growing share of federal receipts; the tax on corporate profits represents a shrinking share.
This year, about 46% of all revenues come from the individual income tax, 34% from the Social Security/Medicare payroll tax and 12% from taxes on corporate profits. Forty years earlier, it was 45% from the individual income tax, not much change there. But 15% came from the Social Security/Medicare payroll tax and 29% from taxes on corporate profits.

The Brookings Institution is committed to quality, independence, and impact.
We are supported by a diverse array of funders. In line with our values and policies, each Brookings publication represents the sole views of its author(s).


Commentary
Op-edHow to Read President Obama’s New Budget
February 26, 2014