Earlier this month, Brookings Metro published a data-driven snapshot of the growth and geography of the emerging artificial intelligence (AI) economy in the United States.
Employing seven basic measures of AI research and commercial activity, the report benchmarked U.S. metropolitan areas on the basis of their core AI assets and capabilities as they stand now. Here, we look at the report’s most important takeaways through five charts.
Artificial intelligence R&D and commercialization are on the rise
The AI industry is growing rapidly, with AI-related projects accounting for a substantially larger share of federal research and development expenditures at U.S. colleges and universities. Similarly, newly founded firms that provide AI solutions of all tech startups expanded to more than 5%, from less than 1% a decade ago.
Figure 1. Share of AI-related projects in federal R&D expenditures at U.S. colleges and universities, and firms providing AI solutions as share of all tech companies
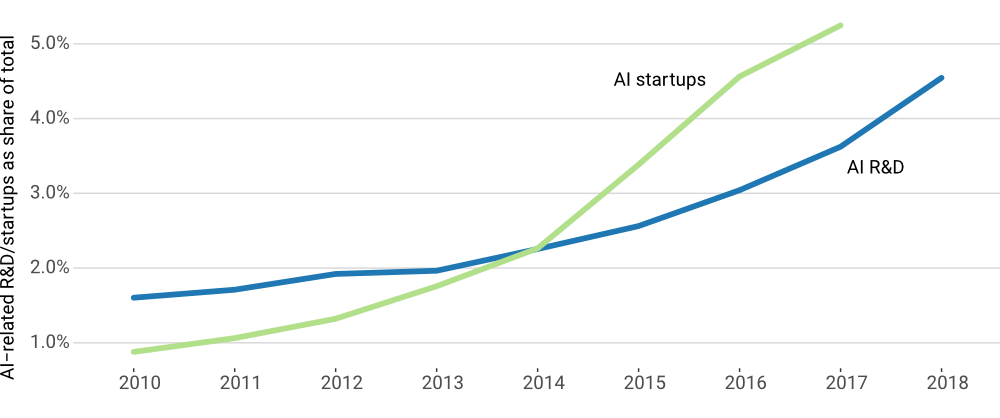
Source: Brookings analysis of data from Crunchbase and Burning Glass data available via StanfordHAI 2021 AI Index
With that said, the emerging demand for AI workers is still a tiny fraction of the U.S. labor market, with AI job postings accounting for less than 1% of all job postings.
AI job postings saw accelerated growth
Job postings that require AI skills also surged, reflecting the growing adoption of AI capabilities both by startups and by industry more broadly. In addition, the increase in postings underscores the growing need for more AI-conversant professionals and diverse digital skills workers.
Figure 2. Job postings with AI skills as share of all job postings
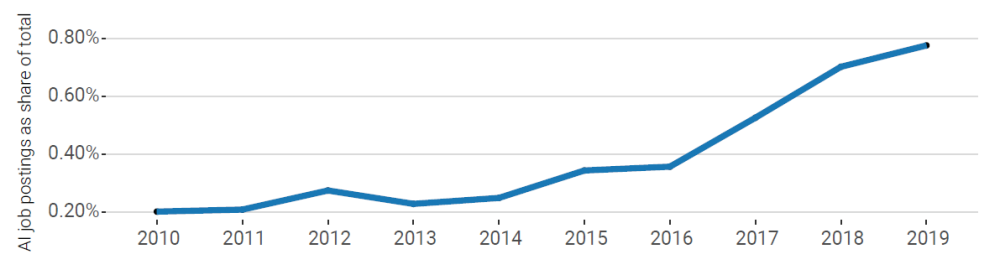 Source: Brookings analysis of Burning Glass data, available via Stanford HAI 2021 AI Index
Fast growth in demand for AI skills comes from a small base
The emerging demand for AI workers is still a tiny fraction of the U.S. labor market, with AI job postings accounting for less than 1% of all job postings.
Figure 3. Number of total jobs postings, job postings with IT skills, and job postings with AI skills
 Source: Brookings analysis of Burning Glass data, available via Stanford HAI 2021 AI Index
Only a few metro areas have developed substantial AI presences, but many more show promise as potential adoption centers
A cluster analysis of U.S. metro areas’ standing on AI research and commercialization activities identified five distinctive categories of AI readiness. These categories are: the San Francisco Bay Area “superstar” region; 13 “early adopter” metro areas; 21 federal research centers; 87 “potential adoption centers”; and scores of other metro areas with little or no AI activity.
The nation’s emerging AI geography is highly concentrated, with the Bay Area and the 13 early adopters taking up over half of the nation’s current AI activities in federal contracts, conference papers, patents, job postings, job profiles, and startups. Many other metro areas distributed across the country encompass more modest AI activity.
Figure 4. Share of job postings with AI skills by five types of AI metro area clusters
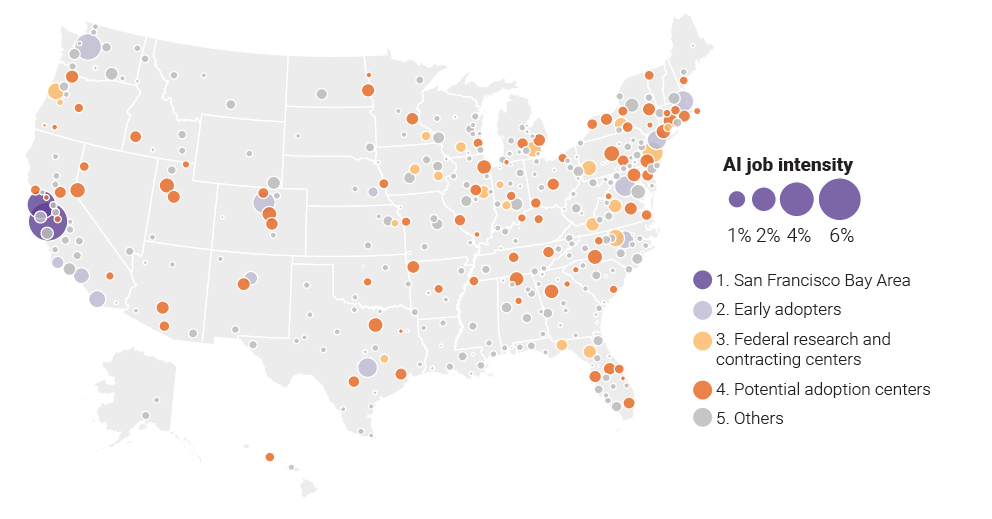
Source: Brookings analysis of Stanford HAI, Crunchbase, STAR METRICS, United States Patent and Trademark Office, and Emsi data
The five types of AI city exhibit distinctive activity profiles
A closer look at the specific characteristics of AI cluster types across the nation reveals their varied strengths and weaknesses.
While the Bay Area is dominant or very strong on all seven of Brookings’s benchmarking metrics, early adopters and research centers have narrower strengths. Potential adoption centers have more limited—though legitimate—concentrations.
These divergent starting points suggest that regions will require different strategies for AI development based on their current positioning and capabilities.
Figure 5. Indexed per capita AI capacities levels for five types of AI metro area cluster (San Francisco Bay Area = 100)

Source: Brookings analysis of Stanford HAI, Crunchbase, STAR METRICS, United States Patent and Trademark Office, and Emsi data
See the level of AI activity in your metro area using this interactive tool:
These five charts point both to genuine AI opportunities and cautions for various metropolitan areas. On the upside, AI is a powerful general purpose technology that is growing rapidly and could increase the productivity of virtually all regional economies. As leaders seek to position their locales for post-pandemic vitality, AI can and should be part of the discussion.
With that said, these charts also suggest that the task of developing a significant AI cluster will be challenging. Wide variations in cities’ starting points, research sectors, and business activities require that locations assess their positioning and capabilities clearly. So, too, do the “superstar” and “winner-take-most” dynamics of digital and platform economies counsel caution, since they suggest that relatively few places could drive the bulk of early-stage AI-related development.
In view of that, the information here underscores the need not for all metro areas to spring into action right now, but rather to assess their positioning and then consider acting.
Related Content


2021
Authors


The Brookings Institution is committed to quality, independence, and impact.
We are supported by a diverse array of funders. In line with our values and policies, each Brookings publication represents the sole views of its author(s).

Commentary
Five charts that reveal the geography of the AI economy
September 16, 2021