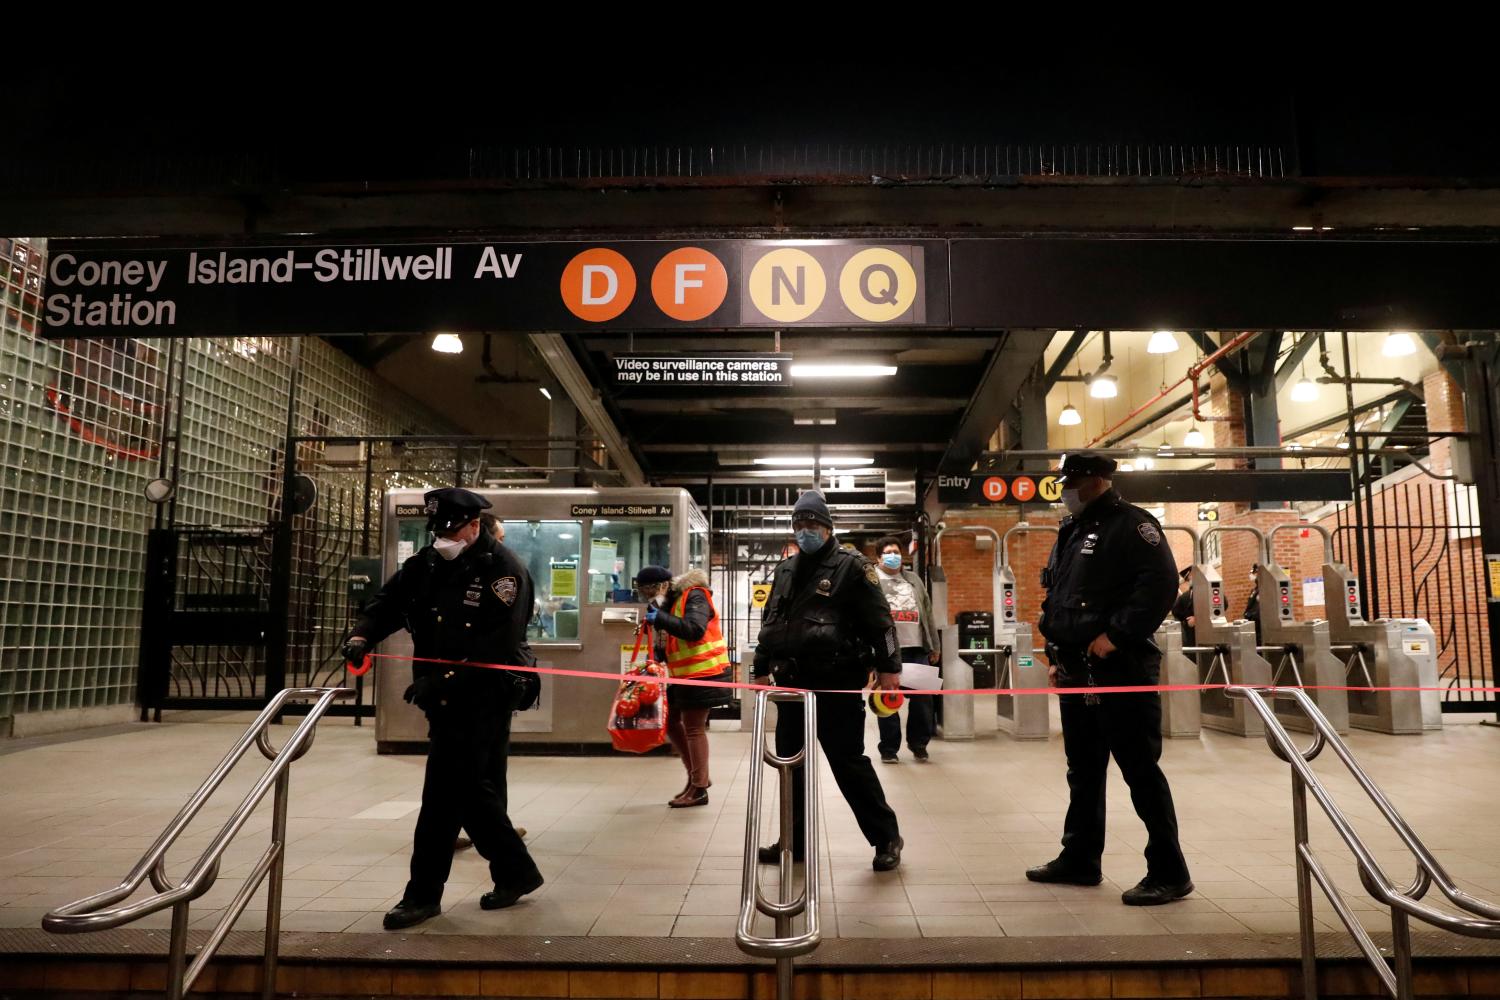
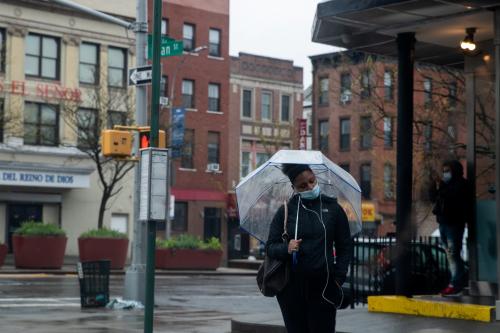
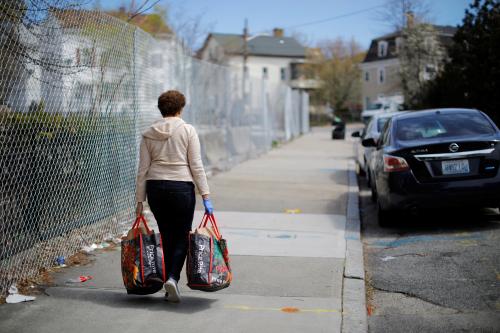
In addition to the primary devastation of thousands of lives lost, the COVID-19 pandemic has led to economic despair and joblessness for millions of Americans. But it is not just those out of work at risk of hardship. “Essential workers” who continue to go to work while the virus is actively spreading in the population risk exposing themselves and their families to the virus. This reality has led to various proposals to provide these essential workers with “hazard pay”, as recently called for by Senator Mitt Romney, among others. The goal of this memo is to provide some data about who these workers are, which should inform any such policy discussions.
Our analysis is based on data from the 2018 American Community Survey (ACS), which provides information about a worker’s industry, occupation, demographics, and earnings. We categorize workers as “essential” if their detailed Census industry maps to the Department of Homeland Security’s list of essential jobs.1We use data from the 2017-2018 American Time Use Survey (ATUS) Leave and Job Flexibilities Module to characterize occupations by the share of workers in that occupation who report being able to work from home.2 We then assign a work from home probability to workers in the ACS based on their reported occupation’s share of workers who report being able to work from home in the 2017-2018 survey. An exception to this assignment rule is that for teachers and professors, we assign a work from home share of 85%, since the rate observed in 2018 surely does not apply to the current situation when schools and universities are closed.3
Of the 173 million workers who worked in the U.S. in the year 2018, 91 million of them (52.6 percent) worked in industries that correspond to the U.S. Department of Homeland Security classification of essential jobs. Overall, the earnings, education, gender, and racial composition of the essential workforce looks a lot like that of the overall workforce. As shown in Table 1, median earnings among workers in essential jobs (in 2018) was $40,000, as compared to $38,000 for the overall workforce. Roughly 46-47% percent of both are female; 38% are non-white, and 34% hold a bachelor’s degree.
However, there are sizable differences in the demographic composition of the set of essential workers in occupations with high and low rates of telework. Essential workers in occupations in which fewer than half of workers report being able to work from home have lower median earnings than those in occupations with more than half of workers reporting being able to work from home: $35,000, as compared to $60,000. They are more likely to be non-white – 40.9% versus 28.7% and less likely to have bachelor’s degree – 22.5% versus 66.9%. They are less likely to be female – 44.7% versus 51.3%. These statistics imply that lower educated and minority workers are disproportionately likely to be going to work during this pandemic, as compared to working from home, which likely puts them at greater risk of contracting COVID-19.
Table 1: Characteristics of workers, by whether their jobs are deemed essential and they are likely to be able to work from home
| Essential, in occupations with: | ||||
| All | All Essential | <50% Work-From-Home Rate | >50% Work-From-Home Rate | |
| Number of workers (millions) | 173.2 | 97.7 | 71.8 | 25.9 |
| Median Annual Earnings | $38,000 | $40,000 | $35,000 | $60,000 |
| Percent with a BA | 34.1% | 34.3% | 22.5 % | 66.9% |
| % Nonwhite | 37.8% | 37.7% | 40.9% | 28.7% |
| % black | 11.6% | 12.3% | 13.5% | 8.8% |
| % Hispanic | 17.2% | 17.3% | 19.8% | 10.3% |
| % Female | 47.5% | 46.4% | 44.7% | 51.3% |
| Notes: Essential workers are classified using Department of Homeland Security advisory memo (DHS 2020). Work-from-home rates are calculated by occupation, using data from the American Community Survey, 2017-2018 American Time Use Survey Leave Module, except for those working in the education sector. | ||||
There is a clear negative relationship between the share of essential workers in an occupation who are non-white and the share of essential workers in that occupation who are likely able to telework, as shown in Figure 1. Each of the 23 bubbles in Figure 1 represents a Census defined occupation. Each occupation is weighted by the number of essential workers in that occupation in the year 2018, so a larger bubble means that more essential workers are in this position, as compared to an occupation represented by a smaller bubble. The X-axis measures the share of workers in this occupation who are likely able to work from home, as described above. For example, only 6.1 percent of workers in healthcare support occupations report being able to work from home; non-white workers comprise 54% of essential workers in that occupation. At the other end of the spectrum, 72% of essential workers in legal occupations report being able to work from home, and only 27% of essential workers in that occupation are non-white.
Figure 1
The fact that black workers are more likely to be essential workers in occupations with low rates of being able to work from home is potentially a contributing factor to racial disparities in COVID-19 related deaths. Blacks have experienced a disproportionate number of COVID-19 related deaths in a number of U.S. cities, see for example, statistics from NYC, Chicago, and Richmond. There are a variety of factors that might explain racial differences in COVID-19 infection and mortality rates – including higher rates of preexisting health conditions, relatively worse health care access, a greater likelihood of living in dense housing areas and using public transportation, distrust of government mandates to social distance, among others.4 Greater exposure on the job may be just one factor, but it is one that should be acknowledged in policy discussions.
Figure 2
Essential workers who are least likely to be able to work from home tend to have lower earnings than essential workers who can work more safely from the confines of their home. Figure 2 shows a positive relationship between the percent of workers in an occupation who are able to work from home and the median annual earnings of essential workers in this occupation. For example, 4 percent of essential production and manufacturing workers are able to work from home, and their median annual earnings are $36,000. In contrast, 65% of essential workers in computer and mathematical science occupations are able to telework, with $76,000 in median annual earnings; and 72% of workers in legal occupations are able to telework, with median earnings of $90,000.
There are numerous ways in which the burdens of this COVID-19 pandemic have fallen disproportionately on less advantaged demographic groups. This essay highlights just one: the burden of continuing to work outside the home while the virus continues to spread through the population is disproportionately born by lower wage, less educated, and non-white workers. These facts strengthen calls for “hazard pay” policies to compensate at-risk essential workers.
The authors did not receive financial support from any firm or person for this article or from any firm or person with a financial or political interest in this article. The authors are not currently officers, directors, or board members of any organization with a financial or political interest in this article.
-
Footnotes
- We crosswalk four-digit census industry codes with the descriptive list of “essential jobs” from the Department of Homeland Security March 2020 memo, last accessed on April 27, 2019. The crosswalk is posted on the Brookings website.
- This module asked all non-self-employed wage and salary workers in the ATUS sample about their access to and use of paid and unpaid leave, job flexibility, and their work schedules. The sample size for this module is 10,004. The exact question we rely on to code ability to work from home is “As part of your (main) job, can you work at home?” See https://www.bls.gov/tus/lvdatafiles.htm.
- It is probably the case that across occupations, more workers are able to work from home now than in 2017-2018. Thus, the levels reported here likely understate the overall level of work-from-home capabilities, even if the patterns from the 2017-2018 survey hold.
- A recent paper by Joshua Coven and Arpit Gupta examines GPS data and finds that in NYC, people living in mostly white high-income neighborhoods were more likely to leave NYC when the pandemic hit, and people living in neighborhoods with higher rates of low-income, minority residents were more likely to not only stay in the city, but also to be out during both daytime and evening hours.
The Brookings Institution is committed to quality, independence, and impact.
We are supported by a diverse array of funders. In line with our values and policies, each Brookings publication represents the sole views of its author(s).


