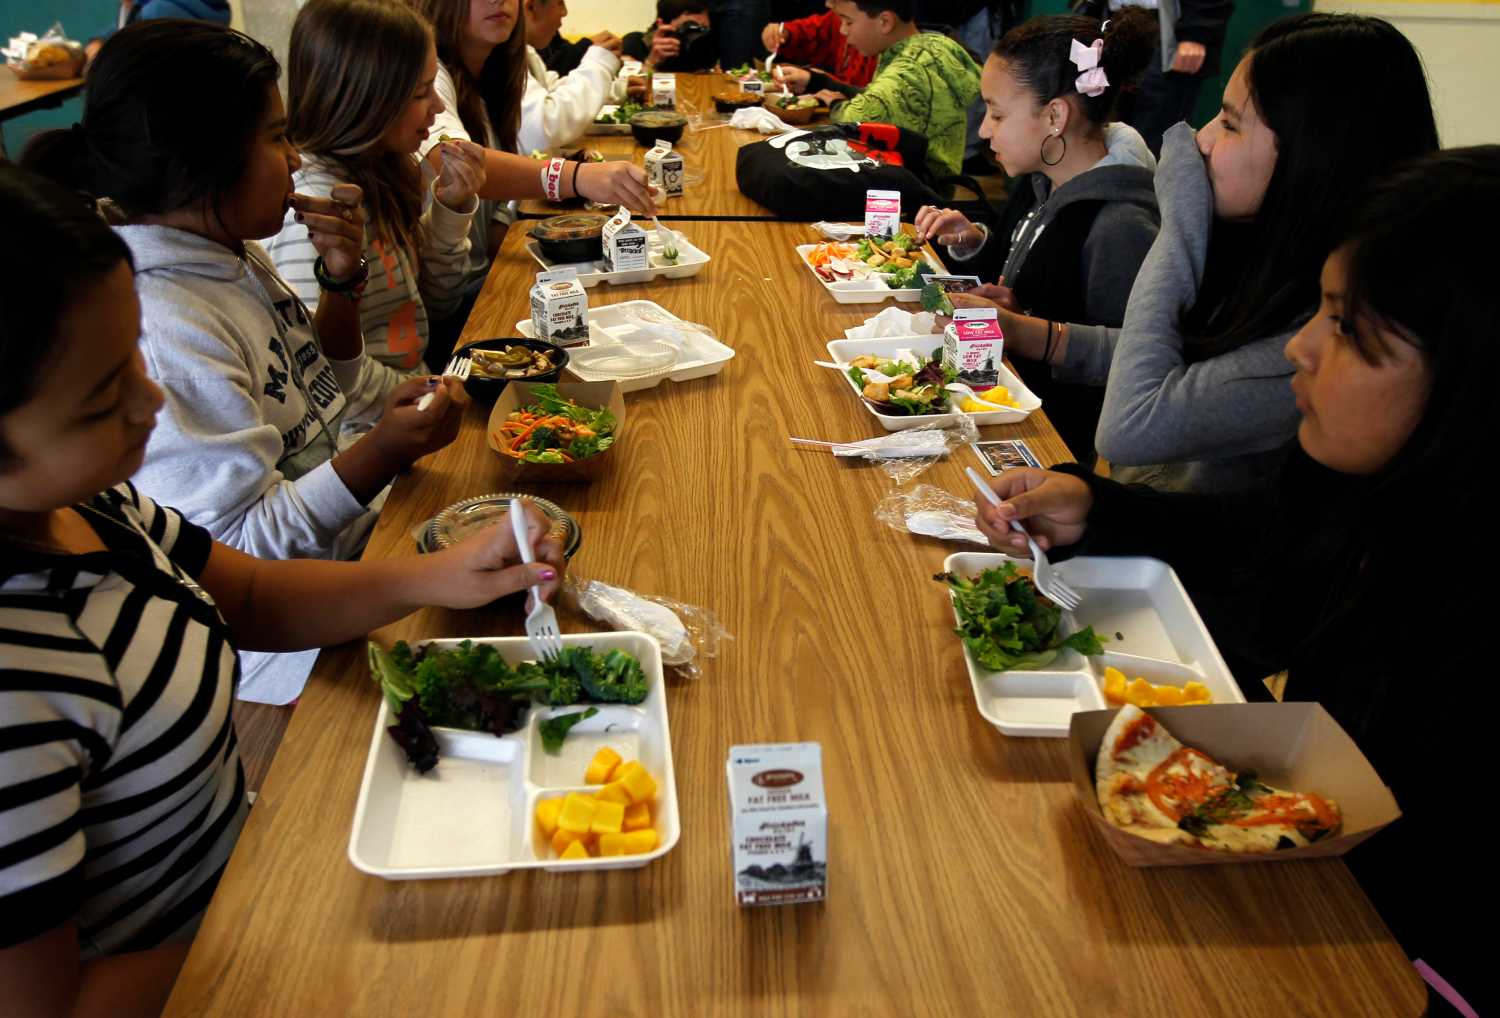
In the wake of pandemic-induced school closures in March 2020, districts grappled with how to continue to feed the more than 29 million children who relied on the National School Lunch Program (NSLP). That same spring, the U.S. Department of Agriculture issued temporary waivers to increase meal program flexibility and help districts feed their students. More recently, the use of school meal waivers has contributed to alleviating a host of challenges school districts face, such as pandemic-related supply chain issues, a shortage of food service workers, and increased food costs.
The waiver that garnered the most attention was an extension of the Seamless Summer Option (SSO) which, among other things, provided schools with a higher reimbursement rate for meals served and allowed schools to provide meals to all students without collecting payments or documentation establishing qualification for free or reduced-price lunch (FRPL) status. Ninety-percent of School Food Authorities (which are responsible for administering meal programs in schools and districts) reported the use of SSO waivers to provide free meals to students during the 2021-22 school year. The SSO was by far the most used waiver, with the Fresh Fruit and Vegetable Program and NSLP’s after-school snacks coming in second and third with a significantly lower combined adoption rate of 17%.
Congress passed the bipartisan Keep Kids Fed Act on Friday June 27th, extending the waivers until the end of the summer and provided some short-term relief for students and schools as a result. However, school districts will face numerous challenges when the waivers run their course in just a few months (unless they are extended by Congress again). Without the increased reimbursement rate from the federal government, most schools cannot afford to continue to provide free meals for all students. In the upcoming year, more students will qualify for free or reduced-price lunches, and schools face increased bureaucratic costs associated with collecting and processing applications that establish FRPL status for the NSLP and resuming the collection of lunch debts.
default to the national school lunch program or enroll for universal meal provision?
Districts have two main options to feed students in the 2022-23 school year: revert to normal operation of the NSLP or, if they qualify, enroll in the Community Eligibility Provision (CEP). A school participating in NSLP provides free or subsidized meals to income-eligible students while the CEP allows high-poverty schools to serve universal free school meals. Nationwide, 15.5 million children currently attend one of 68% of eligible schools that provide free breakfast and lunch through participation in CEP. Under both programs, schools receive reimbursements for meals categorized as free, reduced-price, or paid, with free meals being reimbursed at the highest rate. The total amount reimbursed depends on how many meals of each category are served.
The qualifying metric to determine a school’s eligibility for CEP is the identified student percentage (ISP). A student is “identified” based on household participation in federal welfare programs (SNAP, TANF, etc.) or their status as a homeless, migrant, runaway, or foster child. Schools are eligible to participate in CEP if they have an ISP of at least 40%, or when at least 40% of the students in a school meet these conditions.
Since many SNAP-eligible families do not access welfare program benefits and would therefore be uncounted in the ISP measure, a 1.6 multiplier is used to approximate the true percentage of students who would qualify for FRPL. This determines what percentage of meals served can be reimbursed at the free rate. For example, using this formula, a school with an ISP of 40% would have 64% of their meal costs reimbursed (0.40 x 1.6 = 0.64), and a school with an ISP of 62.5% would have 100% of their meal costs covered. This means that schools with ISP values between 40% and 62.5% must bear some (but not all) of the cost of meal provision to their students, with schools closer to the low end of that range facing larger cost burdens, potentially deterring them from enrolling in the program.
cep participation benefits students, families, and schools
CEP appears to improve academic achievement and behavioral outcomes. Research suggests that CEP adoption is associated with higher math test scores and attendance rates. The free breakfast provided under CEP may also result in improvements in classroom behavior and decreases in suspension rates.
These school-based benefits come with broader benefits associated with addressing food insecurity and poverty. According to the U.S. Department of Agriculture, 15.8% of children live in a food-insecure household. Family income is often volatile, which can present challenges for FRPL eligibility, and the improved income stability from consistently receiving free meals at school reduces the number of unexpected expenses a family faces.
There is also work highlighting the reduced average meal costs resulting from participation in CEP. When schools adopt CEP, student participation in school meal programs increases, which can decrease average per-student costs through economies of scale. Schools participating in CEP spend $0.67 less per lunch and $0.58 less per breakfast served when accounting for food, labor, and administrative costs.
Why, then, would some schools not participate? And which ones haven’t been participating?
what factors contribute to choosing between nslp and cep?
To shed some light on this issue, we use recently published data from Virginia and Massachusetts on CEP participation and eligibility corresponding to the 2021-22 school year. (We focus on these states because their data enable this type of analysis.)
Massachusetts implemented CEP for the first time during the 2013-14 school year, and Virginia launched its program the following year. Further, Virginia is set to alter its approach next school year with new state legislation that requires all CEP-eligible schools to apply to participate for 2022-23. The state will grant waivers for school districts only if implementation of CEP would not be “financially viable.” Massachusetts, meanwhile, is still trying to resolve what approach they will take next year. State house legislators have included an extension to the current pandemic-induced meal waivers in the budget for next year, but it has not been finalized.
Cost is one of the main concerns school leaders have about CEP. The current model only provides full reimbursement for schools with an ISP above 62.5%, with schools with an ISP between 40% and 62.5% receiving partial funding (recall the description of the multiplier in the previous section). Figure 1 below shows the degree to which schools are participating by plotting their participation status and ISP. Each dot represents a school, with dark (light) blue dots indicating schools that are eligible (ineligible) to participate in CEP. The figure shows which schools opt in and which schools opt out.
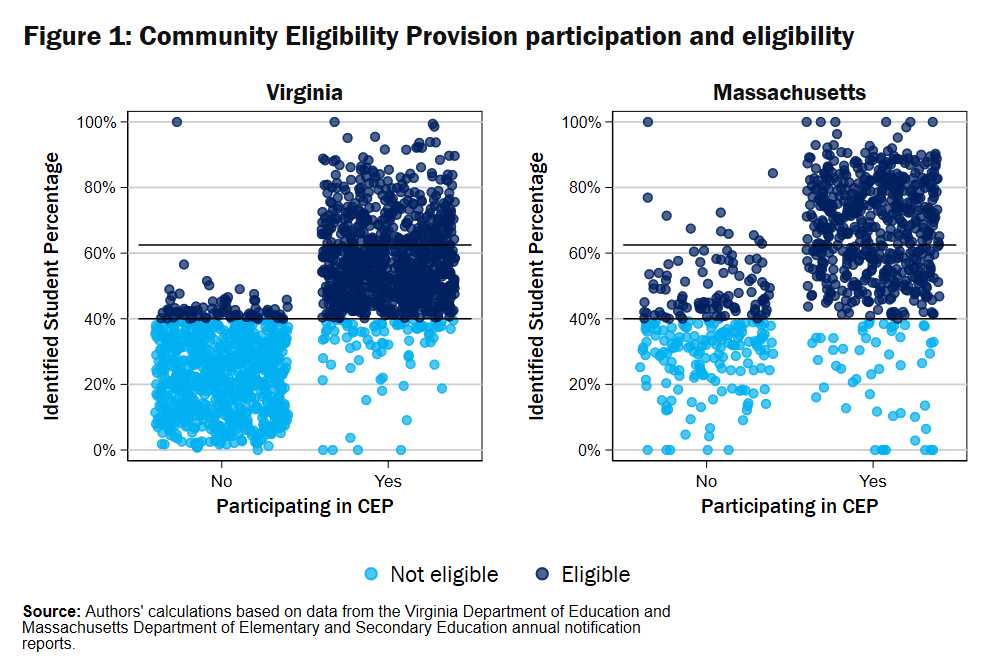
Figure 1 seems to indicate considerable cost sensitivity in districts’ decision-making about how to provide meals. Virtually all schools above an ISP of 62.5% participate, and as we drop closer to 40%, more schools appear on the “not participating” side of the graph (while still eligible). Below 40%, some schools are observed participating in CEP by joining with others (ineligible schools can be grouped with eligible schools by their district – and the whole group can be eligible if the group average ISP exceeds 40%). This suggests, perhaps unsurprisingly, that more districts would like to participate in CEP if it were made more affordable to them.
To try to curb the prevalence of districts deterred from participation due to costs, an increase of the multiplier for reimbursement was proposed in Build Back Better for elementary schools, from 1.6 to 2.5 (among other changes). As 2.5 x 40% is 100%, this would mean that all qualifying schools would be fully reimbursed if they elected to participate in CEP.
The decision to enroll in CEP is heavily dependent on cost, but cost is not the only factor. When districts move into CEP, they stop receiving individual NSLP applications and rely on direct certification based on participation in other welfare programs. Since schools might differ in their eligibility based on these different measures, a move to CEP can affect the “poverty ranking” of schools within a district. For instance, if two schools have 45% and 50% of qualifying students through direct certification, but those same schools then have 65% and 55% of qualifying students when household applications are included, then their ranking of need switches if they opt into CEP.
This could alter the distribution of Title I funds and other resources within a district, potentially making at least some schools and districts reticent to join CEP. (Notably, too, an Urban Institute analysis finds that ISP does not accurately reflect the “true level of need,” and child poverty rates within states only loosely correspond to ISP.)
schools and districts may need coaxing to get the benefits of universal meal provision
Adopting a universal meal program like CEP appears to offer considerable social and educational benefits while potentially lowering costs and the bureaucratic burden. Though participation in CEP has been increasing, 31% of eligible schools did not participate during the 2019-20 school year. Cost is quite clearly a factor, and potential shifts in the intra-district distribution of Title I funds can play a role in the decision-making process, too. Some states, like Maine and Virginia, have pushed for statewide adoption of CEP and expanded universal school meal efforts. If Congress fails to provide a longer-term solution, states may need to step up to feed America’s children and relieve the host of economic challenges confronting school districts and families.
Related Content


Authors

The Brookings Institution is committed to quality, independence, and impact.
We are supported by a diverse array of funders. In line with our values and policies, each Brookings publication represents the sole views of its author(s).