

The biopharmaceutical industry has voiced concerns that the prescription drug price negotiation provision of the Inflation Reduction Act (IRA) is compromising and distorting investments in drug development in potentially harmful ways. Prescription drug manufacturers are concerned that the outlook for future revenues from the sale of brand name prescription drugs has deteriorated and that, in turn, will result in reduced aggregate investments in pharmaceutical research and development (R&D). There have also been claims that the IRA distorts the incentives to develop small molecule drugs relative to biological products.
Prescription drug manufacturers invest in product developments in two primary ways: through R&D and through acquiring other therapies.
For the first form of investment, pandemic-era spending on the development of vaccines and therapeutics to address COVID-19 resulted in record investment in R&D in 2021 that remained essentially flat in 2022. In the first quarter of 2023, major pharmaceutical manufacturers such as Pfizer, GSK, Sanofi, Bayer, Gilead, AstraZeneca, and Novartis noted increases in their R&D spending, and little in the way of specific concerns were noted that the new price negotiation program would inhibit their company’s growth or investment in new therapies. More recently, second quarter earnings calls by major publicly traded pharmaceutical companies describe continued positive projections for future earnings and product development. Most companies note that they are carefully assessing the implications of the prescription drug provisions of the IRA, yet they consistently express optimistic views about their longer-term future. For example, Novartis announced that expected future growth allow them to initiate an up-to $15 billion share buyback, while maintaining the flexibility for continued strategic bolt-on acquisition deals. Likewise, Johnson and Johnson completed a $8.5 billion share repurchase in the first half of 2023, and its CEO expressed excitement about future innovation and confidence in the near term and longer-term performance of the firm. Similar sentiments were echoed by GSK, Bristol Myers Squibb, and AbbVie.
A second form of investment in pharmaceutical development is through mergers and acquisitions (M&A). Research on the drivers of M&A in prescription drug markets has shown that such investments are more likely to take place when firms face patent expirations of their major products and holes in their internal development pipelines.
In this paper, we explore M&A activity in the U.S. pharmaceutical market prior to and following the enactment of the IRA, which was signed into law in August 2022. Specifically, we examine the number of deals, the value of deals, and the types of products being developed by the firms that are being acquired during the January 2021 to May 2023 period. Recent lawsuits and press reports have claimed that the IRA is affecting today’s development decisions. Our aim is to shed light on the extent to which the IRA’s drug price negotiation program may have altered the investment choices of pharmaceutical manufacturers as reflected in M&A activity.
The IRA introduces a mechanism for the Medicare program to negotiate prices for a targeted set of medicines primarily based on their time on the market and level of sales. That is, to be eligible for negotiation, a product must be a single source drug and must be on the market for a certain period before being subject to a negotiated price: for small molecule products, that time period is 9 years; for biological products, 13 years. In addition, a product must be among the 10 highest spending eligible products in Medicare Part D in 2023, and in subsequent years, between 15-20 eligible drugs will continue to be selected based on highest spending. It is unlikely that any drug chosen initially would have spending levels below $400 million.
In response to this policy, four drug companies and several trade organizations have filed lawsuits to halt its implementation, and various industry participants have voiced objections in Congress and with the press. As noted earlier, the industry’s main economic objections concern the impact the policy will have on revenues and the effect that those reductions would have on R&D investment. In addition, the industry has voiced their view that the law creates incentives for investment in biologic products at the expense of small molecule products because of the different eligibility periods and encourages investment in products used by younger commercially insured populations relative to Medicare beneficiaries.
For example, the recent lawsuit filed by PhRMA, the National Infusion Center Association, and the Global Colon Cancer Association makes the following claim: “Congress’s recently enacted Inflation Reduction Act of 2022, Pub. L. 117-169 (IRA or the Act), however, upends this time-tested, market-based system for encouraging innovation. In its place, Congress established a system of price controls, seeking to reduce expenditures even at the cost of drastically slowing innovation, reducing drug availability, and worsening patient outcomes.”
On the issue of distorted incentives regarding the types of drugs to develop, the CEO of Eli Lilly stated that “in 10 years we’ll have far fewer small molecules being developed than we do today,” a claim that suggests an adjustment of forward-looking investment choices.
These statements are in sharp contrast with projections made by the Congressional Budget Office (CBO), which estimates that the IRA’s drug pricing reforms would reduce industry revenues by about 7% over 10 years (2023-2032), which would result in a reduction of one drug coming to market over 10 years and 13 over three decades. For context, the FDA approves an average of 38 drugs every year. Together, this would reduce the number of drugs by about 1% over the three decades.
The market for prescription drugs is dynamic, and a variety of factors can affect global revenues for any one product. Analysts are presenting a mixed picture for revenue projections primarily due to reasons other than the IRA. The trade literature is projecting declines in revenue, but those projections are based on patent/exclusivity cliffs for several blockbuster products including Keytruda, Opdivo, Eliquis, and Humira. Overall, Statista is projecting global pharmaceutical revenues to grow by 5.8% per year over the next five years, through 2028. There is also a projected doubling in global spending on small molecule drugs from $76 billion in 2022 to about $152 billion in 2031. Expansion of insurance coverage worldwide, aging of the population (especially in high income countries), and technological advances in drug development are all projected to contribute to the growth in small molecule products and spending. This highlights the fact that investment decisions are not made on the basis of modest changes in one market’s circumstances but rather by an assessment of conditions across all markets in which they participate.
Together, this would reduce the number of drugs by about 1% over the three decades.
The upcoming loss of patent protection and exclusivity by many key products could put a great deal of financial pressure on pharmaceutical manufacturers to replace those sources of profitability with new medications. In the past, the response to such gaps in revenue streams has consisted of increased investment in development of new products through a combination of R&D and M&A activity. Recent reports in the trade literature suggest that the volume of M&A deals in the first quarter of 2023 are nearly double the first quarter of 2022. Moreover, the average value of a deal more than tripled from the first quarter of 2022 to first quarter 2023.
M&A activity in the prescription drug sector has been consistent with a moderate cyclical pattern in recent years. There have been high levels of M&A activity followed by ebbs in deal making. Recently, high inflation, reduced venture capital activity in the sector, and greater scrutiny of mergers by the Federal Trade Commission have all influenced M&A activity.
In this analysis, we examine patterns in M&A activity between January 2021 and May 2023 to assess any changes in activity patterns. We report on the number of deals, the size of deals, and the types of drugs being developed by the acquired companies with respect to whether they are small molecule or biological products (or both). We also examine the types of diseases the products from acquired firms treat for the purpose of identifying products that target diseases prevalent in older adults (Medicare beneficiaries) versus younger populations.
Data examined
We extracted Pitchbook data on all U.S. pharmaceutical companies that had merged with or been acquired by another pharmaceutical company from January 2021 through May 2023. We measured the timing of each transaction as the date of the deal’s announcement. We supplemented Pitchbook data with a BioPharma Dive dataset that documented pharmaceutical M&As from 2018 through 2023. Together, these extractions resulted in 368 company M&As. One reviewer went through this list and excluded any entries if the companies involved were not engaged in pharmaceutical drug development subject to the FDA regulatory process, if the acquired company was not publicly traded prior to the M&A, or if the acquired company was headquartered outside the U.S. A random sample of these companies was validated by a second reviewer to ensure replicability of findings. If reviewers disagreed, they discussed and resolved any discrepancies. Overall, 82 company transactions met our search criteria. As a further check on how well the sample reflected the industry overall, we compared aggregate M&A spending trends from the sample to the trends reported in the trade literature. They tracked each other closely.
Using Pitchbook data and online sources, we identified the dollar amount the firm was acquired for. For acquisitions, we then analyzed each acquired firm’s drug development portfolio to identify whether they specialized in small molecule or biologic drugs, whether the drugs they developed treated older adults (particularly in the 65+ year old Medicare population), and whether their pipeline was primarily early or late-stage R&D. For mergers, we underwent a similar process but instead analyzed both companies.
In this process, we assume that any ongoing M&As are equivalent as proxy for investment as are completed M&As. We also treat mergers and acquisitions similarly throughout the process.
Was there a break in M&A activity patterns associated with the IRA enactment?
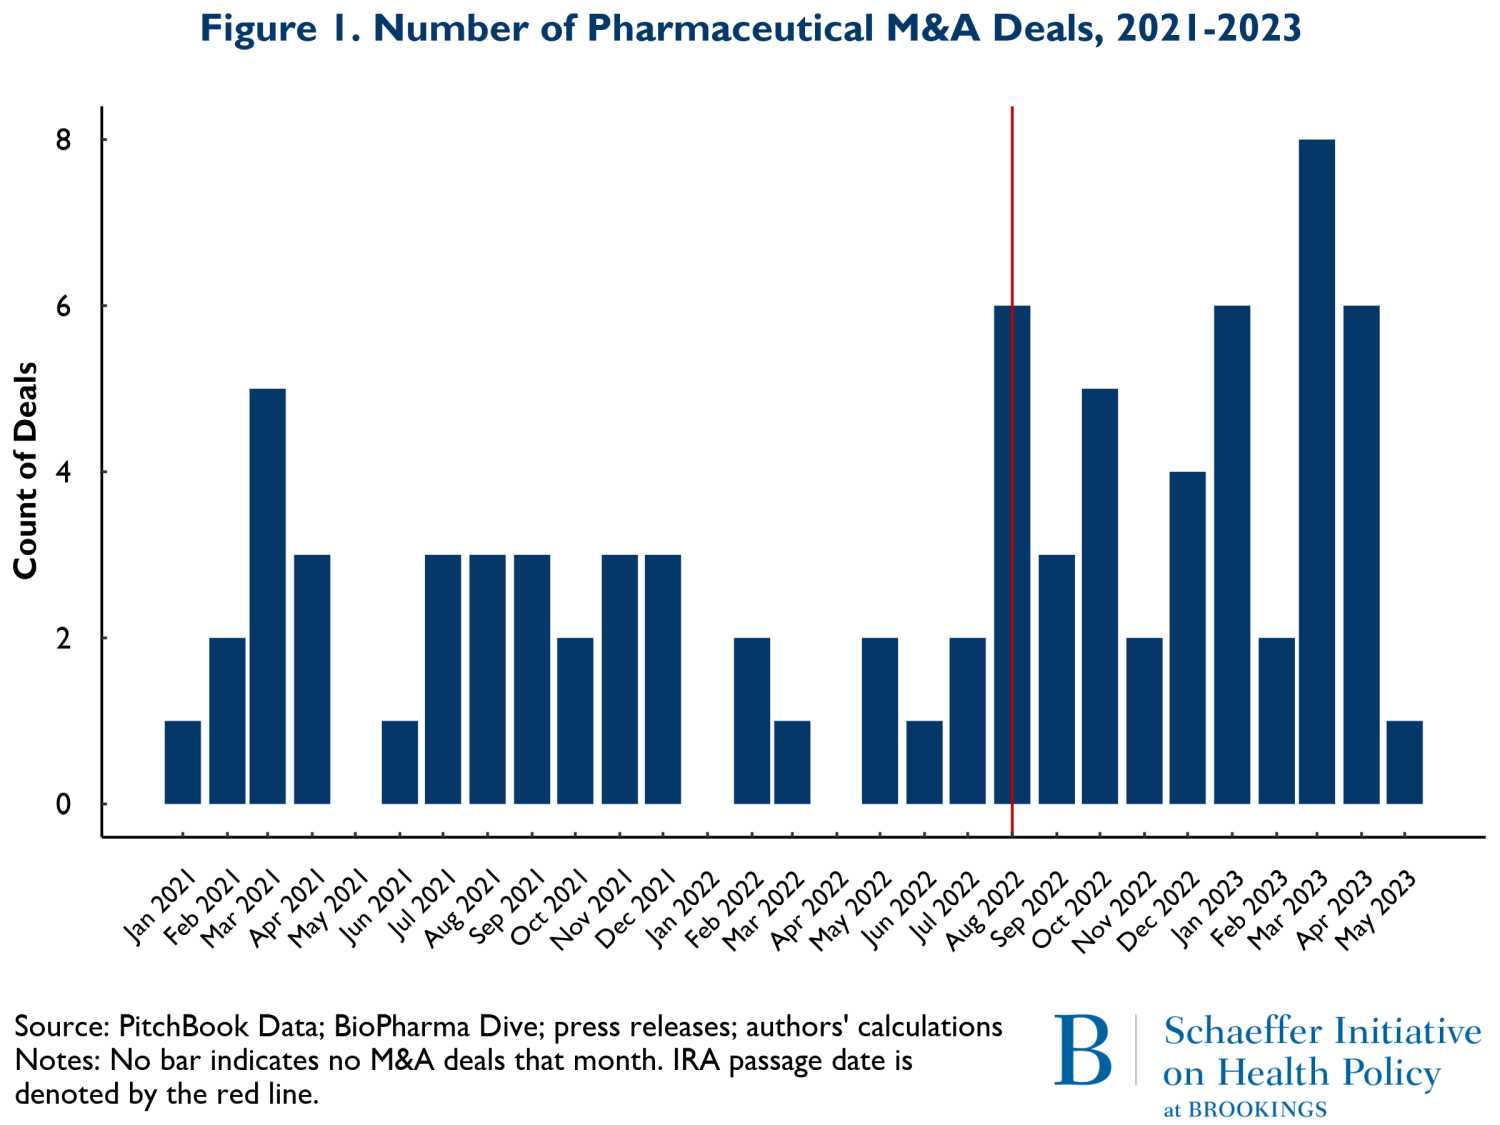
Figure 1 shows the number of M&A deals that occurred by month from January 2021 to May of 2023. The vertical red line represents the month the IRA was enacted, August 2022. The figure shows little change in the pattern of M&A activity. What changes did occur following the IRA suggest a slight increase in overall M&A activity. Since some of the development activities were well underway prior to the acquisitions reported here, the level of activity is only a partial view of forward-looking spending on new product development. To obtain a more precise view of the extent that changes in M&A activity represented investment in future periods when the effects of the IRA would be in force, we examined the stage of development for the products in development by the acquired firms.
In Figures 2a and 2b, we consider whether the drugs that are involved in M&A deals according to whether they are affected by anticipated market conditions multiple years in the future. Thus, Figures 2a and 2b show the patterns of M&A deals for companies with drugs in early-stage development (Phases I and II) versus later stages (Phase III and beyond). It is important to recognize that acquired firms can have both early and late-stage trials underway and some have no human trials at all. For ease of exposition, we removed deals where the numbers of early and late-stage trials were near equal. The patterns reflected in Figures 2a and 2b are therefore rough indicators of whether there have been any major shifts in the composition of M&A activities related to early stage more forward-looking developments versus products that are likely to come to market in the relatively near term.
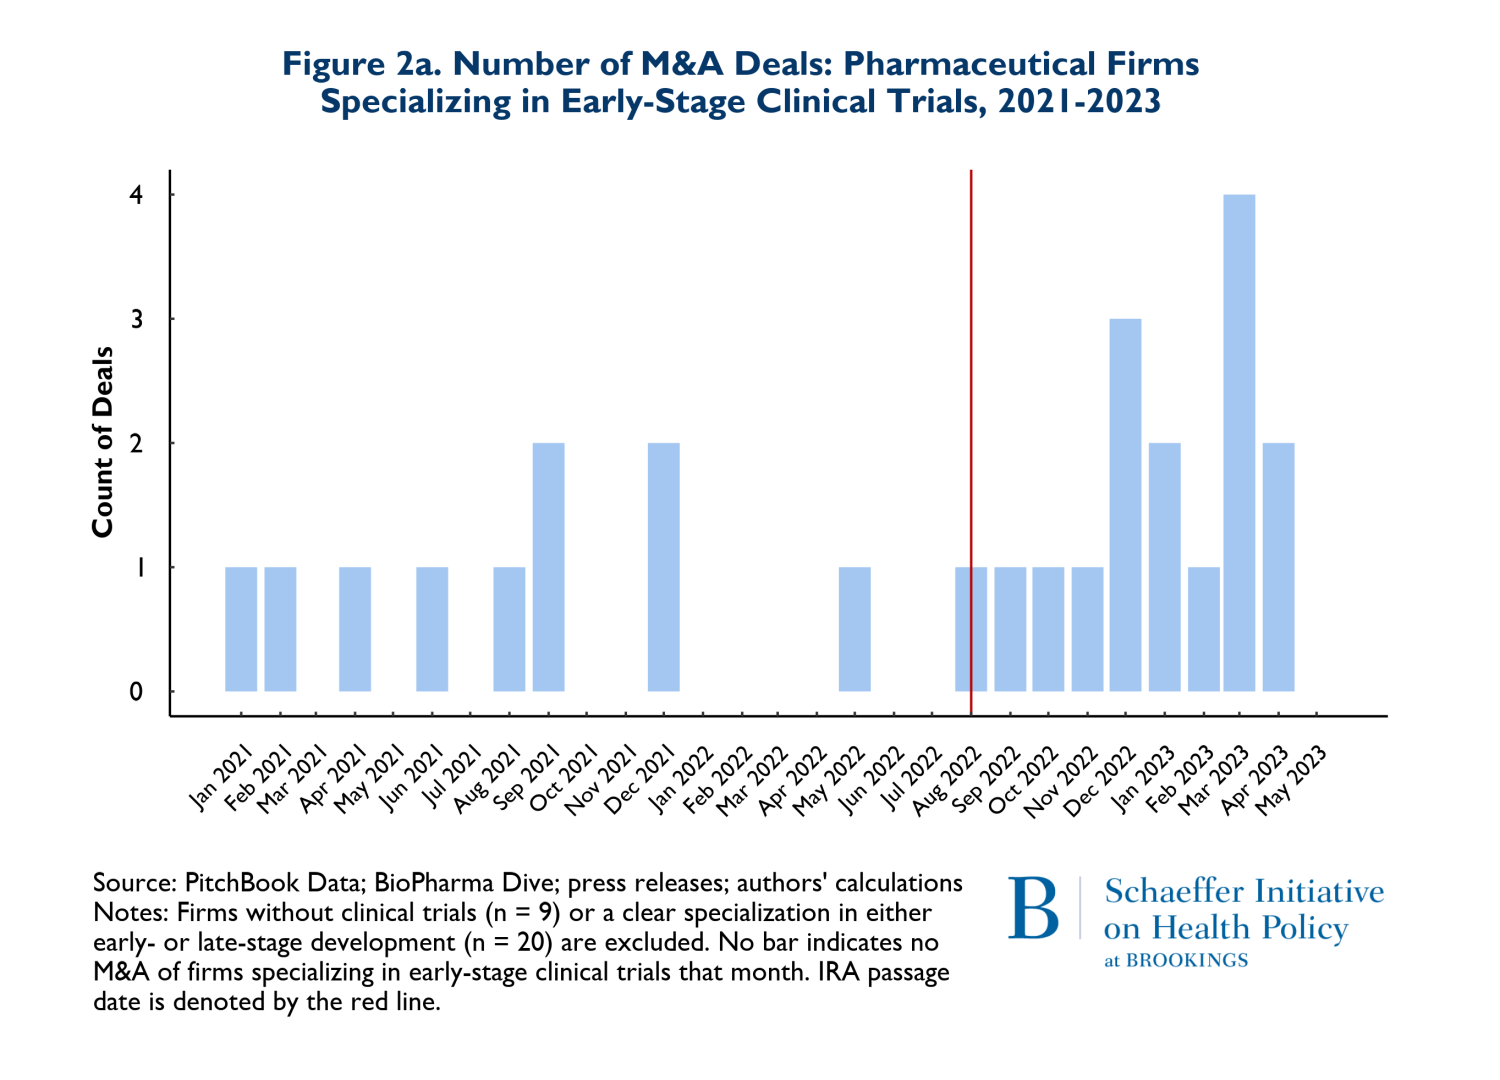
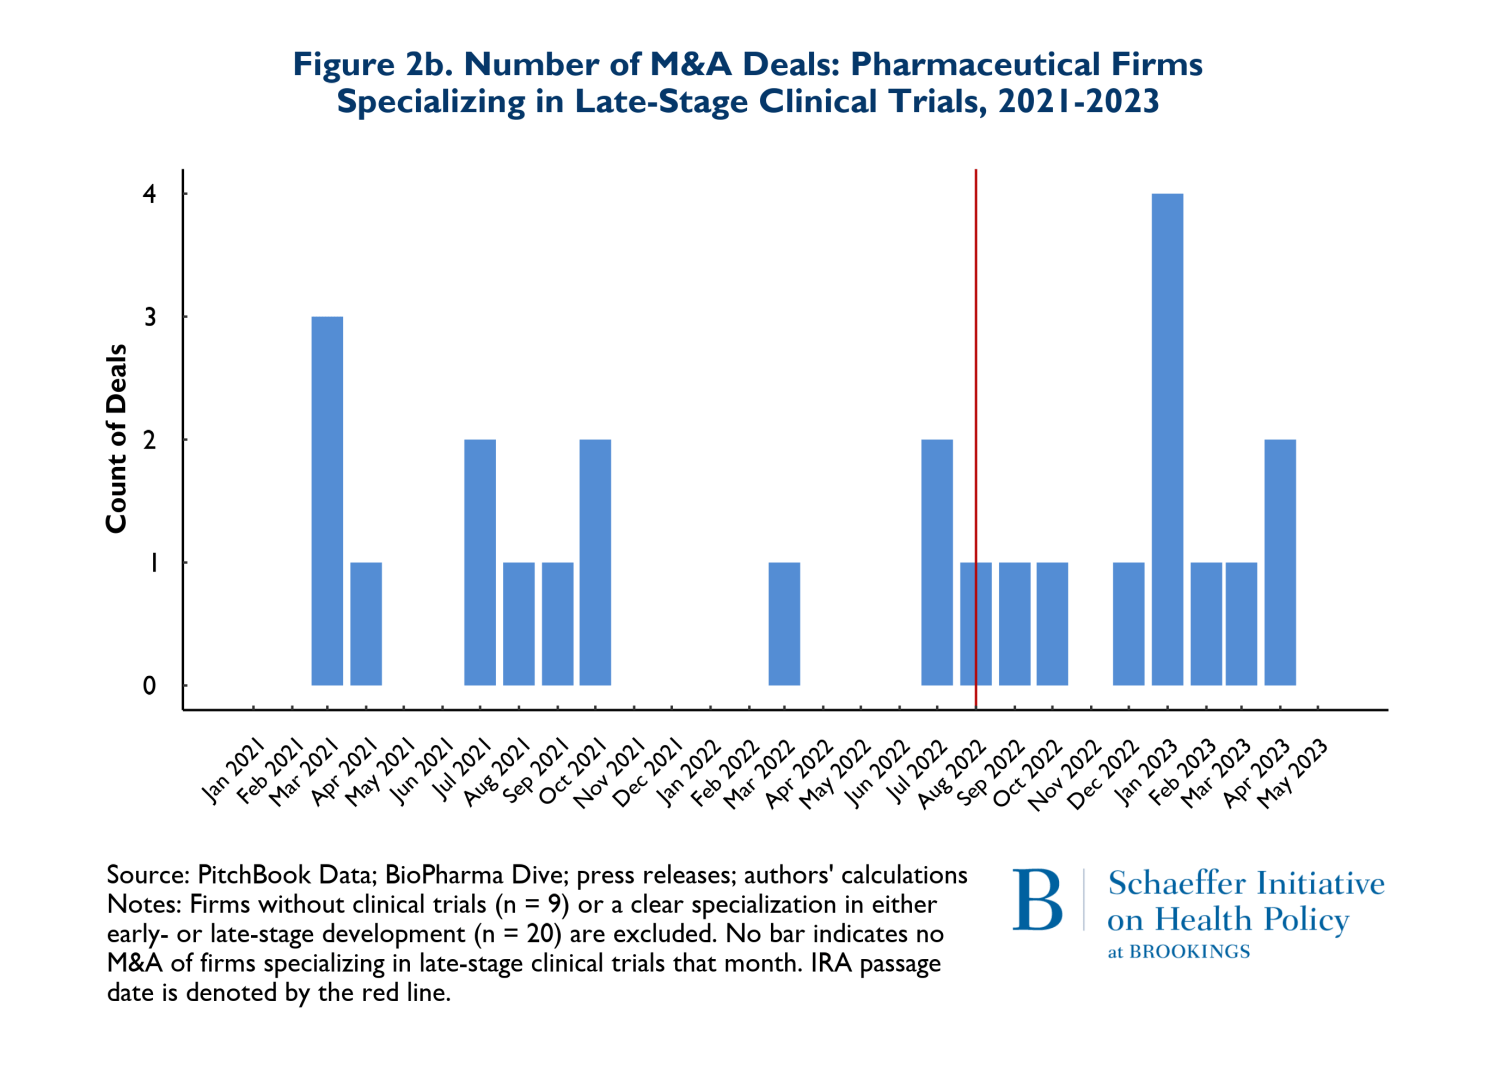
The figures suggest that there has been relatively little change in the composition of early versus late-stage trials. To the extent that there has been a change in pattern, there has been a small increase in both types of trials in acquired firms during the post-IRA period.
In addition to the volume of deals, we tracked the size of deals defined as the total number of dollars spent on mergers and acquisitions and the average size of the M&A deals. The value of deals is presented on Figures 3a and 3b. Figure 3a shows the total value of M&A deals throughout the observation period, while 3b reports the average deal size. Figure 3a clearly shows that the total money going into M&A is following the same pattern in the post-IRA enactment period as it did in the 20 months prior.
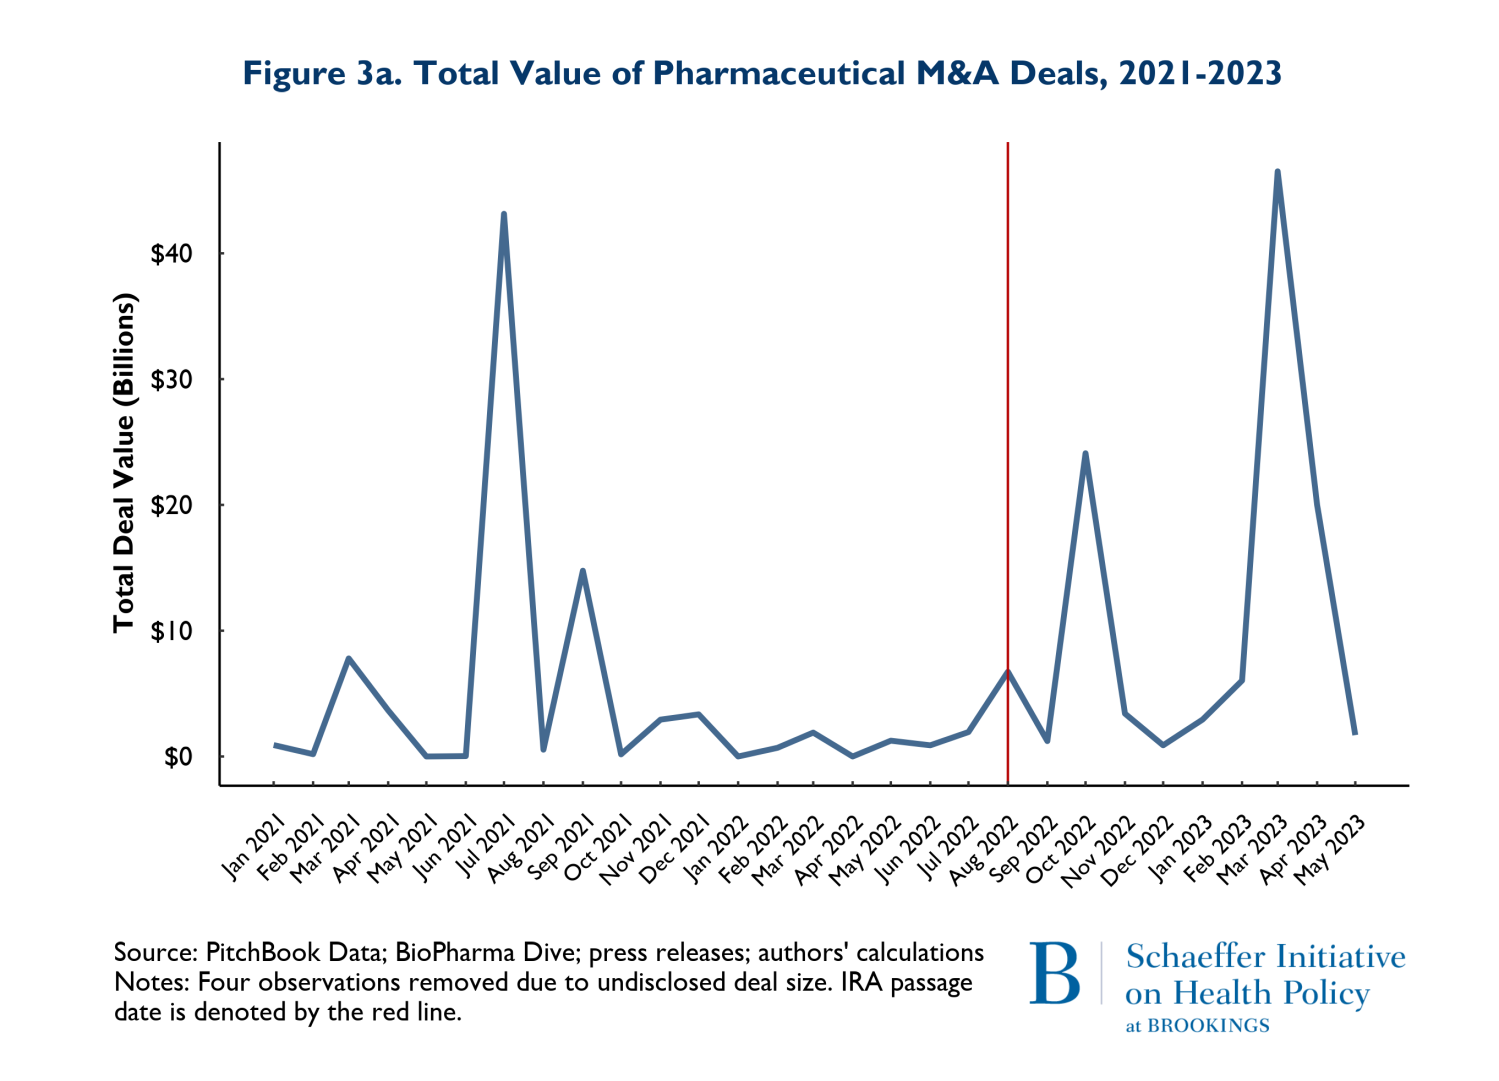
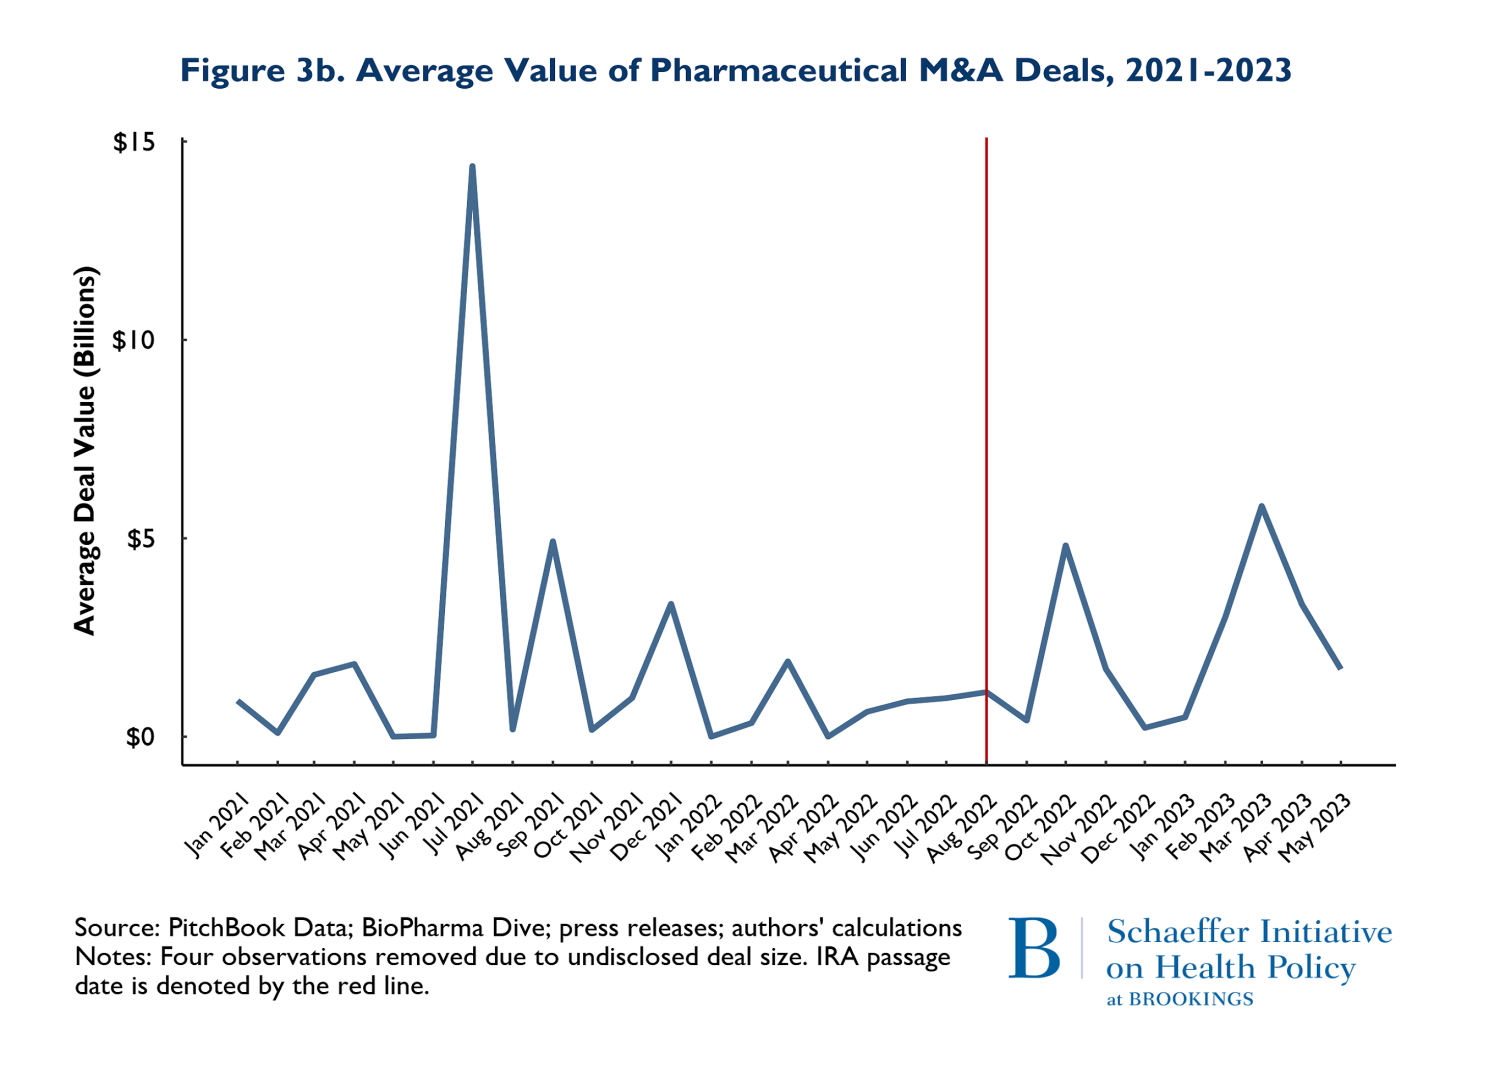
The patterns observed in Figure 3a is driven by two disproportionately large mergers. In July of 2021, AstraZeneca acquired Alexion and in March of 2023, Pfizer acquired Seagen. These two massive deals caused the “spikes” in the total deals: indeed, both deals were relatively similar in magnitude. The average deal size (Figure 3b) largely followed similar patterns pre and post IRA enactment. The one exception is that there was one month and one deal in July of 2021 that was larger than any subsequent M&A deal. The difference occurred because in July 2021, there were 3 total deals (including AstraZeneca-Alexion), and 8 total deals (including Pfizer-Seagen) in 2023. So, the deal in July 2021 was actually smaller than March 2023, but because March 2023 had so many deals, the average was brought down.
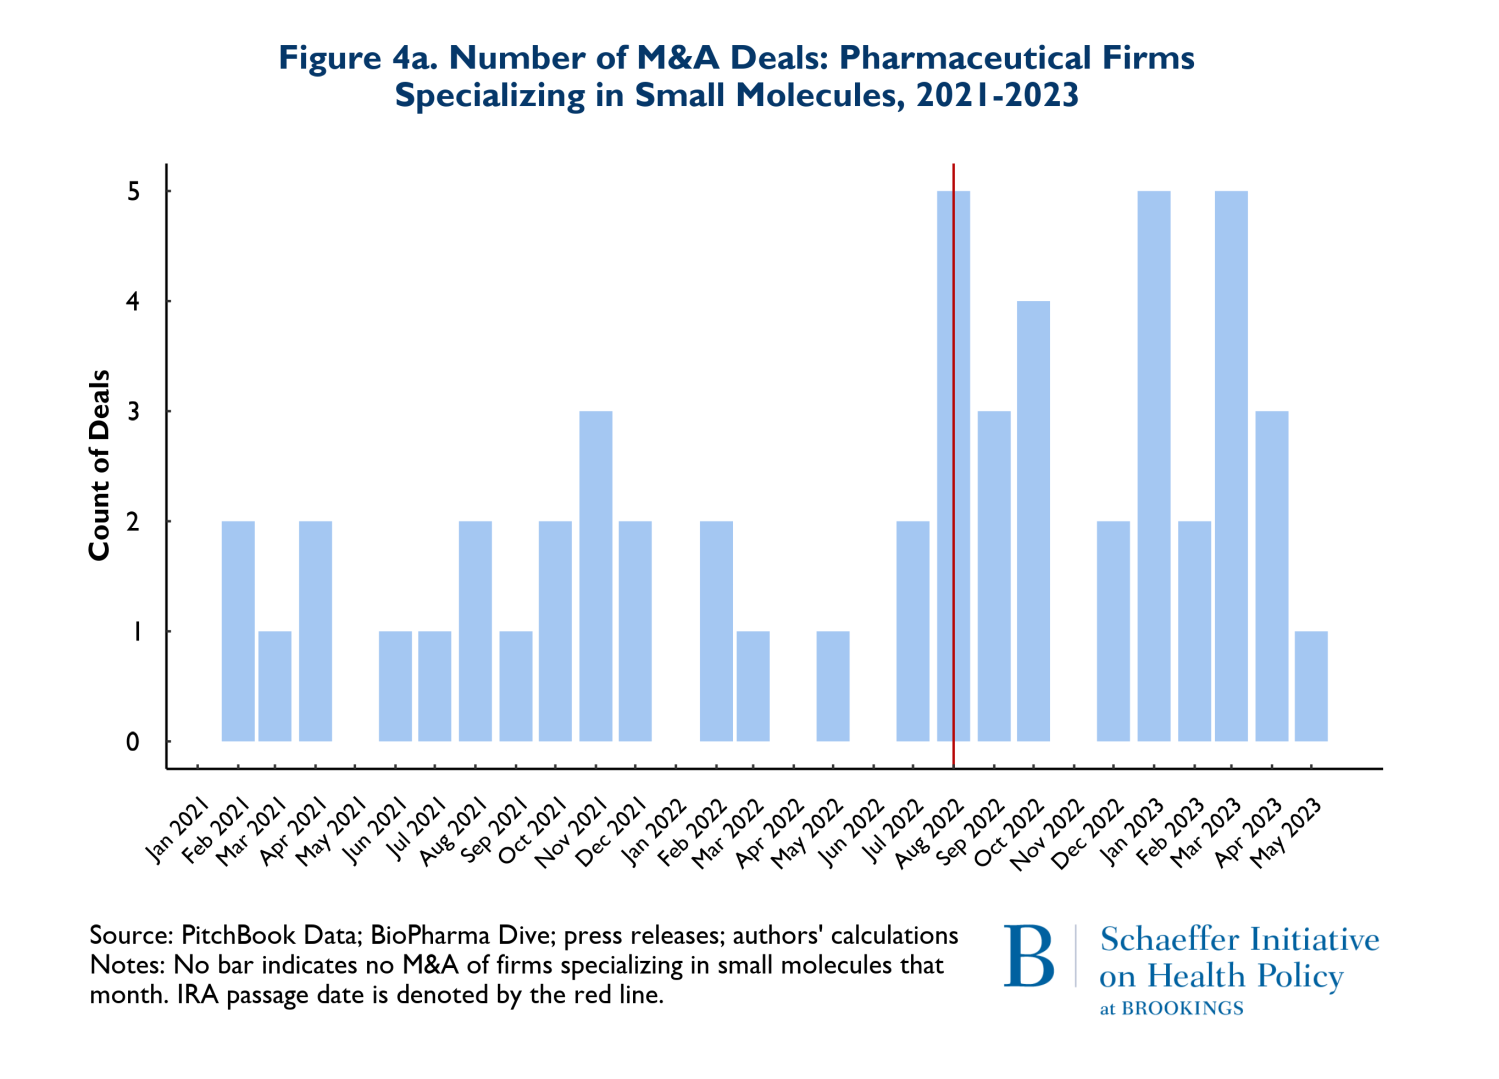
As noted earlier, it has been posited that the differences in criteria for being negotiation eligible between biologics and small molecules disadvantage small molecule investments and thus small molecule investment should be expected to decline significantly. Figures 4a and 4b reflect the composition of drugs involved in M&A deals according to whether they involve small molecules (4a) or biologics (4b). Once again, the red vertical line indicates the month when the IRA was enacted. The figures point to two notable points. First, 66% (53 of 80 products) of the drugs involved in M&A deals were small molecule drugs. Second, as Figure 4a illustrates, M&A activities that involve small molecule drugs increased in the nine months following enactment of the IRA. It is also worth noting that prior to the passage of the IRA, in the period between August 2021 and May 2022, there were 3 M&A deals that involved small molecule cancer drugs, while following the passage of the IRA, between August 2022 and May 2023, there were 9 small molecule cancer products involved in M&A deals.
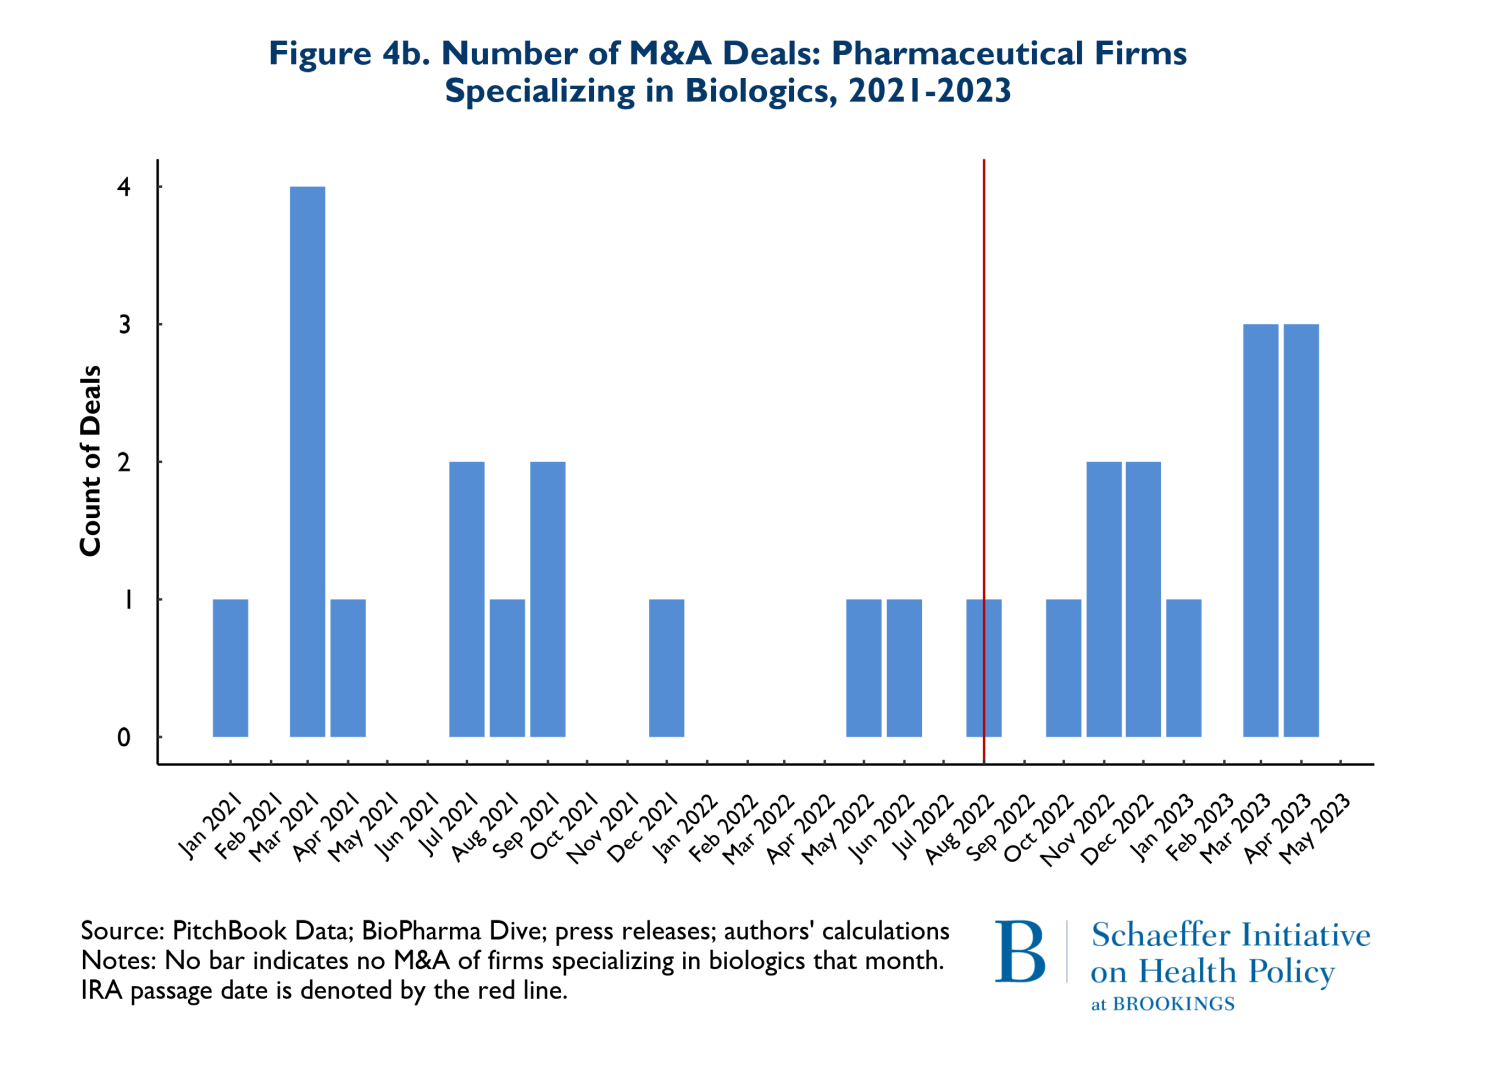
There was also a less pronounced increase in the number of biological products involved in M&A deals following the passage of the IRA. Roughly 68% of the 27 biological products involved in M&A deals were for cancer. Finally, the pattern of total spending on M&A that accompanied these trends is that the pre-IRA spending patterns remained in place during the first nine months following IRA enactment.
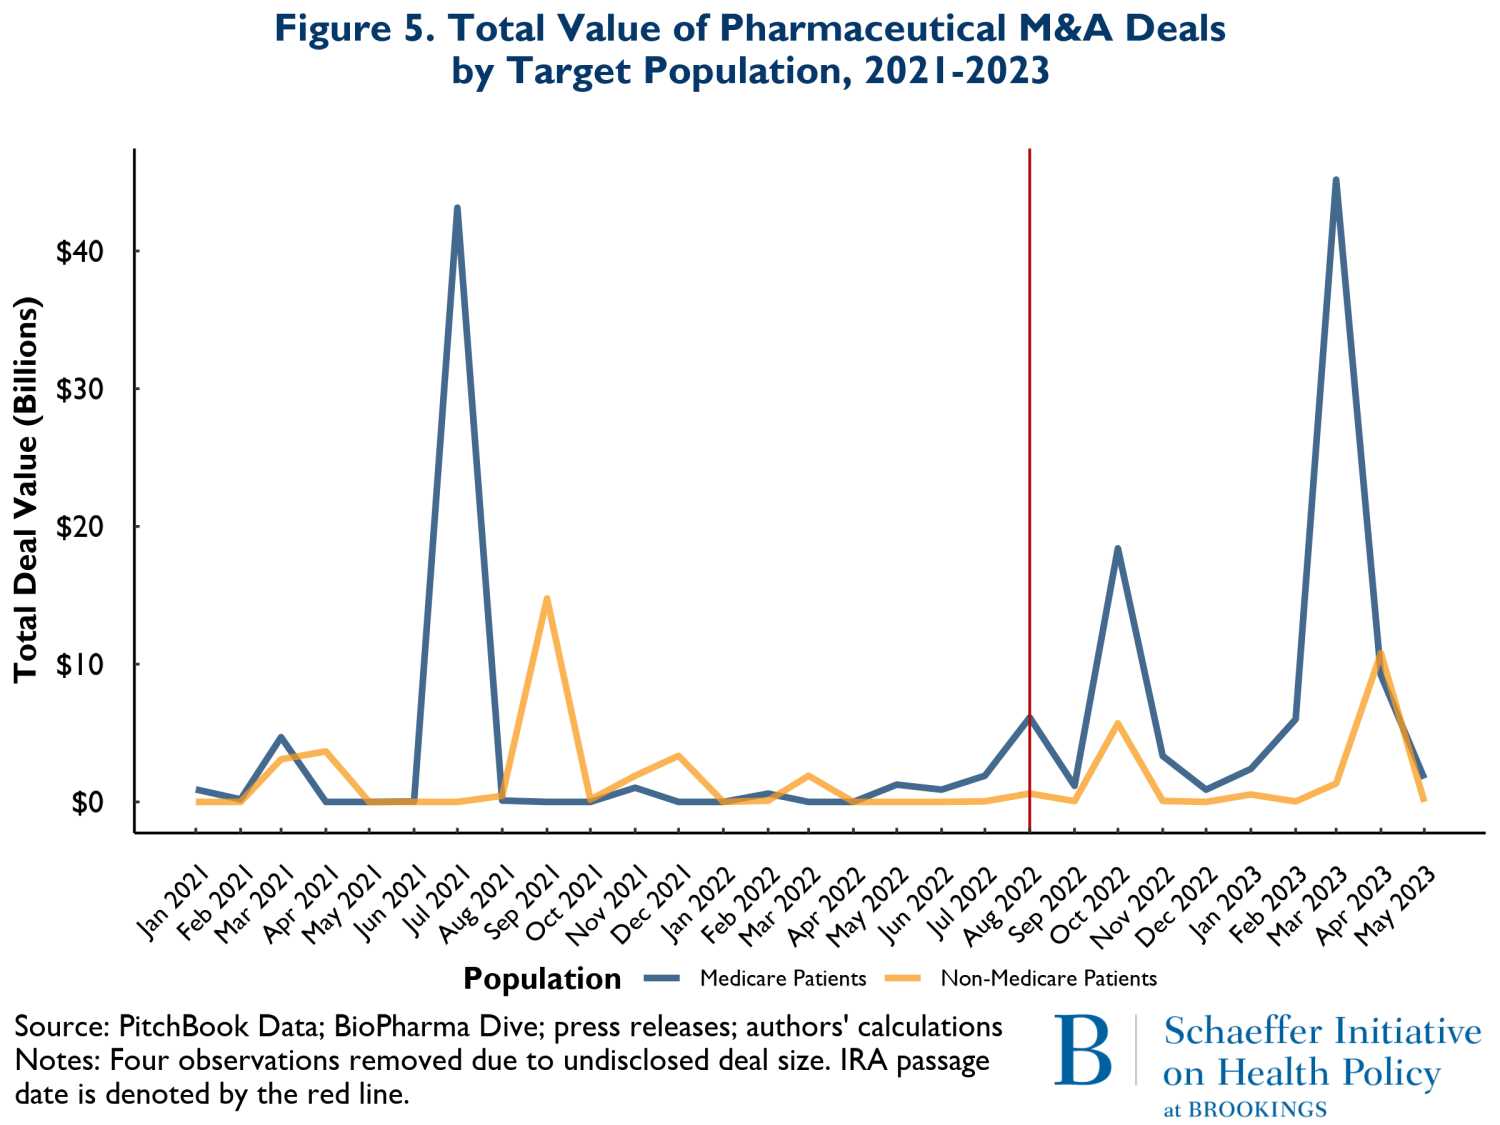
The final compositional change we examined was total M&A spending involving drugs that treat illnesses disproportionately affecting older adults (mostly covered by Medicare) versus those that treat younger population groups. Figure 5 shows the overall spending on M&A from January 2021 to May of 2023. The green curves represent spending related to M&A activity involving drugs likely serving mostly Medicare patients, while the yellow curves reflect spending on products that mostly serve younger groups of people. Here also the pattern of spending is very similar before and after the enactment of the IRA.
To date, we have found little evidence suggesting a disruption in activities and investments that will yield new pharmaceutical products in the years to come.
It has been less than a year since the IRA became law, and since its enactment, the drug industry has cited the law’s price negotiation program as a reason for discontinuing certain R&D projects. The industry has also expressed that the negotiation program is shifting investment away from new small molecule drugs, specifically cancer drugs and drugs that largely treat older adults. Our analysis shows that these statements are not reflective of M&A investment activity since the enactment of the IRA. To date, we have found little evidence suggesting a disruption in activities and investments that will yield new pharmaceutical products in the years to come. That is the case for the number of M&A deals being pursued, the total dollars being spent on M&A, and importantly, the types of products involved in M&A actions including early stage (small molecule drugs) and products that serve older adults.
When coupled with optimism expressed in recent large drug company earnings reports, the evidence indicates that the investment environment for drug development remains largely unchanged by the IRA’s drug price negotiation program and is currently not threatened by it.
Authors

Related Content


-
Acknowledgements and disclosures
The authors would like to thank Julia Paris and Caitlin Rowley for research and editorial support. They would also like to thank Andrea Harris and Marta Wosinska for comments on an earlier draft. This work was supported by Arnold Ventures.
The Brookings Institution is financed through the support of a diverse array of foundations, corporations, governments, individuals, as well as an endowment. A list of donors can be found in our annual reports published online here. The findings, interpretations, and conclusions in this report are solely those of its author(s) and are not influenced by any donation.
The Brookings Institution is committed to quality, independence, and impact.
We are supported by a diverse array of funders. In line with our values and policies, each Brookings publication represents the sole views of its author(s).