Internet speeds in the United States have for years lagged behind other developed countries. Slow internet speeds have also been an issue for schools, although progress is evident in recent years. In 2012, 70% of schools lacked internet connections fast enough to support basic administrative and instructional needs (100 KBPS per person), but now only 1.6% of school districts fail to meet that low bar.
Despite this progress, the Federal Communications Commission (FCC) is considering changes to the E-Rate program, which subsidizes internet access in schools across the country. The proposal would cap spending and potentially decrease the funding available to schools. This would threaten recent gains and create additional barriers to helping the few remaining school districts that lack adequate internet connections.
How fast is fast enough?
School internet speeds are measured in bandwidth (kilobytes per second) per student. This approach measures the possible speed assuming simultaneous usage by every student in a school. The table below describes the recommended download speeds for various activities. Some activities like online assessments require only 64 KBPS per student. Other activities involving streaming online video take over 1,000 KBPS per student. In 2014, the FCC set the goal for school internet speeds at 100 KBPS per person. (The FCC speed recommendation is KBPS per student and staff. Throughout this post, internet speeds refers to KBPS per students except with regard to the FCC speed recommendation, where I construct another measure where speed is KBPS per student and staff.) The State Educational Technology Directors Association (SEDTA) recommends at least 250 KBPS per student for online learning models like flipped classrooms or blended learning. This recommendation seems conservative because many students in conventional online learning models are engaged in off-line learning activities (whereas it is likely that nearly all people in a school will use technologies like email or assessments at peak usage times). School districts with internet connections of at least 250 KBPS per student should be sufficient to support virtually all school administrative or instructional needs.
Table 1: Recommended speeds for online activities
| Activity | Recommended download |
| Online multiple-choice assessments | 64 KBPS per student |
| FCC 2016 Goal | 100 KBPS per person |
| Online learning | 250 KBPS per student |
| Email and Web Browsing | 500 KBPS per student |
| Streaming digital video (Netflix) | 500-1,500 KBPS per student |
| Download 1 MB digital book in 5.3 seconds | 1,500 KBPS per student |
| HD-quality Video Streaming | 4,000 KBPS per student |
| Skype Group-Video Session, 7+ people | 8,000 KBPS per student |
| Download 6,144 MB movie in 8 minutes | 100,000 KBPS per student |
| Source: Adapted from Fox, Waters, Fletcher, and Levin, 2012. | |
How E-Rate works
The E-Rate program subsidizes the cost of telecommunications, telecommunications services, and internet access—as well as internal connections, managed internal broadband services, and basic maintenance of internal connections—for schools and libraries. Each year, the FCC provides nearly $4 billion to schools and libraries. Schools must apply to receive these funds and report the current upload and download speeds. E-Rate will cover between 20% to 90% of a school district’s expenses related to internet access. School districts with greater numbers of impoverished and rural students receive more funding.
EducationSuperHighway (ESH) is a nonprofit organization that provides technical support to school districts seeking to upgrade their internet access. ESH uses publicly available data from E-Rate and publishes information about the available bandwidth in school districts throughout the country. In their E-Rate application, school leaders likely report speeds advertised by internet service providers that can differ significantly from actual speeds. ESH puts in a considerable effort validating these publicly reported values with speed tests from school internet connections. The data include internet speeds from the vast majority of traditional public school districts (~91%). School districts that do not apply for E-Rate or take ESH’s speed test are excluded from these data. I combined the ESH data with school demographic characteristics (Common Core of Data), student poverty (Small Income Area Poverty Estimate), and school spending (Annual Survey of School System Finances) from 2017, the most recent year of available data.
Does E-Rate benefit students?
The available research suggests the relationship between internet communication technologies and student achievement is weak. Vigdor, Ladd, and Martinez (2014) found that gaining access to high-speed internet in the home was associated with a small but significant decrease in academic outcomes. Angrist and Lavy (2002) evaluated Israeli efforts to implement “computer-aided instruction” and found no association with student test scores. Evaluations of the E-Rate program itself have found null effects on student achievement. Goolsbee and Guryan (2006) found no evidence of a correlation between receipt of E-Rate funds in California and student test scores. Hazlett, Schwall, and Wallsten (2019) found an insignificant correlation between SAT scores and the receipt of E-Rate funds. Given this research, slow internet speeds are likely not harming student outcomes. However, schools need access for basic administrative purposes, to conduct online tests, offer support instruction, and communicate with parents.
The distribution of internet speeds
The variance of school internet connection speeds is quite large. The distribution of internet speeds has an extreme right skew. The average district has 1,484 KBPS per student and the median is 654 KBPS per student. The figure below visualizes the log of the KBPS per student by school district, where the red line indicates the median internet speed (654 KBPS per student). About 5% of school districts appear to have very fast internet speeds (greater than 5,000 KBPS per student) capable of supporting any technology that relies on the internet. At the other end of the distribution, about 15% of school districts fall below the 250 KBPS threshold recommended by SEDTA needed for online learning. This includes several hundred districts that have connections barely suitable for light email use, and 33 school districts (about one-third of a percent) do not have internet speeds capable of using online multiple-choice assessments.
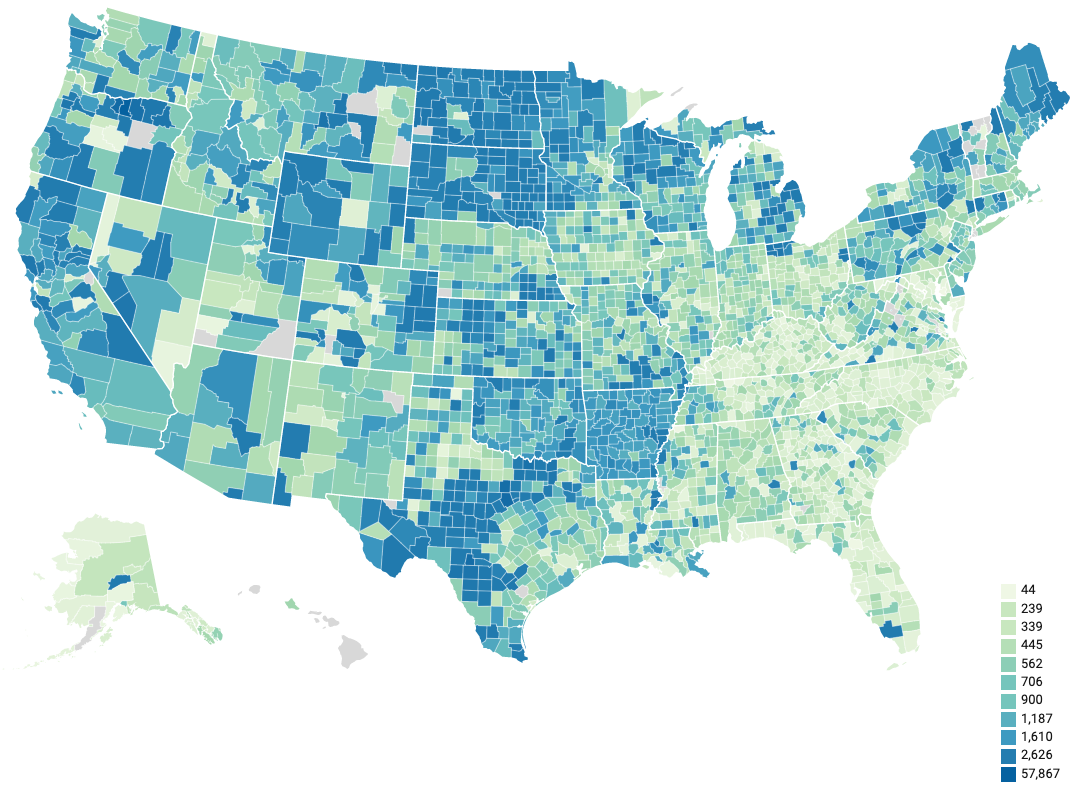
The map below displays the average school internet speed by county. Lighter greens indicate slower average internet speeds per student while darker blues indicates faster connections. The map visualizes the wide variation in school internet speeds. In particular, differences across states and urbanicity are present. Internet speeds in Appalachia appear quite low. However, states including Arkansas, Oklahoma, South Dakota, and North Dakota that have many school districts in rural communities have higher-than-average school district internet speeds. One possible explanation for heterogeneity in speeds across states is proximity to the internet “back bone.” Internet access close to these underground cables could be both faster and less expensive. It’s also likely that state policies supporting internet technology in schools that supplement E-Rate could account for some of the variance in school internet speeds.
Figure 1: Average KBPS per student by county
Internet speeds in rural school districts were, on average, faster than urban areas. In fact, 18% of school districts in urban areas had average internet speeds below 250 KBPS per student. These results should be read with considerable caution due to the strong likelihood of selection bias. None of the school districts missing from the dataset received E-Rate funds and the vast majority of school districts not observed in the dataset are in rural areas. School districts that are not observed are very likely to have slower internet speeds on average because none have E-Rate funds to boost their speeds. In addition, the missing school districts in rural areas are more likely to have internet connections that cost more and are slower.
School districts with more at-risk students and fewer resources typically have slower internet connections. Internet speeds appear to be negatively correlated with the number of impoverished students in the school district. About 29% of school districts with the most impoverished students (top quintile) do not have average internet connections greater than 250 KBPS per student. The association between per student expenditures and internet speed is positive. Only 4% more school districts in the top quintile of per-student spending have average internet speeds greater than school districts in the first quintile. The race/ethnic makeup of a school district also appears to be related to internet speeds. The percent of black students in a school district is negatively correlated with internet speed, and the number of white students is positively correlated with internet speeds: 91% of school districts with relatively few black students (0% to 20%) have internet connections faster than 250 KBPS per student, while 78% of school districts that are 81% to 100% black have average internet speeds that fast.
The future of E-Rate
American internet speeds will likely lag behind other countries into the future. Lack of competition and investment in the last mile of infrastructure remain systematic issues that E-Rate is ill-suited to address. Policymakers should strive to achieve two goals. First, protect the dramatic increases in school internet speeds that have occurred over the past five years. Second, state and federal policymakers should strive to protect the success of E-Rate and target the few remaining districts with very slow internet connections.
The proposal to cap E-Rate spending is only in the early stages, and there’s not sufficient information to judge at this moment whether it would threaten current progress. The original purpose of E-Rate according to the FCC was to ensure that schools have access through discounts and grants (see section X). But capping spending seems insufficient for addressing the avowed goals of dealing with fraud in the E-Rate program. Stepping up enforcement or requiring more-detailed reporting would better address that problem. If a cap prevented school districts from getting E-Rate funds that they currently receive, then it would slow down average internet speeds. School district demand for broadband is somewhat close to supply. School districts use E-Rate to pay not just for equipment like routers and Wi-Fi, but also monthly internet connection fees. Any cuts to E-Rate could directly influence a school’s ability to afford internet access.
A notable concern: It appears school districts with slow internet speeds tend to enroll more at-risk students. Given the evidence that internet connections in the home and school are weakly related to student outcomes, it’s unlikely that slow internet speeds are preventing improvements in the classroom. However, there is a baseline level of internet access that schools need to function for administrative needs (e.g., email, Chrome applications, Dropbox) and for educational purposes (e.g., online assessments, streaming video). The E-Rate program benefits partners in all sectors (schools and internet service providers), and the FCC should continue this successful policy rather than changing course and risking recent gains in school internet speeds.
The Brookings Institution is committed to quality, independence, and impact.
We are supported by a diverse array of funders. In line with our values and policies, each Brookings publication represents the sole views of its author(s).


