Executive summary
Deterring the People’s Republic of China (PRC) from initiating war is a necessary but not sufficient condition for preventing war. The Department of Defense must also be prepared to respond safely and effectively to People’s Liberation Army (PLA) operations that threaten local and regional U.S. interests and that erode the standards and expectations of behavior that reflect and perpetuate U.S. leadership throughout the Western Pacific and beyond.
Such a response will require deploying increasingly sensitive and comprehensive indications and warnings (I&W) chains. The United States must also design strategies of deterrence that have both a high likelihood of successfully conveying U.S. intent, and a low likelihood of miscommunication, confusion, and unintended escalation. Combining a suite of readily available and rapidly advancing commercial technologies into a deterrence response monitoring (DRM) capability can help achieve both goals. Developing such a capability not only is technologically feasible and affordable, it also is compatible with the Department of Defense’s evolving technology bureaucracy.
Introduction
The enormity of the consequences of war between the United States and China means that the primary objective of the Department of Defense (DoD) must be to minimize the likelihood that war will happen. It is reasonable to assume that the PRC shares that objective, for the same reason. This means that if war does occur, it almost certainly will be the result of miscommunication, misperception, miscalculation, or accident. The value of emerging technologies to the Department of Defense, therefore, will not be realized through their contributions to the conduct of war, but rather through their central role in preventing it.
The likelihood of a surprise nuclear or high-end conventional attack is low. The U.S. nuclear arsenal and its conventional forces are robust and ready deterrents, and the interagency has well-established mechanisms for recognizing and responding to any large-scale use of force. Deterring the PRC from initiating war, however, is not enough to prevent war entirely. Preventing a U.S.-PRC war also requires reducing the likelihood that any one conflict of interest will devolve into an escalatory action-reaction crisis, fueled by misunderstanding and fear. The DoD must therefore be prepared to respond safely and effectively to People’s Liberation Army (PLA) operations that threaten local and regional U.S. interests, and that erode the standards and expectations of behavior that reflect and perpetuate U.S. leadership throughout the Western Pacific and beyond.
Such a response will require deploying increasingly sensitive and comprehensive indications and warnings (I&W) chains. The United States must also design strategies of deterrence that have both a high likelihood of successfully conveying U.S. commitment, and a low likelihood of miscommunication, confusion, and unintended escalation. Combining a suite of readily available and rapidly advancing commercial technologies into a DRM capability can help achieve both goals.
Deterrence Response Monitoring (DRM): Using technology to learn from a deterrence feedback loop
Automation, sensing, data capture, processing, and analysis technologies are now sophisticated and affordable enough to efficiently and persistently monitor regional and even global activity in all domains — land, air and space, sea surface and sub-surface, and cyber. The sensitivity and reliability of such surveillance can enable the DoD to establish a baseline of PLA behaviors. The Department can then identify and assess deviations against this baseline, helping it differentiate intended signals from indications and warnings (I&W) from standard noise.
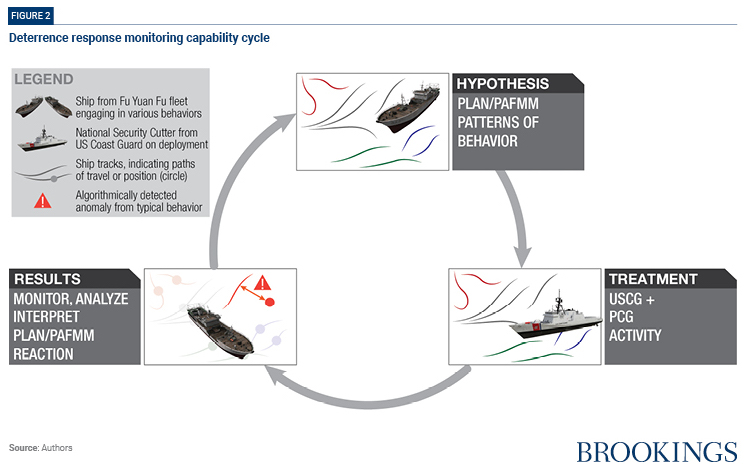
Such technology can also increase the effectiveness of U.S. efforts to influence PLA behavior. Technology now affords the DoD the opportunity to test and assess how other countries respond to an expansive set of actions: from deployment and movement of military assets or personnel, to information operations on open- or closed-source digital platforms. Correlating such U.S. actions with PLA reactions can reveal China’s sensitivity to different types of U.S. operations, and to particular geographies, resources, and relationships. Such experimentation can provide insight into the PRC’s values and motivations and can generate information about their defensive options and operational procedures. The DoD can use these findings to avoid activity that might precipitate an unwanted crisis; to purposefully intensify or relax a threat to PRC interests with high confidence that the signal will be interpreted as intended; and to prepare for any likely response.
Consistent fielding of and learning from a technology-enabled feedback loop — deterrence response monitoring — will give decisionmakers high confidence that the DoD has a reasonably accurate understanding of PLA patterns of life. It will also give them high confidence in the DoD’s ability to identify meaningful deviations from baseline; and high confidence that the DoD can send signals that are likely to be interpreted as intended. This information will equip the DoD to operate in all domains, locally and globally, in ways that defend U.S. interests without increasing the likelihood of surprise, misunderstanding, and crisis.
Countering the illegal activities of the People’s Armed Forces Maritime Militia
It is now feasible to track many observable behaviors on PRC territory and beyond, by using large-scale sensing and computing. Monitoring activities such as infrastructure development, commodities investments, construction activity, and troop movements can produce massive amounts of data useful to I&W analysis. The way in which these tracking technologies can be applied to address a concrete problem at sea serves as a useful example of both what is needed to create a DRM capability, and the value it can return to the DoD.
The People’s Armed Forces Maritime Militia (PAFMM) is a collection of vessels and personnel that claim to be commercial but are known to be subsidized by the PRC government and to operate aggressively both independently and alongside the PLA Navy (PLAN).1 PLAN/PAFMM behaviors in East Asia’s seas often violate international law, challenge U.S. interests, and disrupt the lawful activities of U.S. regional allies and partners.
The Indo-Pacific Strategy of the United States prioritizes supporting “rules-based approaches to the maritime domain, including in the South China Sea and the East China Sea.”2 Implementing this strategy will require countering illicit, illegal, and coercive PLAN/PAFMM activities. The DoD can execute its role in this strategy by using readily available and cost-effective technologies to deploy an efficient I&W chain, to monitor and alert leaders when a problem may arise.
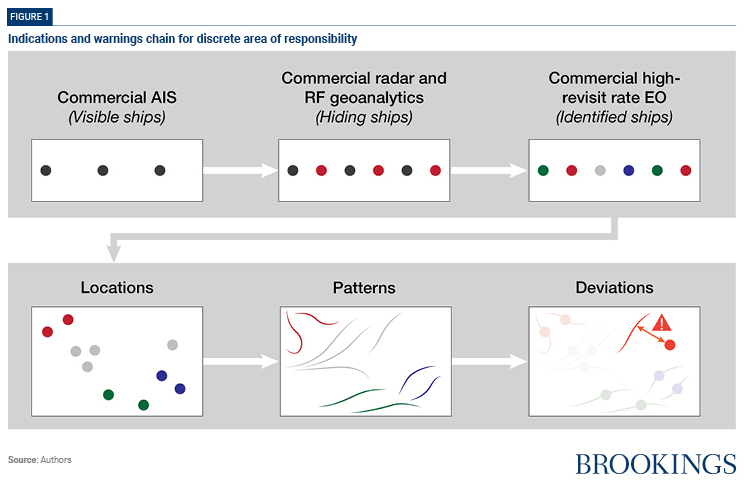
An efficient I&W chain has three components: data acquisition; data analysis; and anomaly detection. Such a system to detect and counter malign PLAN/PAFMM behaviors can be constructed using current technologies.
- Data acquisition: Establishing a baseline pattern of life in any maritime domain requires a multi-layered approach to identifying and tracking ships in the area of operation. Using multiple inputs refines estimates and minimizes the likelihood that denial and deception techniques will succeed — efforts at data tampering and identity manipulation, for example.3 Automatic Identification System (AIS) transponders are required on nearly all large commercial vessels, and often on recreational vessels. The data they generate is available from multiple commercial sources.4 AIS data can be complemented with radio-frequency geolocation data. These systems track emissions — from very high frequency (VHF) communication links, for example — and geo-locate the source of the signal.5 Electro-optical imagery can be added to provide tracking and positive ship-type identification.6 Commercial satellite constellations operate globally with local revisit rates — the duration between each time it passes over the same spot on earth — of hours, not days, and are sufficient to track vessels that move up to 30 knots.7 Some areas, such as ports and chokepoints can be scanned even more frequently using data from multiple constellations to provide cues of activity. Synthetic aperture radar (SAR) can be used to compensate for predictable and sometimes non-routine environmental conditions, making it possible to identify ships at night and in bad weather.8
- Data analysis: Combining multiple sources of data allows modern techniques of data analysis to produce location histories — paths of travel — for each ship identified. Taken together and over time, these tracks describe patterns of life: typical behaviors, habits, routes, and routines for ships and groups of ships.The analytic methodology for this type of pattern characterization is well understood.9 It is frequently applied on bounded problem sets, including radar tracking for airspace management, and is expected to be equally useful for application at a larger scale.
- Anomaly detection: With baseline conditions established through analysis of multiple data inputs over time, it is possible to see deviations from expected behavior, such as unusual pairings of co-located ships or indications that a ship’s track differs from its typical routine.10 Automation can be applied to generate alerts for further investigation.
Deploying a DRM prototype
A maritime surveillance technology stack will enhance DoD’s situational awareness. When used purposefully, it will allow the Department to measure more accurately PLAN/PAFMM responses to actions, events, or intentional probes. Were the U.S. Coast Guard to cooperate with the Philippine Coast Guard in a joint exercise, for example, would the pattern of PLAN/PAFMM activity change? Or if a news report were published in a major outlet about a specific set of illegal fishing activity? Carefully designed tests can provide insight into the reactions of PLAN/PAFMM to such stimuli and may reveal whether an action is perceived as surprising or threatening, or merely harmless or peripheral.
Technical feasibility: The social media proof of concept
Correlating the responses of the PLAN/PAFMM to discrete signals introduced into a noisy environment is a non-trivial technical challenge. It can be achieved, however, by using many of the tools and techniques that social media companies currently apply to extremely large and highly complex commercial problem sets.
Although there are obvious differences in the medium of action and in the objective being sought, the correlation methods that make targeted advertising effective for digital platforms can also be effective in a maritime operations feedback loop. The conceptual task for both is to discern the independent effect that a purposeful intervention has on the behavior of a targeted actor. Digital platforms like Facebook need to distinguish advertisements that are more likely to produce purchases from those that are not, just as the DoD needs to distinguish which actions are more likely to elicit PLAN/PAFMM responses from those that are not.11
To achieve this, Facebook uses large-scale computation and machine learning (ML) models to infer the causal effect of its advertisements on user behavior. Deliberate and repeated experimentation provides data used by the ML algorithm to improve its estimates over time, increasing its ability to predict correctly which ads will produce a reaction. Similar methods are applied to determine which users are more likely than others to be receptive to particular ads.
In 2020, Facebook served more than 10 trillion of these ad signals to its network of around 2 billion individuals, operating from 85 data center buildings.12 In the DoD context — with an audience that is smaller, less dispersed, and more structured — these techniques can help to identify which actions by the United States and its allies and partners are more likely than not to produce a PLAN/PAFMM response; to associate those actions with the way in which the PLAN/PAFMM responds; and to make informed predictions about which element or elements of the PLAN/PAFMM are more likely to respond than others.
Organization and management
Consistent fielding of and learning from DRM will require central coordination of DoD inputs and assets, reconciliation of authorities, and established mechanisms for communicating results to relevant stakeholders. Experimental scenarios will rely on intelligence, will involve or affect one or more combatant command and military services, and will require communication with local allies and partners. Program leadership will therefore need to be located within the Department to have access to the various military components, command staffs, and defense-wide organizations.
Initial fielding of a DRM program would fit within the purview of the Office of the Chief Digital and Artificial Intelligence Officer (CDAO). It could be led by a principal staff assistant to the secretary of defense, with a mission set that includes the administration of the computing and ML technologies that form a DRM capability, and of the analytic tools and techniques that bring value to decisionmakers. The CDAO would establish and support the necessary computing infrastructure, internal management processes, external relationships, and operational plans.
Resourcing
The resource requirements of a DRM program include human talent, data feeds, data integration and analytics tools, and computing infrastructure. The annualized cost of making these investments on a scale suitable for defining and conducting one experimental scenario is estimated to fall between $50 million and $90 million. The cost of introducing new experimental scenarios thereafter will be lower, benefiting from economies of scale in data acquisition, analytics development, and infrastructure. For Project Maven, the Department’s largest centralized data and analytics effort, these requirements cost approximately $250 million each year.13
The cost can be broken down as follows:
- Personnel ($2 million-$3 million): Only a small oversight team is needed to run such an effort. Initial staffing should include an experienced program manager supported by four technical and financial/business management staff. One contractor team of six full-time employees is needed to integrate the program’s data and analytics capability with DoD infrastructure.
- Data ($18 million-$58 million): Multi-source AIS and similar commercial data feeds are available for under $1,000 per month. The U.S. government already purchases a large quantity of commercial geospatial intelligence (GEOINT) data. The National Geospatial Agency’s Global Enhanced GEOINT Delivery program and the National Reconnaissance Office’s Electro-Optical Commercial Layer contract, for example, provide direct tasking and offload of earth observation imagery from the Maxar satellite constellation, Planet Labs, Black Sky, and others. These data inputs will be useful to a feedback loop capability, and the additional tasking will incentivize these and other companies to seek private investment for purposes of expanding their constellations and capacity, and to improve sensor capabilities.
- Analytics ($15 million-$20 million): There is no generic algorithm or ML model that can translate directly from one experimental scenario to another. Each will require the tailored development of specific models by skilled data scientists with domain expertise and a deep understanding of sensor phenomenology. This work can be achieved by two contractor teams of five to nine full-time employees, based on similarity with historic Defense Advanced Research Projects Agency analytics development programs, which cost $15-20 million per year. Some additional investment in robust data integration and presentation tools may also be needed and can be acquired commercially with licensing costs in the low millions of dollars per year.
- Infrastructure (<$10 million): While the scale of the computational power needed, as measured by the number of servers, is low — averaging a load of around 1000 high-performance central processing unit (CPU) cores — achieving it is complicated by regulations and security constraints on DoD usage. Even with emerging cloud computing contracts, there are no off-the-shelf environments that can handle some complex security considerations. This means the DoD is likely to need to build out the necessary infrastructure and to cover accreditation and management costs. Nonetheless, a constrained scenario is relatively straightforward and in total is estimated to aggregate to the low millions of dollars in annual cost.
Conclusion
Deterring attack on the United States and challenges to its security interests has been the primary objective of the Department of Defense since World War II. The 2022 National Defense Strategy retains this priority, while also acknowledging that fulfilling that mission in the contemporary environment requires the use of more specialized tools, applied and integrated in more ways, over space and time.
The DoD has the authorities and the resources it needs to enhance its ability to deter behaviors that threaten U.S. interests in regions of strategic significance in ways that reduce rather than raise the risk of unintended conflict. Developing a DRM capability not only is feasible and affordable, it also is consistent with the Department’s prioritization of experimentation with emerging technologies and compatible with its evolving technology bureaucracy.
-
Acknowledgements and disclosures
The authors would like to thank Alex Dimsdale and Adam Lammon for their editorial assistance and Rachel Slattery for web layout.
-
Footnotes
- Gregory B. Poling, Harrison Pretat, Tabitha Grace Mallory and the Center for Advanced Defense Studies, “Pulling Back the Curtain on China’s Maritime Militia,” (Washington, DC: Center for Strategic and International Studies, November 2021), https://csis-website-prod.s3.amazonaws.com/s3fs-public/publication/211118_Poling_Maritime_Militia.pdf?VersionId=Y5iaJ4NT8eITSlAKTr.TWxtDHuLIq7wR; Derek Grossman and Logan Ma, “A Short History of China’s Fishing Militia and What It May Tell Us,” (Santa Monica: RAND, April 6, 2020), https://www.rand.org/blog/2020/04/a-short-history-of-chinas-fishing-militia-and-what.html.
- Indo-Pacific Strategy of the United States, February 2022, https://www.whitehouse.gov/wp-content/uploads/2022/02/U.S.-Indo-Pacific-Strategy.pdf.
- Anatoly Kurmanaev, “How Fake GPS Coordinates Are Leading to Lawlessness on the High Seas,” The New York Times, September 3, 2022, https://www.nytimes.com/2022/09/03/world/americas/ships-gps-international-law.html.
- Providers include but are not limited to FleetMon, Spire, and Orbcomm. All these companies rely upon surface-based and space-based sensors.
- See HawkEye 360 and emerging competitors. In some cases, these services may be available as a regional data subscription. In some other cases, there may be signal analytics available for purchase also.
- In a manner similar to the Department of Defense’s Maven initiative, or what commercial analytics provider Preligens provides, imagery data can be automatically scanned with a classifier that tags objects as ships.
- Key imagery providers include Planet Labs, Airbus, and Maxar, among others. Revisit rates are expected to decrease rapidly as constellation sizes grow.
- Commercial SAR imagery is available from a number of sources including Capella, Umbra, IceEye, and Maxar, several of which are already rolled together into the Ursa SAR marketplace.
- Establishing patterns of life is a subset of tracking and refers to the process of estimating the state of a system or an object over time based on noisy measurements from one or more sensors. Tracking can be performed using different algorithms, such as Kalman filters, particle filters, or multi-object trackers. See, for example, the Mathworks Matlab Sensor Fusion and Tracking Toolbox, online at https://www.mathworks.com/help/fusion/multi-object-trackers.html. The scale of tracking implied by this example is larger than that found in existing academic literature but is not fundamentally different. While there are technical challenges — for example, noisy data creates multiple hypotheses about actual tracks which can blow up in the presence of clutter or false targets — there are also solutions, like using ship object models to reduce error and using multiple sensors to discard spurious hypotheses.
- Anomaly detection is an area of significant interest in machine learning and data analytics, and a variety of techniques can be used depending on the specific nature of the data and patterns. Some techniques include clustering-based anomaly detection, classification-based anomaly detection, Bayesian networks, and hidden Markov models. For some tools, documentation, and examples, see the Mathworks Matlab Statistics and Machine Learning Toolbox at https://www.mathworks.com/help/stats/anomaly-detection.html.
- Previously, Facebook had the capability to directly measure the response to their ads. However, with the introduction of Apple’s App Tracking Transparency initiative, which places more stringent privacy controls on user data, Facebook’s approach has had to change. Now, it must estimate ad response using statistical methods rather than direct measurements, which appears to deliver excellent performance. See Eric Seufert’s analysis at https://mobiledevmemo.com/meta-q1-earnings-did-ai-overcome-att/.
- An estimation of the number of times Facebook ads are viewed (known as ad impressions) can be worked out using this calculation: Total Impressions = (Total Ad Revenue / Cost for each ad click) / The rate at which people click on the ad. In specific terms, Total Impressions = ($86B / $0.38 cost per ad click) / 0.009 rate of clicking the ad. This data comes from financial reports and forms provided by Facebook (https://s21.q4cdn.com/399680738/files/doc_financials/2020/ar/2020-Annual-Report.pdf). The total number of internet users worldwide is approximately 5 billion, as suggested by the Meltwater Global Overview Report (https://www.meltwater.com/). According to Facebook’s 2023 investor resources, there are around 2.93 billion global users every month. Meltwater reports that about 67% of these users are likely to see ads, and these ads aren’t just restricted to Facebook’s apps. Indeed, in 2018, Facebook reported that over one billion users saw ads via their ad network (https://www.facebook.com/business/news/audience-network-update). When it comes to the scale of Facebook’s infrastructure, they have 18 campuses, each containing a total of 85 data center buildings. This suggests that on average, each data center is about 475,000 square feet in size. A data center of 0.5 million square feet, if 65% of that space is used for servers organized in 52U racks, can accommodate approximately 650,000 2U servers per building.
- Frank Wolfe, “NDAA Conference Bill Authorizes $250 Million for Project Maven,” Defense Daily, December 11, 2020, https://www.defensedaily.com/ndaa-conference-bill-authorizes-250-million-project-maven/advanced-transformational-technology/.
The Brookings Institution is committed to quality, independence, and impact.
We are supported by a diverse array of funders. In line with our values and policies, each Brookings publication represents the sole views of its author(s).


