Home | About TRACE-OMICRON | TRACE 1.0 | TRACE-STL
TRACE (Testing Responses through Agent-based Computational Epidemiology) is an agent-based computational model developed by a team from Brookings, Washington University in St. Louis, and the University of Vermont with the specific goal of providing timely policy guidance during the COVID-19 pandemic. The model draws on an extensive body of epidemiological evidence and it was also designed to manage a high degree of uncertainty about some aspects of the pandemic and the underlying SARS-CoV-2 virus. The version of TRACE described here builds upon previous national-level and local-level work that informed response strategies earlier in the pandemic. The extended version of the model detailed below accounts for recently updated science on SARS-CoV-2, includes features specific to the Omicron wave in the United States, and is intended to generate policy-relevant lessons from the recent Omicron wave of the COVID-19 pandemic and for future preparedness.
SETTING AND POPULATION
TRACE-Omicron utilizes United States census data and empirical data on contact in social settings which determine the transmission pathways for the virus. Simulated individuals (“agents”) in our model have social settings (e.g., where they live and work), demographic attributes, vaccination history, and infection states. Together, these features of population and social setting shape the set of other individuals with whom each person has social contact in ways that might transmit the virus. Our approach allows us to compare cumulative levels and timing of infections in the population across a number of different combinations of active policies and practices in a simulated but highly realistic setting. We summarize our model here, and describe it in complete detail (including mathematical equations, data sources, and computational implementation) in a forthcoming manuscript.
COVID-19 INFECTION
TRACE simulates transmission of the COVID-19 virus between individuals and the progression of the infection within individuals. Infection progression in our simulations uses a variant of the classic “Susceptible-Exposed-Infectious-Recovered” epidemiological model that is intended to specifically represent COVID-19 (Figure 1).
Fig. 1 Flow chart of Covid-19 “states” and possible “state transitions” represented in the model.
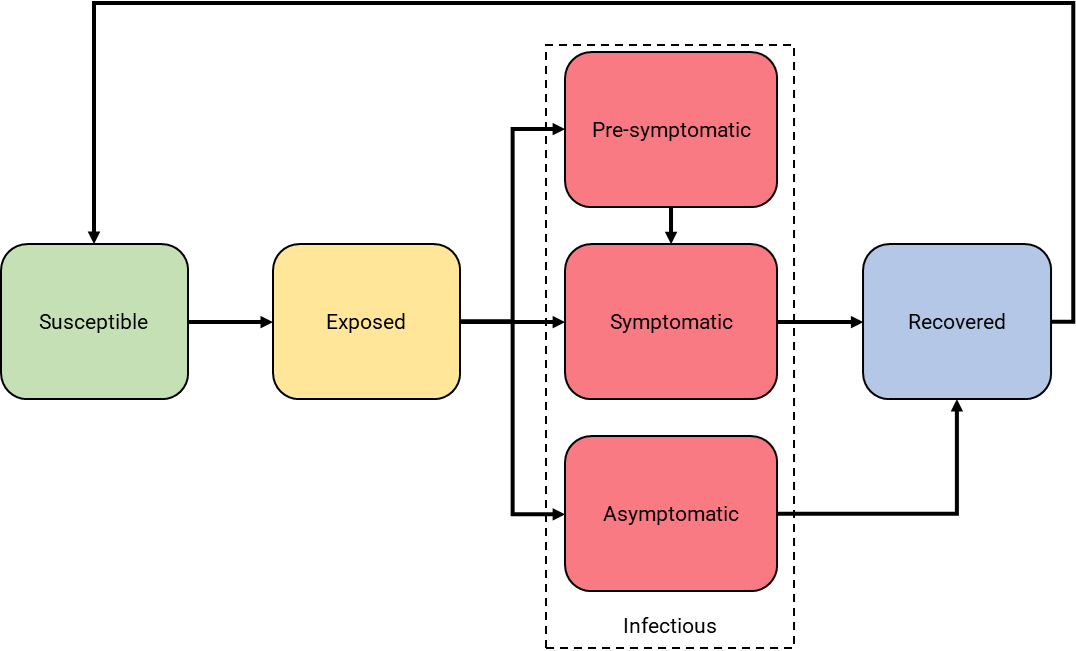
Simulated individuals who have never experienced a COVID-19 infection or no longer have substantial antibody protection from a prior infection start as “susceptible.” If contact with an infectious individual transmits the virus, then they become “exposed.” After a set incubation period, they become “infectious.” Some individuals have shorter incubation periods and are infectious before they display symptoms (i.e., are “pre-symptomatic”), while others never display symptoms (i.e., are asymptomatic). We allow infectivity—that is, one’s ability to transmit the virus to others with whom they interact—to differ across both individuals and infection type. This allows us to represent the presence of “super-spreaders” who are highly contagious as well as a lower likelihood of non-symptomatic individuals transmitting the disease. Finally, when the infection has run its course, an individual is “recovered.” Unlike previous versions of the TRACE model, which focused on earlier variants of SARS-CoV-2, we now allow for some recovered individuals to re-enter the “susceptible” state and thus potentially become infected a second time. This represents two features that have proven important during the Omicron wave: (1) waning of antibody presence over time and (2) imperfect protection conferred by prior infection against reinfection by Omicron.
Vaccination and Boosting
Because of our interest in initial vaccination and booster delivery as potential policy levers (see below), we incorporate a highly nuanced and dynamic representation of how vaccination affects risk for infection or transmission for individual recipients. We not only capture whether agents are vaccinated but also when they were vaccinated and with which product (Pfizer, Moderna, or Johnson & Johnson). Vaccinated individuals are protected—although imperfectly—from infection and are also less infectious if they contract COVID-19 despite vaccination. The extent of this protection and reduction in infectivity are dependent on vaccine type, booster status, and time since vaccination. That is, we model product-specific curves depicting how vaccine effectiveness changes daily from the date of vaccination. These are based on epidemiological evidence from both the Delta and Omicron-wave eras. Individuals are eligible for booster shots 180 days after initial vaccination; recipients are then treated as if they had just completed their initial vaccination.
CONTACT BETWEEN AGENTS
On any given day, individuals interact with others in ways that might transmit the COVID-19 virus. We simulate multiple settings in which such interactions can occur: in the home, workplace, or school with which each individual is associated as well as contact that might take place outside such settings (e.g., socializing). Contact is based on both a realistic depiction of settings in which each individual spends time as well as an empirically-driven assignment of whom they interact with in those settings. For example, a school-age child will have a much larger proportion of their daily interactions outside of home and school with other school-age children than with senior citizens, and these interactions are most likely to occur between children who live nearby. Policy interventions (described below), can alter the contact structure of the population and thus the transmission dynamics.
Figure 2
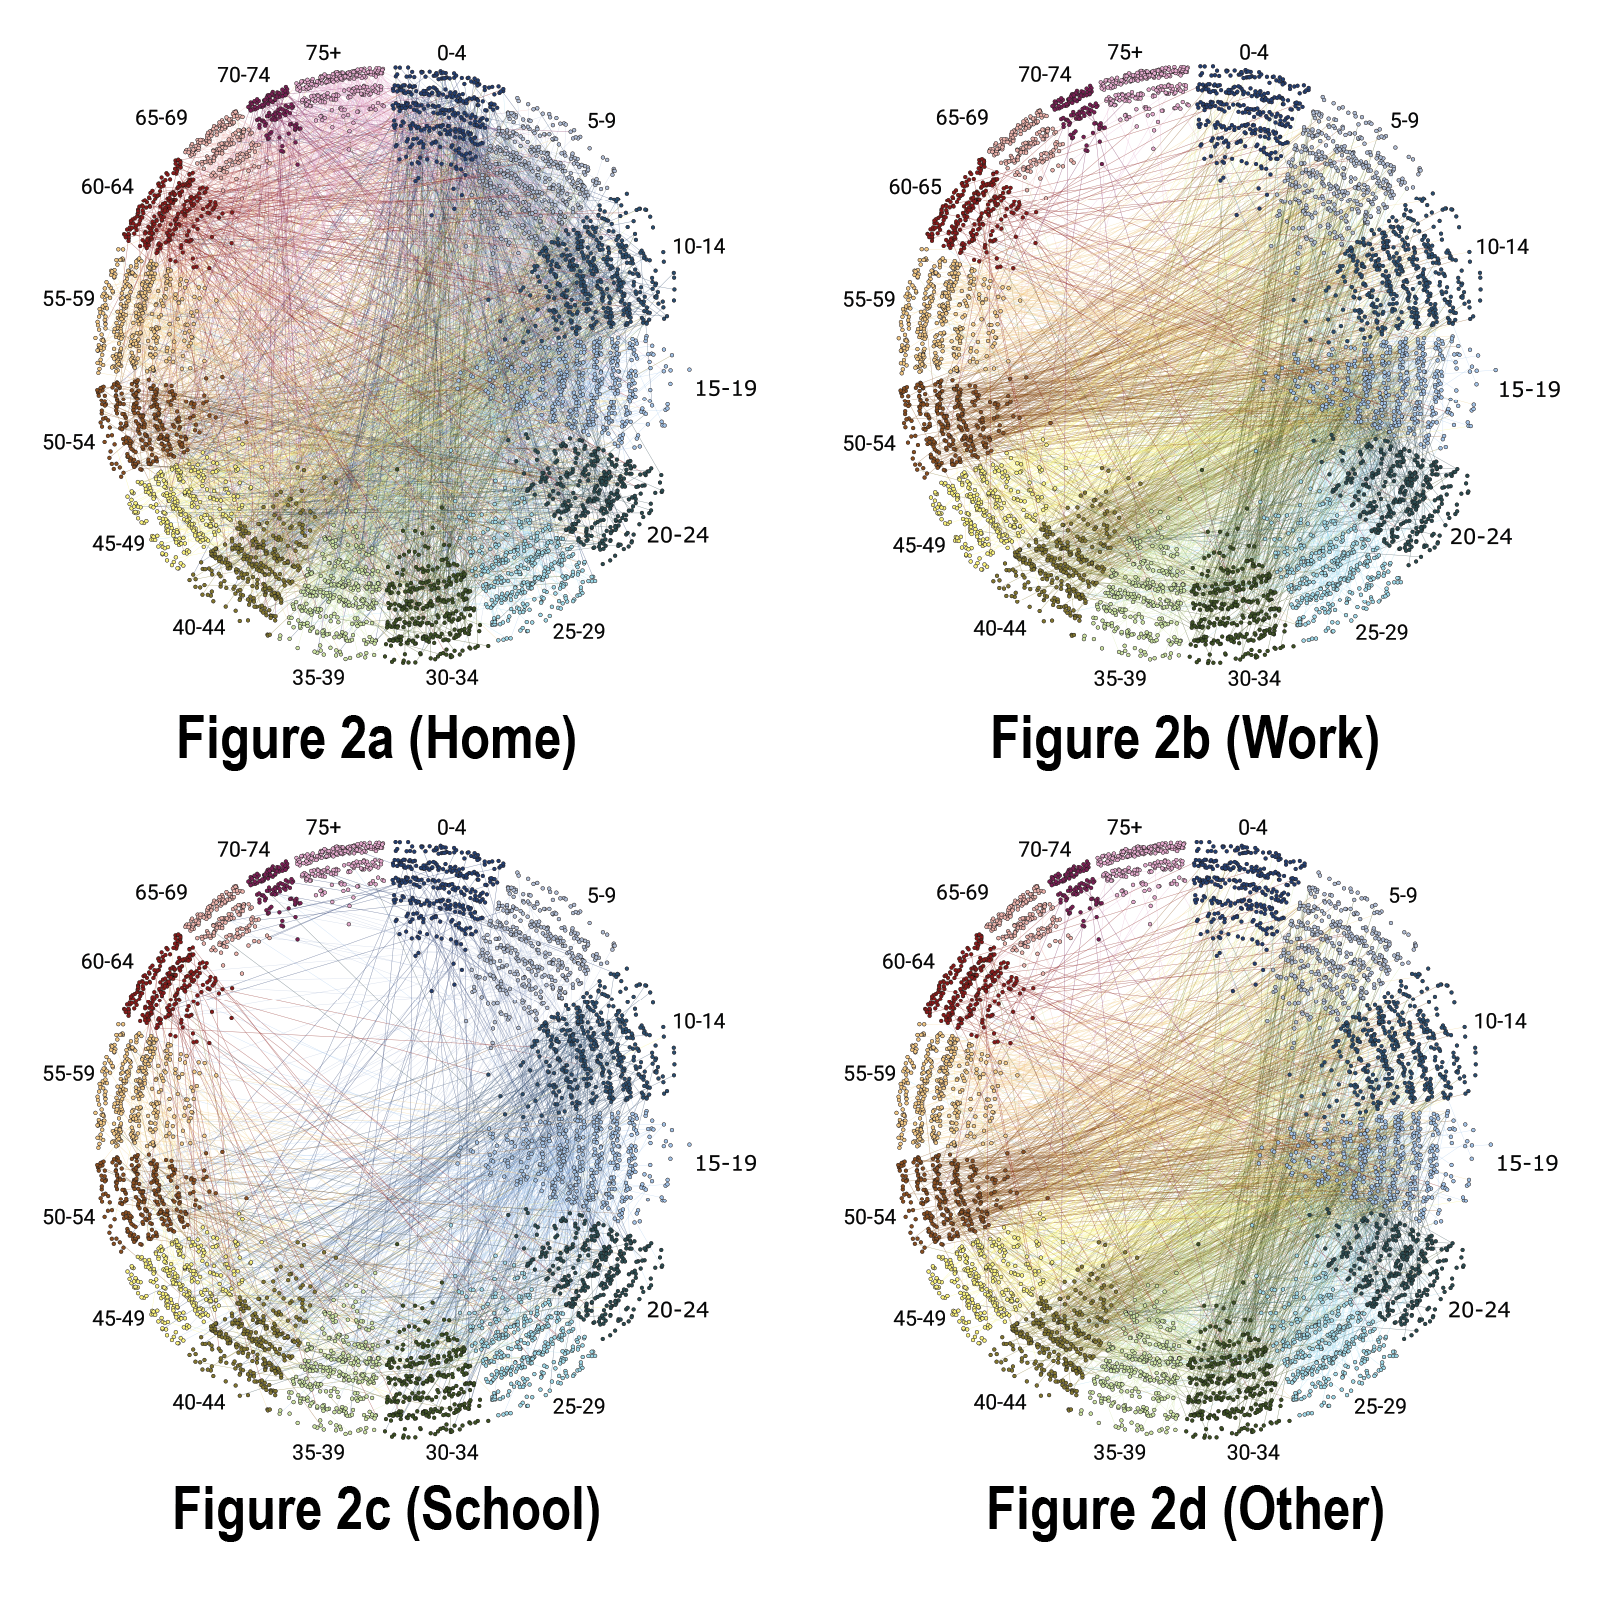
FIGURE 2. Contacts for a sample population. Each subfigure shows the contacts in a given setting: (2a)-Home, (2b)-Work, (2c)-School, (2d)-Other. Individuals show by nodes (dots) positioned and color-coded by age bracket, with distance from center inversely proportional to total degree (number of contacts) across all settings. Social ties (edges) depicted by lines in colors that match source node color. During a simulation, agents interact with their contacts and can potentially transmit the COVID-19 virus to one another. Certain policies, such as business closure, school closure, or shelter-in-place orders, can remove some of these contacts, altering the transmission dynamics.
Figure 3
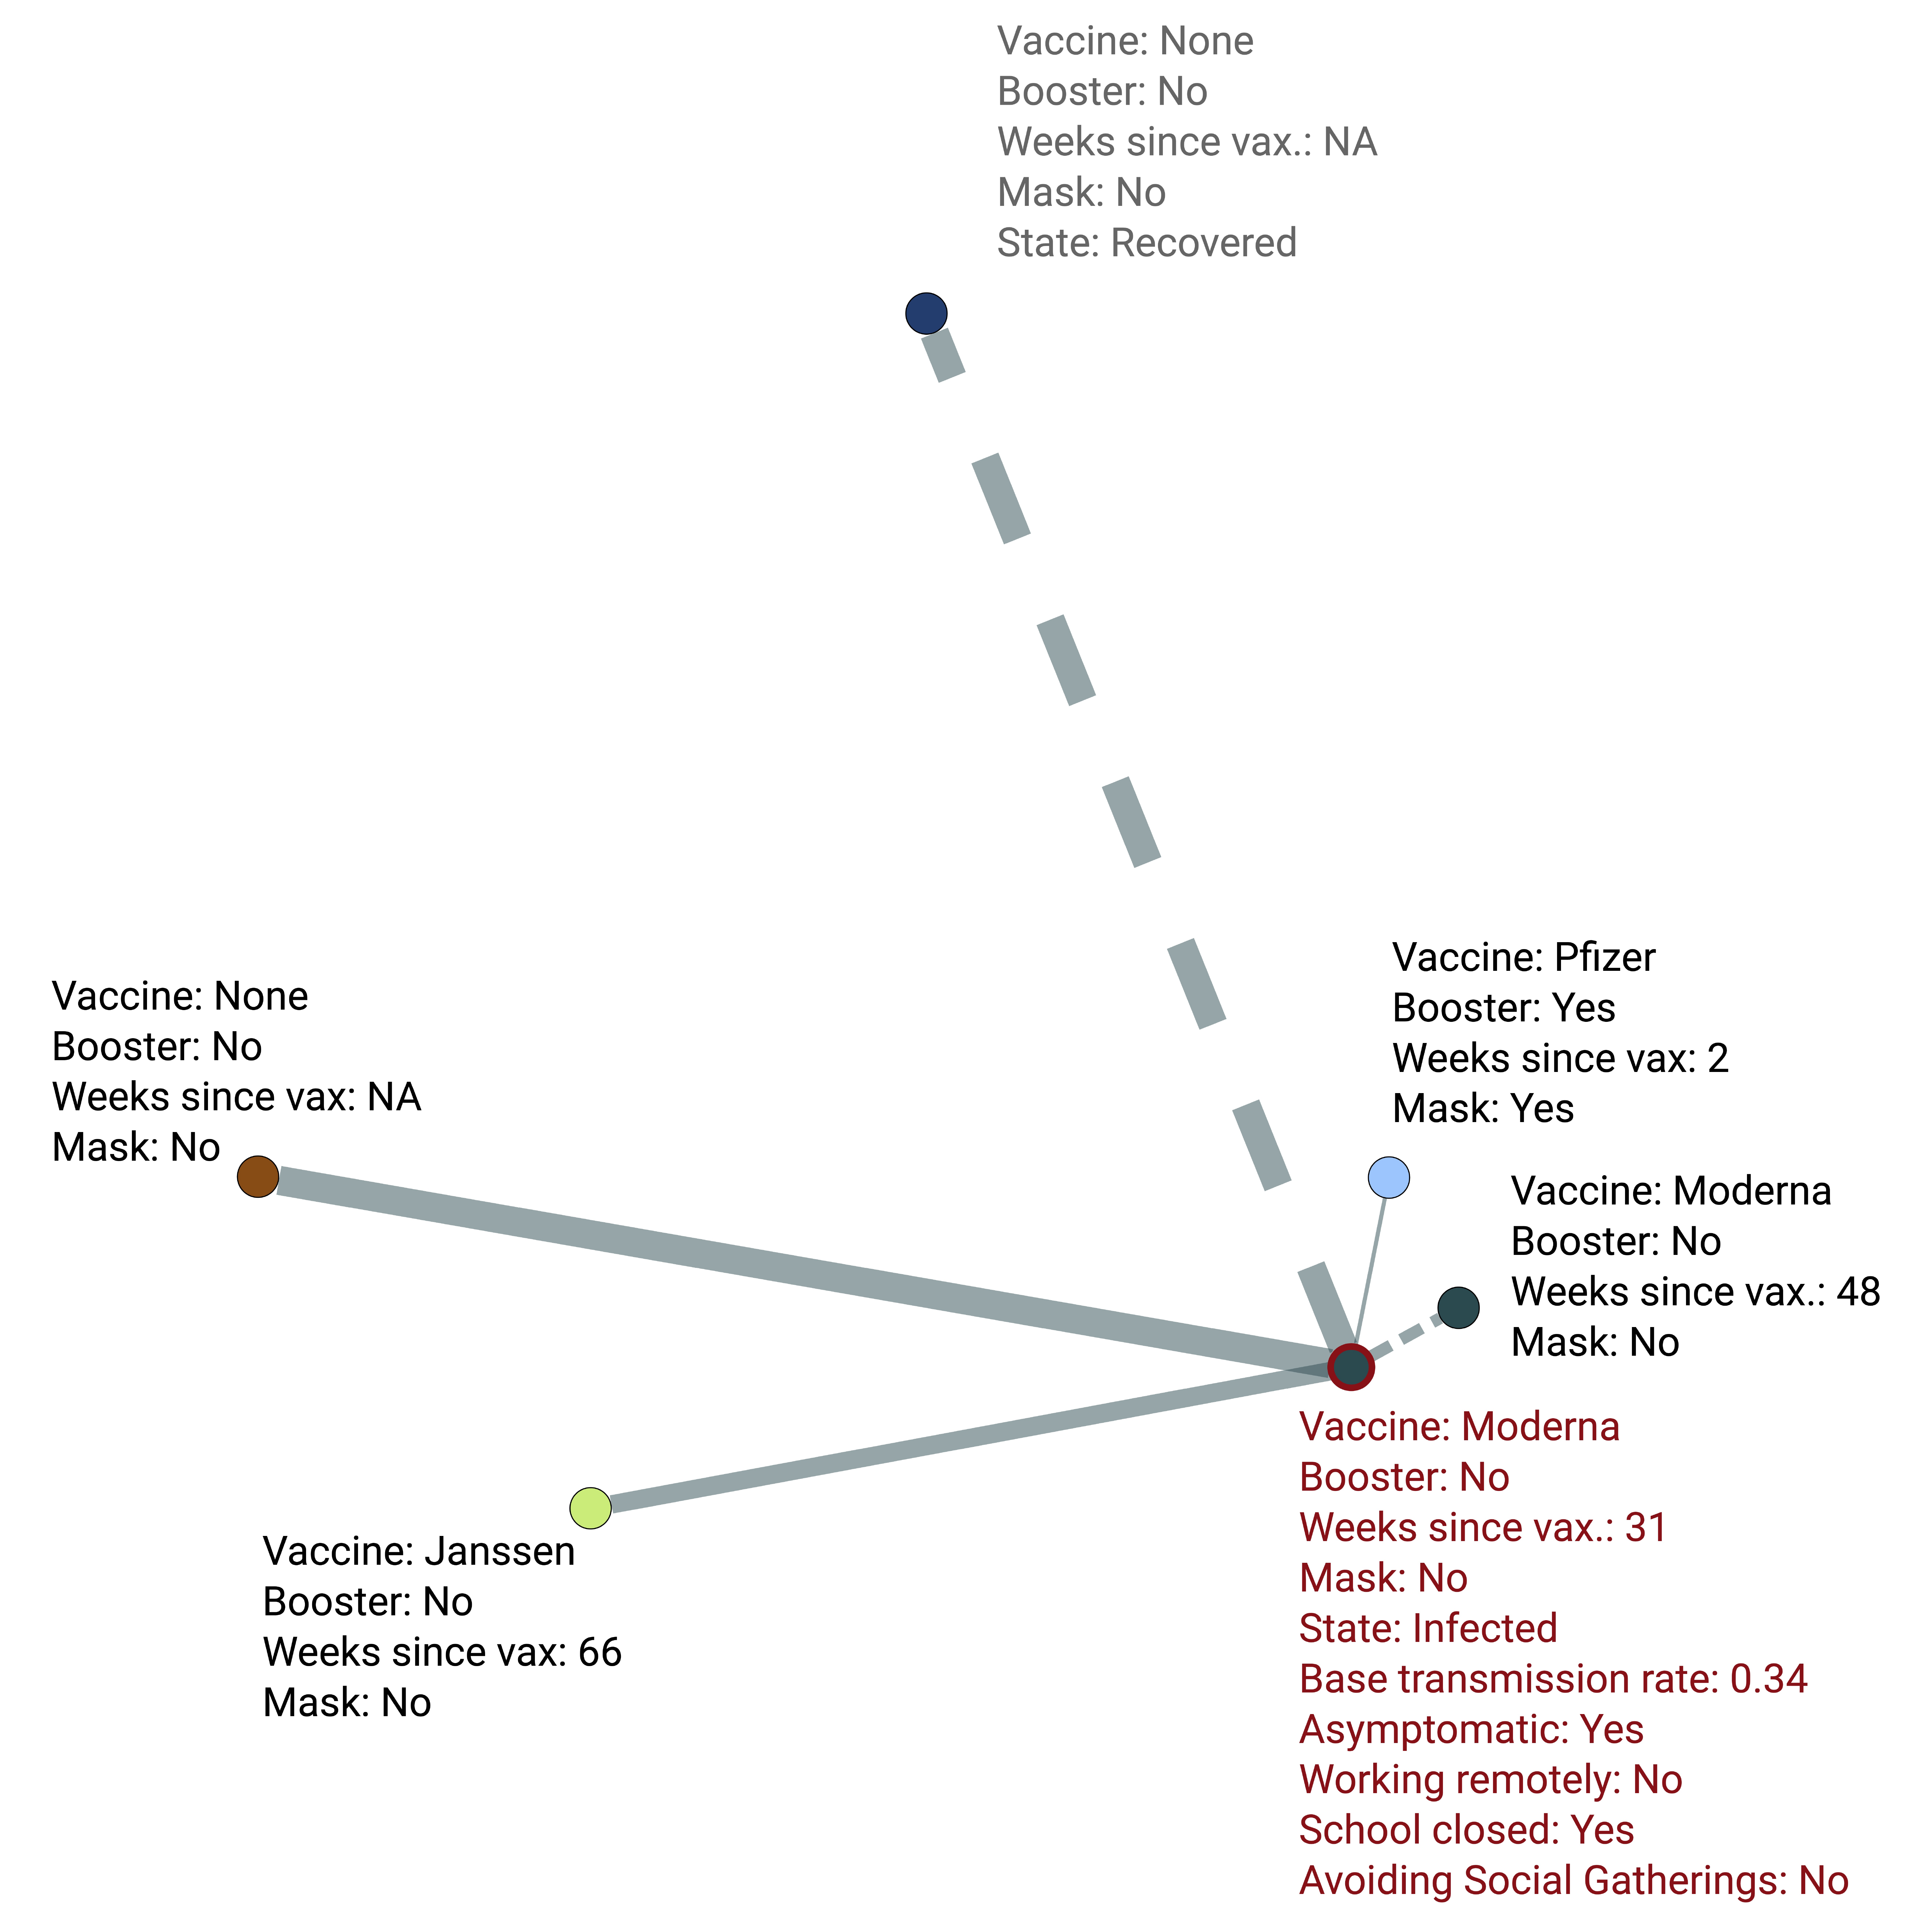
FIGURE 3. Connections of an example infected individual. Each line indicates a contact; line widths indicate the probability of transmission across that particular connection which is scaled according to various protective measures (vaccination, masks, distancing, etc.) utilized by either or both individuals. Dashed lines indicate connections that are not currently viable transmission pathways due to individuals who are recovered recently or a connection currently suspended from active contact (e.g., quarantined, working/schooling remotely, not socializing).
CALIBRATION OF BASELINE SCENARIO
The initial configuration of the TRACE-Omicron model is set based on CDC data. This includes, for each individual:
- The individual’s infection status (susceptible, exposed, infected, recovered)
- How long (in days) the individual has been in that infection state
- Whether the individual is currently in quarantine or not
- How long ago any prior infection of this individual occurred
- Whether the individual has been vaccinated and if so with which product (Pfizer, Moderna, Johnson&Johnson)
- If the individual is vaccinated, how long ago they received their final shot
- If the individual has received a booster dose or not
- How long ago any booster was administered
The model also accounts for under-reporting of cases during the Omicron wave according to the best available evidence on undercounts.
We conducted a calibration exercise to compare our simulated projections of the Omicron wave during the period December 2021 to February 2022, under realistic population and policy conditions, against observed cases.
Figure 4
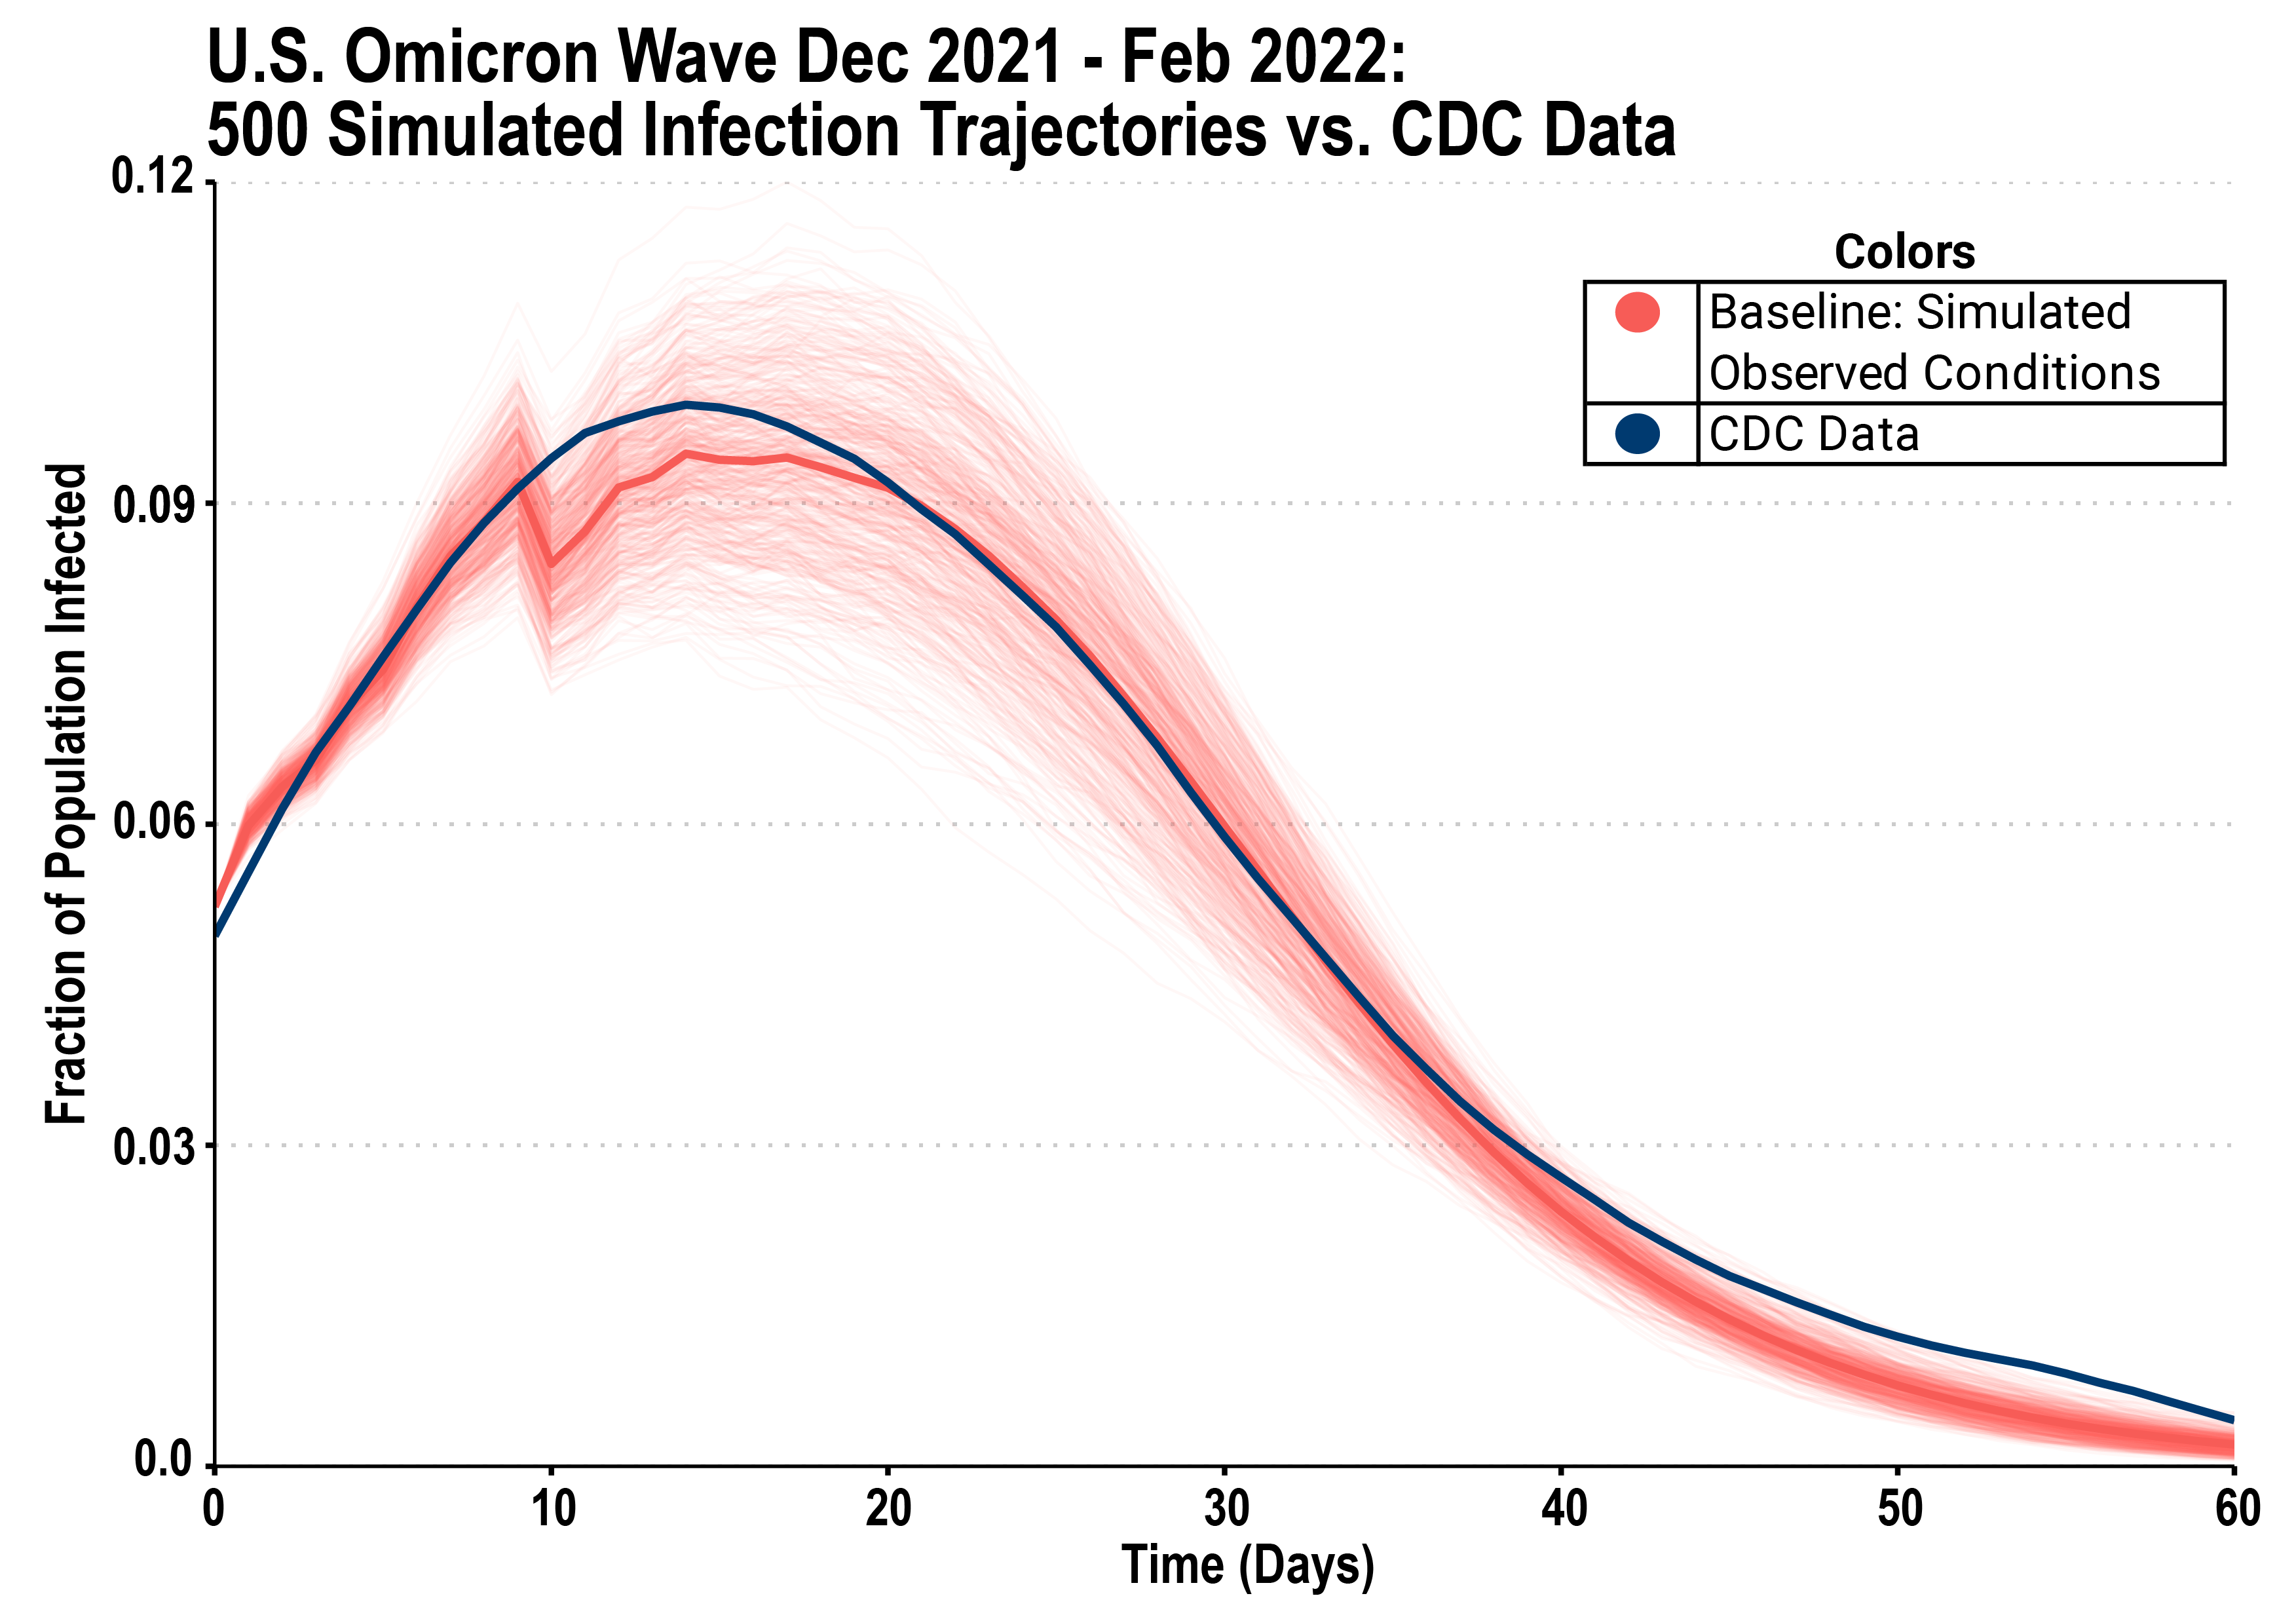
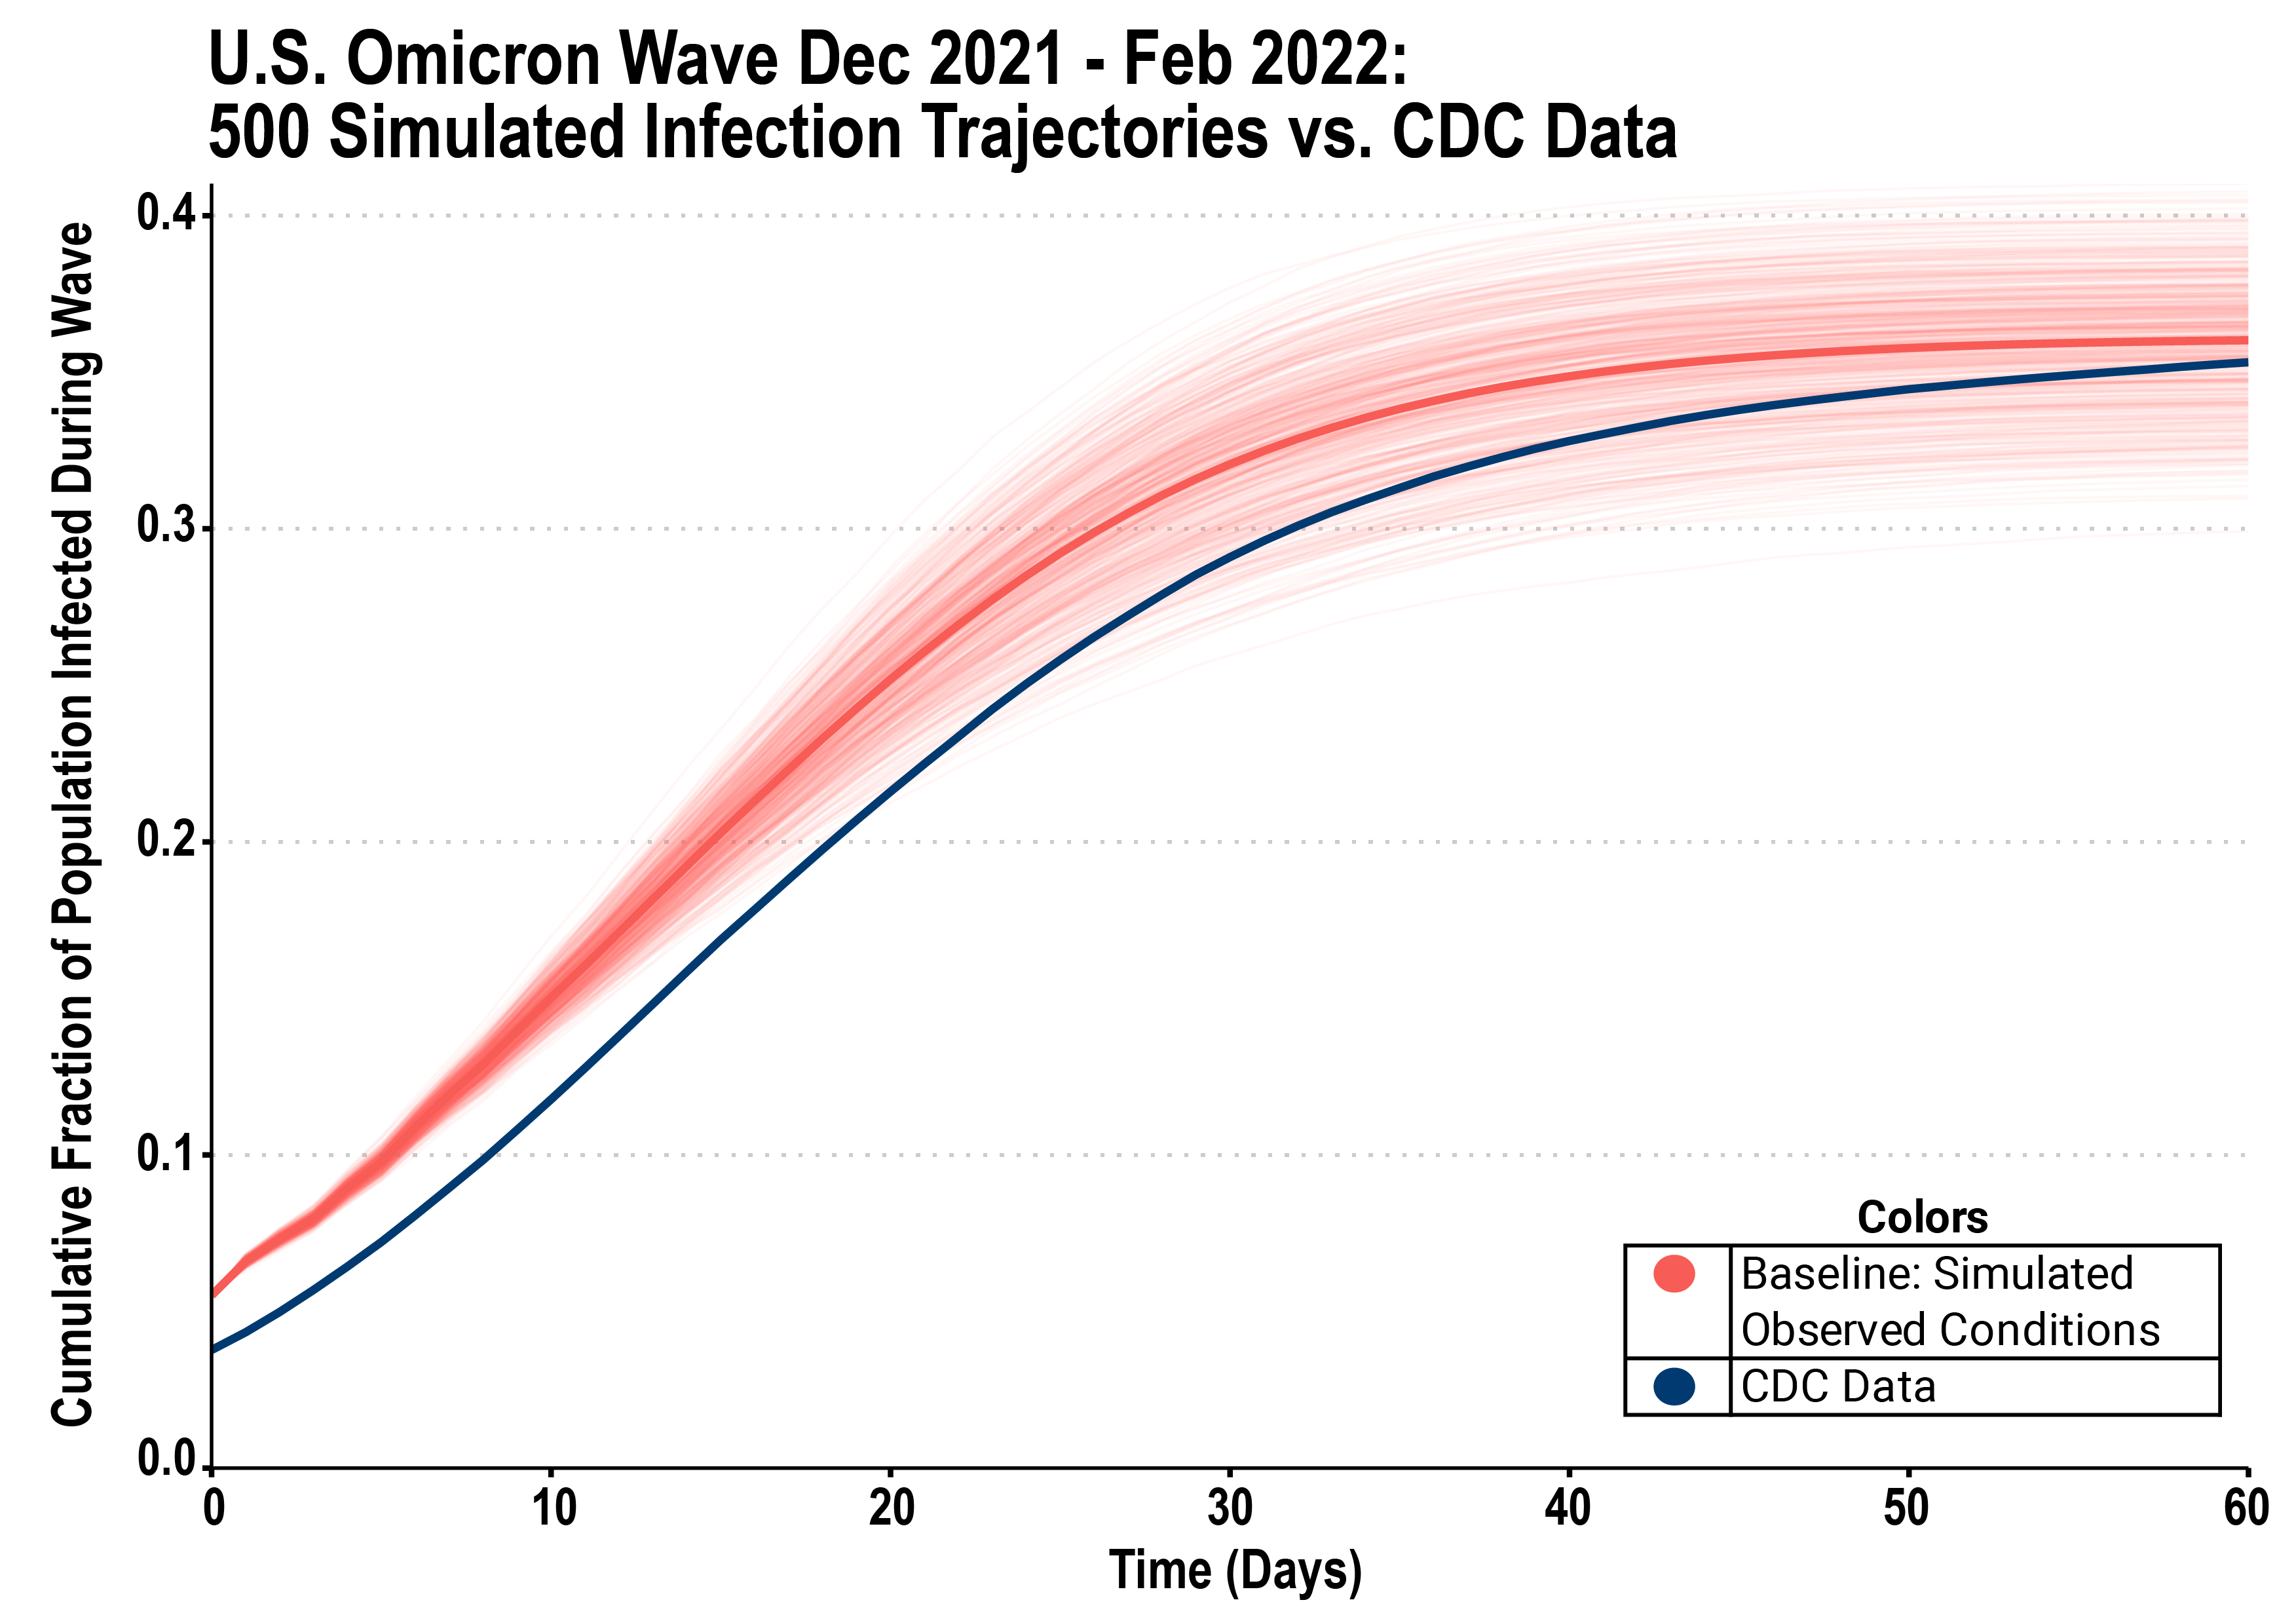
Figure 4 shows best fit simulation the baseline model, showing a trajectory that closely follows the observed CDC data from the Omicron wave in both infections per day (top panel) and cumulative total infections (lower panel).
SIMULATED POLICY INTERVENTIONS: BASELINE AND COUNTERFACTUALs
Across model runs, we systematically explore variation in policy and practice to represent different combinations of pandemic containment options. Specifically, we explore different settings for:
Vaccination and boosting. How many people are vaccinated and boosted at any point in time, and whether and to what extent vaccines are available for and delivered to different age groups (e.g., children under 5).
- In baseline simulations, initial vaccinations, booster vaccines, and time since vaccination/booster are distributed proportionally by age group based on CDC data. New vaccines and booster shots are distributed during the model based on a linear regression estimate of vaccination rate in the 30 days before the model starts.
- In our exploration of counterfactuals, we simulate hypothetical scenarios in which the fraction of the population vaccinated at the start of the Omicron wave was higher than reality (representing what might have happened if a stronger vaccination rollout had occurred before December 2021). In these scenarios, vaccine elements are still initialized proportional to reality but with constant multiplication factors.
Testing. How many daily PCR or antigen tests are available, who is given priority for testing, and the accuracy of the test technologies used.
- In baseline simulations, available daily quantities of both antigen and PCR tests are based on real-world estimates from the period of the Omicron wave. To reflect changing practice in the use of testing during this time period in the US, antigen tests are preferentially allocated to contacts of agents who have tested positive, while PCR tests are distributed to a random sample of symptomatic agents first, and then any remaining tests are allocated randomly.
- In our exploration of counterfactuals, we simulate hypothetical scenarios in which testing capacity (for both antigen and PCR tests) is much higher. This represents what might have happened if a more substantial investment in testing capacity had been made prior to December 2021 or testing ramped up rapidly in late 2021.
Contact tracing. How many contacts of symptomatic or COVID-positive individuals can be traced (and themselves tested and requested to quarantine) each day.
- In baseline scenarios, contact tracing capacity was simulated using realistic estimates from the late 2021 period. Reflecting CDC recommendations from that time period, the model assumes that when symptomatic agents go into quarantine, they do so for 10 days, while asymptomatic agents quarantine for five days.
- In our exploration of counterfactuals, we simulate hypothetical scenarios in which contact tracing capacity is much higher than at baseline (representing what might have happened if substantial investments in contact tracing workforce and infrastructure had been made in late 2021).
Social distancing policies. Restrictions on in-person business activity and in-person school attendance.
- In baseline scenarios, reflecting common policy practice during the relevant period, a low level of social distancing in the form of closures of workplaces and school was simulated.
- In our exploration of counterfactuals, we simulate hypothetical scenarios in which such closures occurred at much higher levels, beginning at the start of the wave in December 2021 and continuing through the 2-month simulated period. A detailed analysis of potential early lifting of social distancing controls is presented in our forthcoming manuscript.
Mask usage. How many people wear masks and the effectiveness of mask use (e.g., use of high-quality N95 masks).
- In our baseline scenarios, we simulate relatively low levels of consistent wearing of high-quality masks among the American population, drawing on the best available evidence of the prevalence of this behavior during the relevant time period.
- In our exploration of counterfactuals, we simulate hypothetical scenarios in which wearing of high-quality masks was much higher (reflecting what might have happened if there had been more investment in public health messaging around masking, broader mandates, or broad distribution of free or low-cost high-quality respirators)
SIMULATED EPIDEMIOLOGICAL SCENARIOS: BASELINE AND COUNTERFACTUALS
Our baseline scenario is intended to closely reflect the best available data about the epidemiology of the Omicron variant of SARS-CoV-2 and to produce simulated disease curves that match what actually occurred during the late 2021-early 2022 time-period (see Calibration of Baseline Scenario above).
We also used TRACE to explore what might have occurred if, instead of Omicron, a variant had become dominant in late 2021 in the US which was either more contagious or had much stronger ability to evade immunity from vaccinations and prior infection—or both (high infectivity and high immune scape). This allows us to look at “epidemiological counterfactuals” which yield important insights for preparedness, as new variants of the virus continue to emerge both in the U.S. and globally. These results are presented in detail in our forthcoming manuscript. A key result from these simulations is that, although all containment policies work less well in absolute terms in the face of a more contagious or immune-escape variant, the relative effectiveness of the policies simulated is mostly unchanged from the results presented on our main Results page. Thus, the implications of lessons learned from the Omicron wave and our policy counterfactuals above hold for preparedness for a potential next variant.
The Trace Team
The TRACE-Omicron team includes:
Ross Hammond, Brookings Institution and Washington University in St Louis
Sam Rosenblatt, University of Vermont
David O’Gara, Washington University in St Louis
Matt Kasman, Brookings Institution
Rob Purcell, Brookings Institution