This post updates with year-end 2020 data the External Wealth of Nations database [Excel download], which assembles data on external claims and liabilities of economies around the world. The database is described in more detail in a series of papers (Lane and Milesi-Ferretti 2001, 2007, 2018) and in a companion post. The data are annual for the period 1970-2020 and cover 212 countries and territories, plus the euro area and the Eastern Caribbean Currency Union (ECCU). The data update to 2020 is currently available for 153 economies (plus the euro area and the ECCU), including the 60 largest economies and 92 of the largest 100.[1] The data will be updated at regular intervals. The 2020 update will be completed for the entire sample at the end of 2021.
During the year 2020, characterized by the deepest—albeit brief—peacetime recession on record, most creditor countries continued to run current account surpluses and most debtor countries current account deficits. Beyond the depth of the recession, two important shocks affected current account balances: the plummeting price of oil and the collapse in international travel. As a consequence, exporters of oil and tourism services generally experienced deteriorations in their current account balances, with importers of those services on the other side of the ledger.
Holding everything else constant, a decline in GDP tends to boost the size of creditor and debtor positions as a share of GDP. Creditor and debtor positions also change for two additional reasons: (1) new net lending or borrowing that economies undertake during the year (for which the current account balance is generally a good proxy, and (2) fluctuations in asset prices (such as exchange rates, stock prices, and interest rates) which change the value of outstanding claims and liabilities.
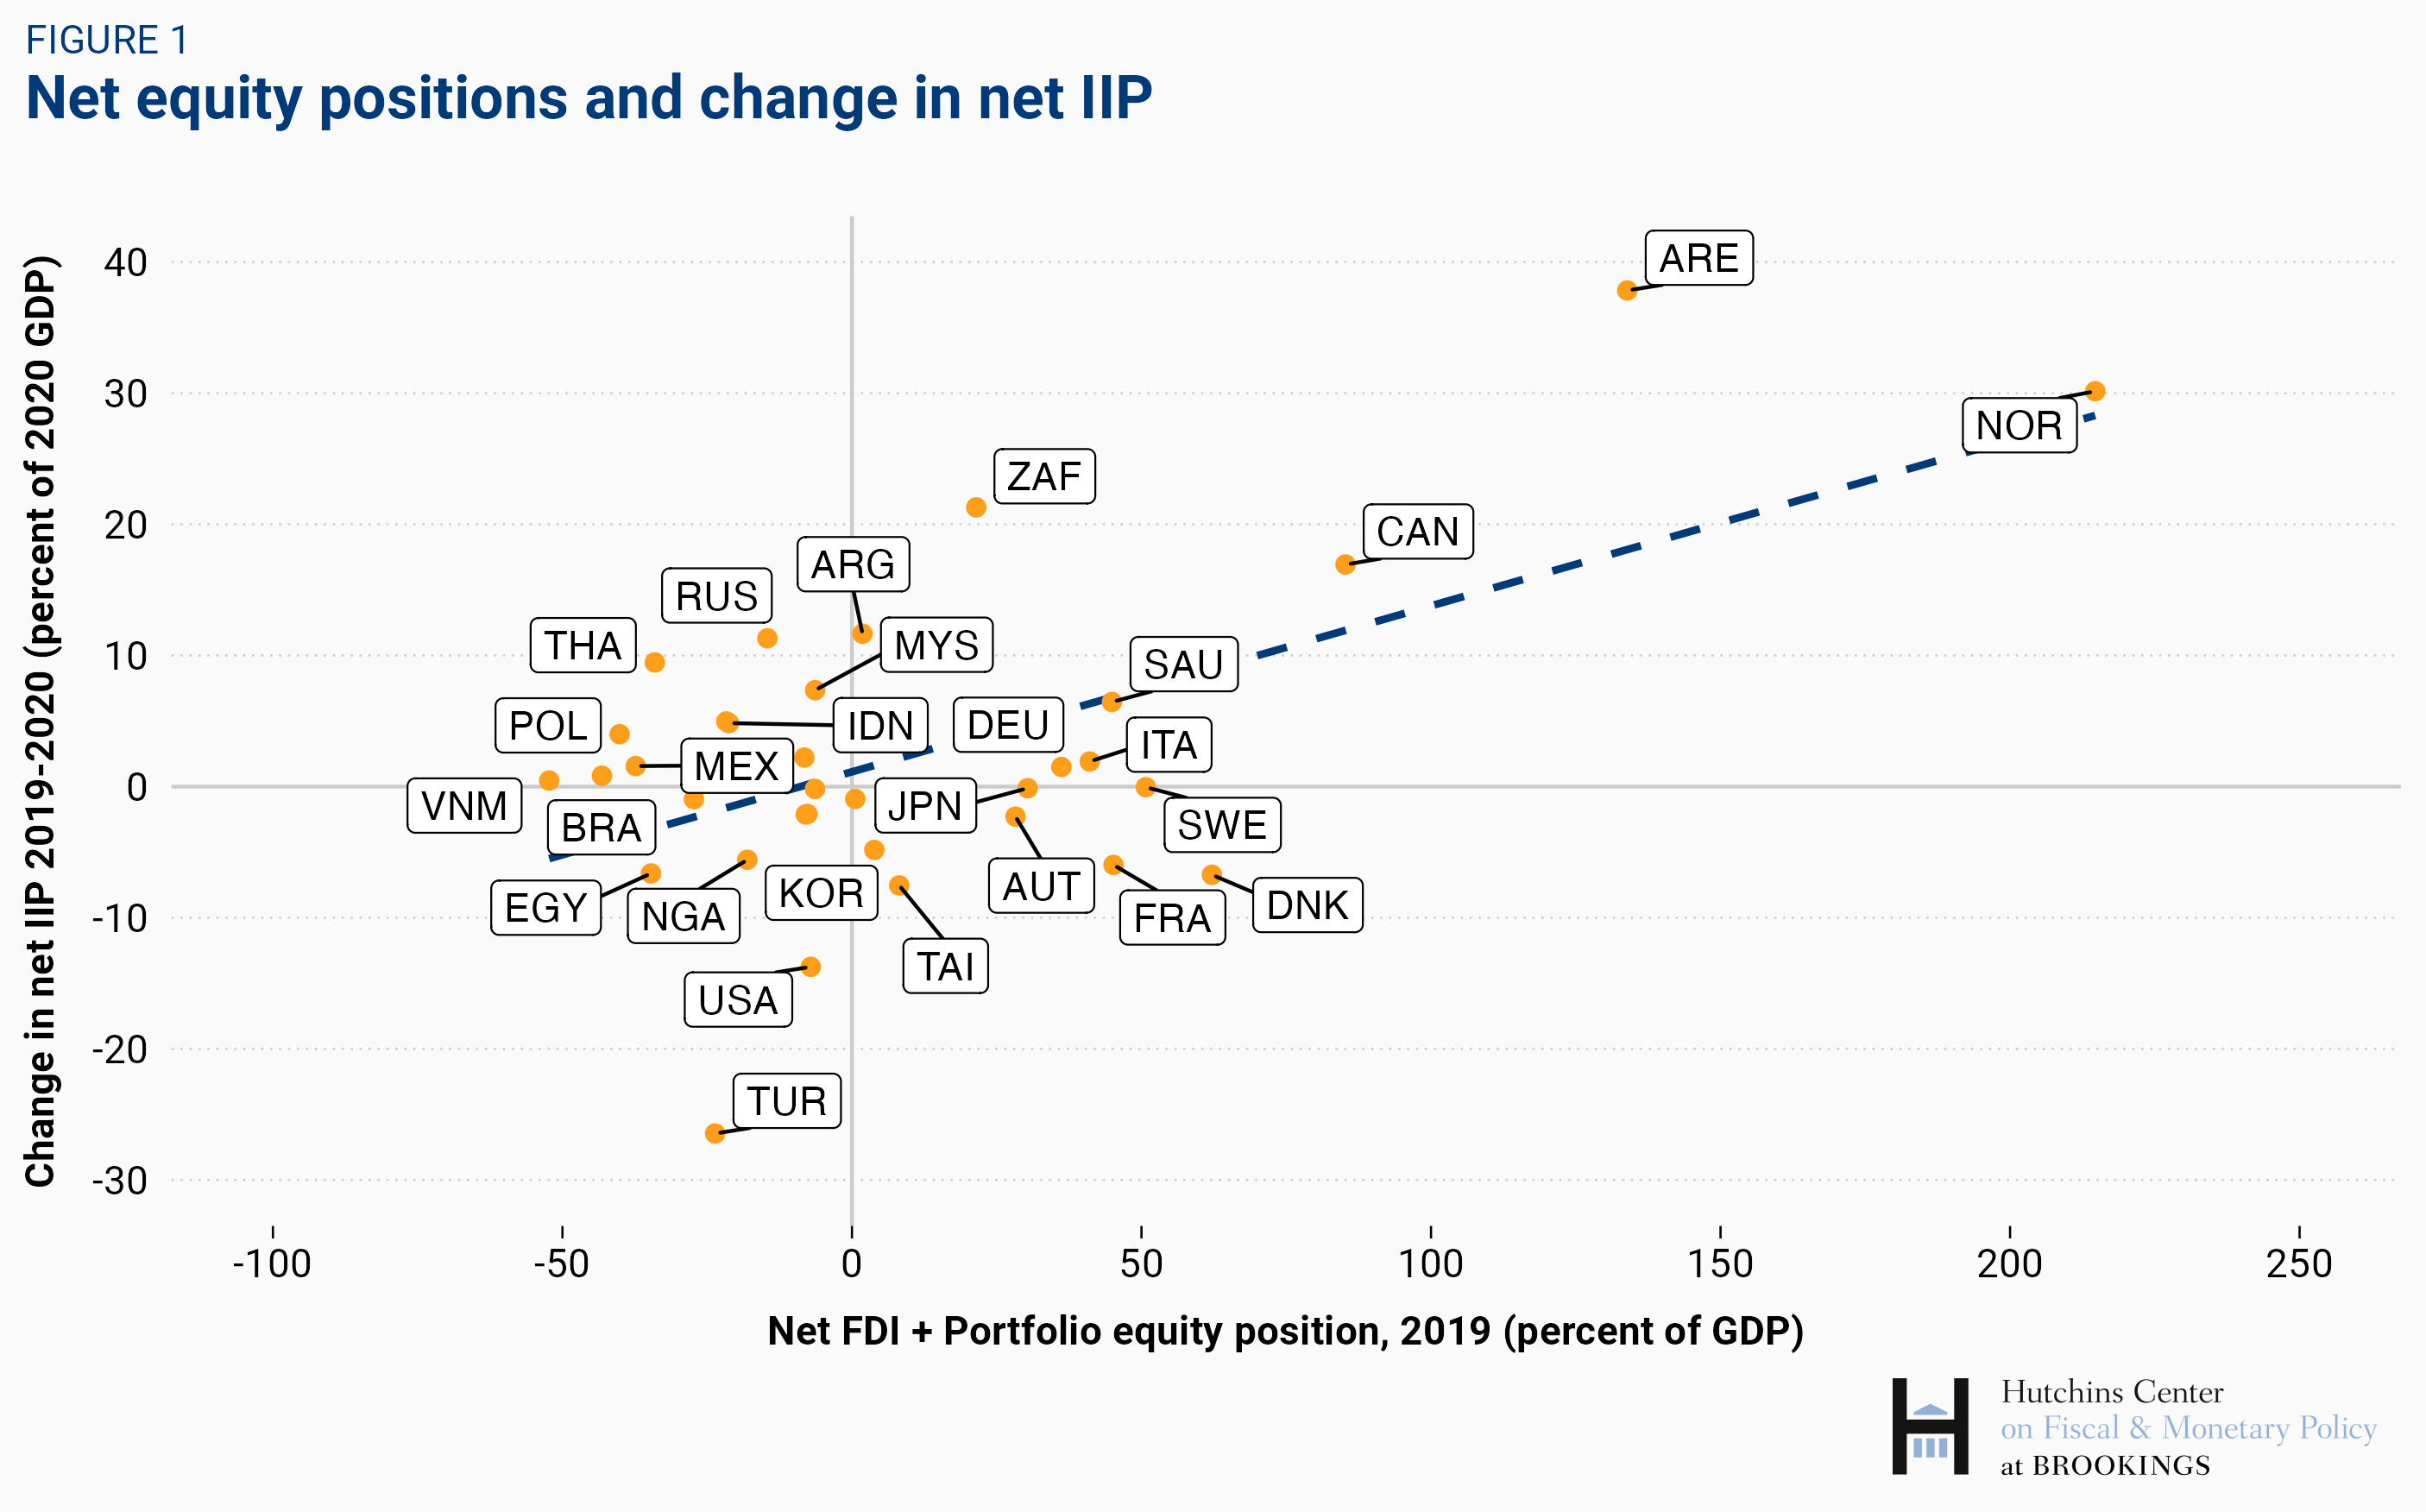
The most salient feature of asset price developments in 2020 was the run-up in global stock prices (14 percent between end-2019 and end-2020, according to the global Morgan Stanley Capital International stock market index) and especially prices of U.S. stocks (19 percent for the MSCI middle and large cap index).[2] Rising global stock prices improve the net external positions of countries that are “long” in equity instruments (portfolio equity investment as well as FDI, if the latter is measured at market prices). Good examples are countries with very large sovereign wealth funds: for instance, Norway, whose net holdings of equity instruments overseas exceeded $800 billion in 2019 (over 200 percent of GDP) saw those net holdings rise by a further $140 billion in 2020, providing a further substantial boost to its net IIP. The same goes for the Gulf states such as Kuwait and the United Arab Emirates. Correspondingly, the net position of countries that are “short” equity instruments would worsen.[3] This point is clearly illustrated by Figure 1, which shows for countries with GDP above $300 billion how changes in creditor and debtor positions in 2020 relate to the previous year’s net equity position.[4]
While current account imbalances have declined during the past decade, creditor and debtor positions globally have continued to expand, reflecting the fact that large creditor countries (such as Germany and Japan) continued to run sizable current account surpluses while large debtor countries (like the United States) have continued to run current account deficits.[5] Figure 2 provides a visual summary of the evolution of creditor and debtor positions for the main countries and regions over the past decade. The U.S. is by far the largest net debtor in absolute terms—it accounts for well over half of global net debtor positions as of end-2020. Other debtor regions include some European advanced economies (a group including France, Greece, Italy, Portugal, and Spain) as well as emerging market regions, such as emerging Asia (excluding China), Latin America, and emerging Europe (excluding Russia).
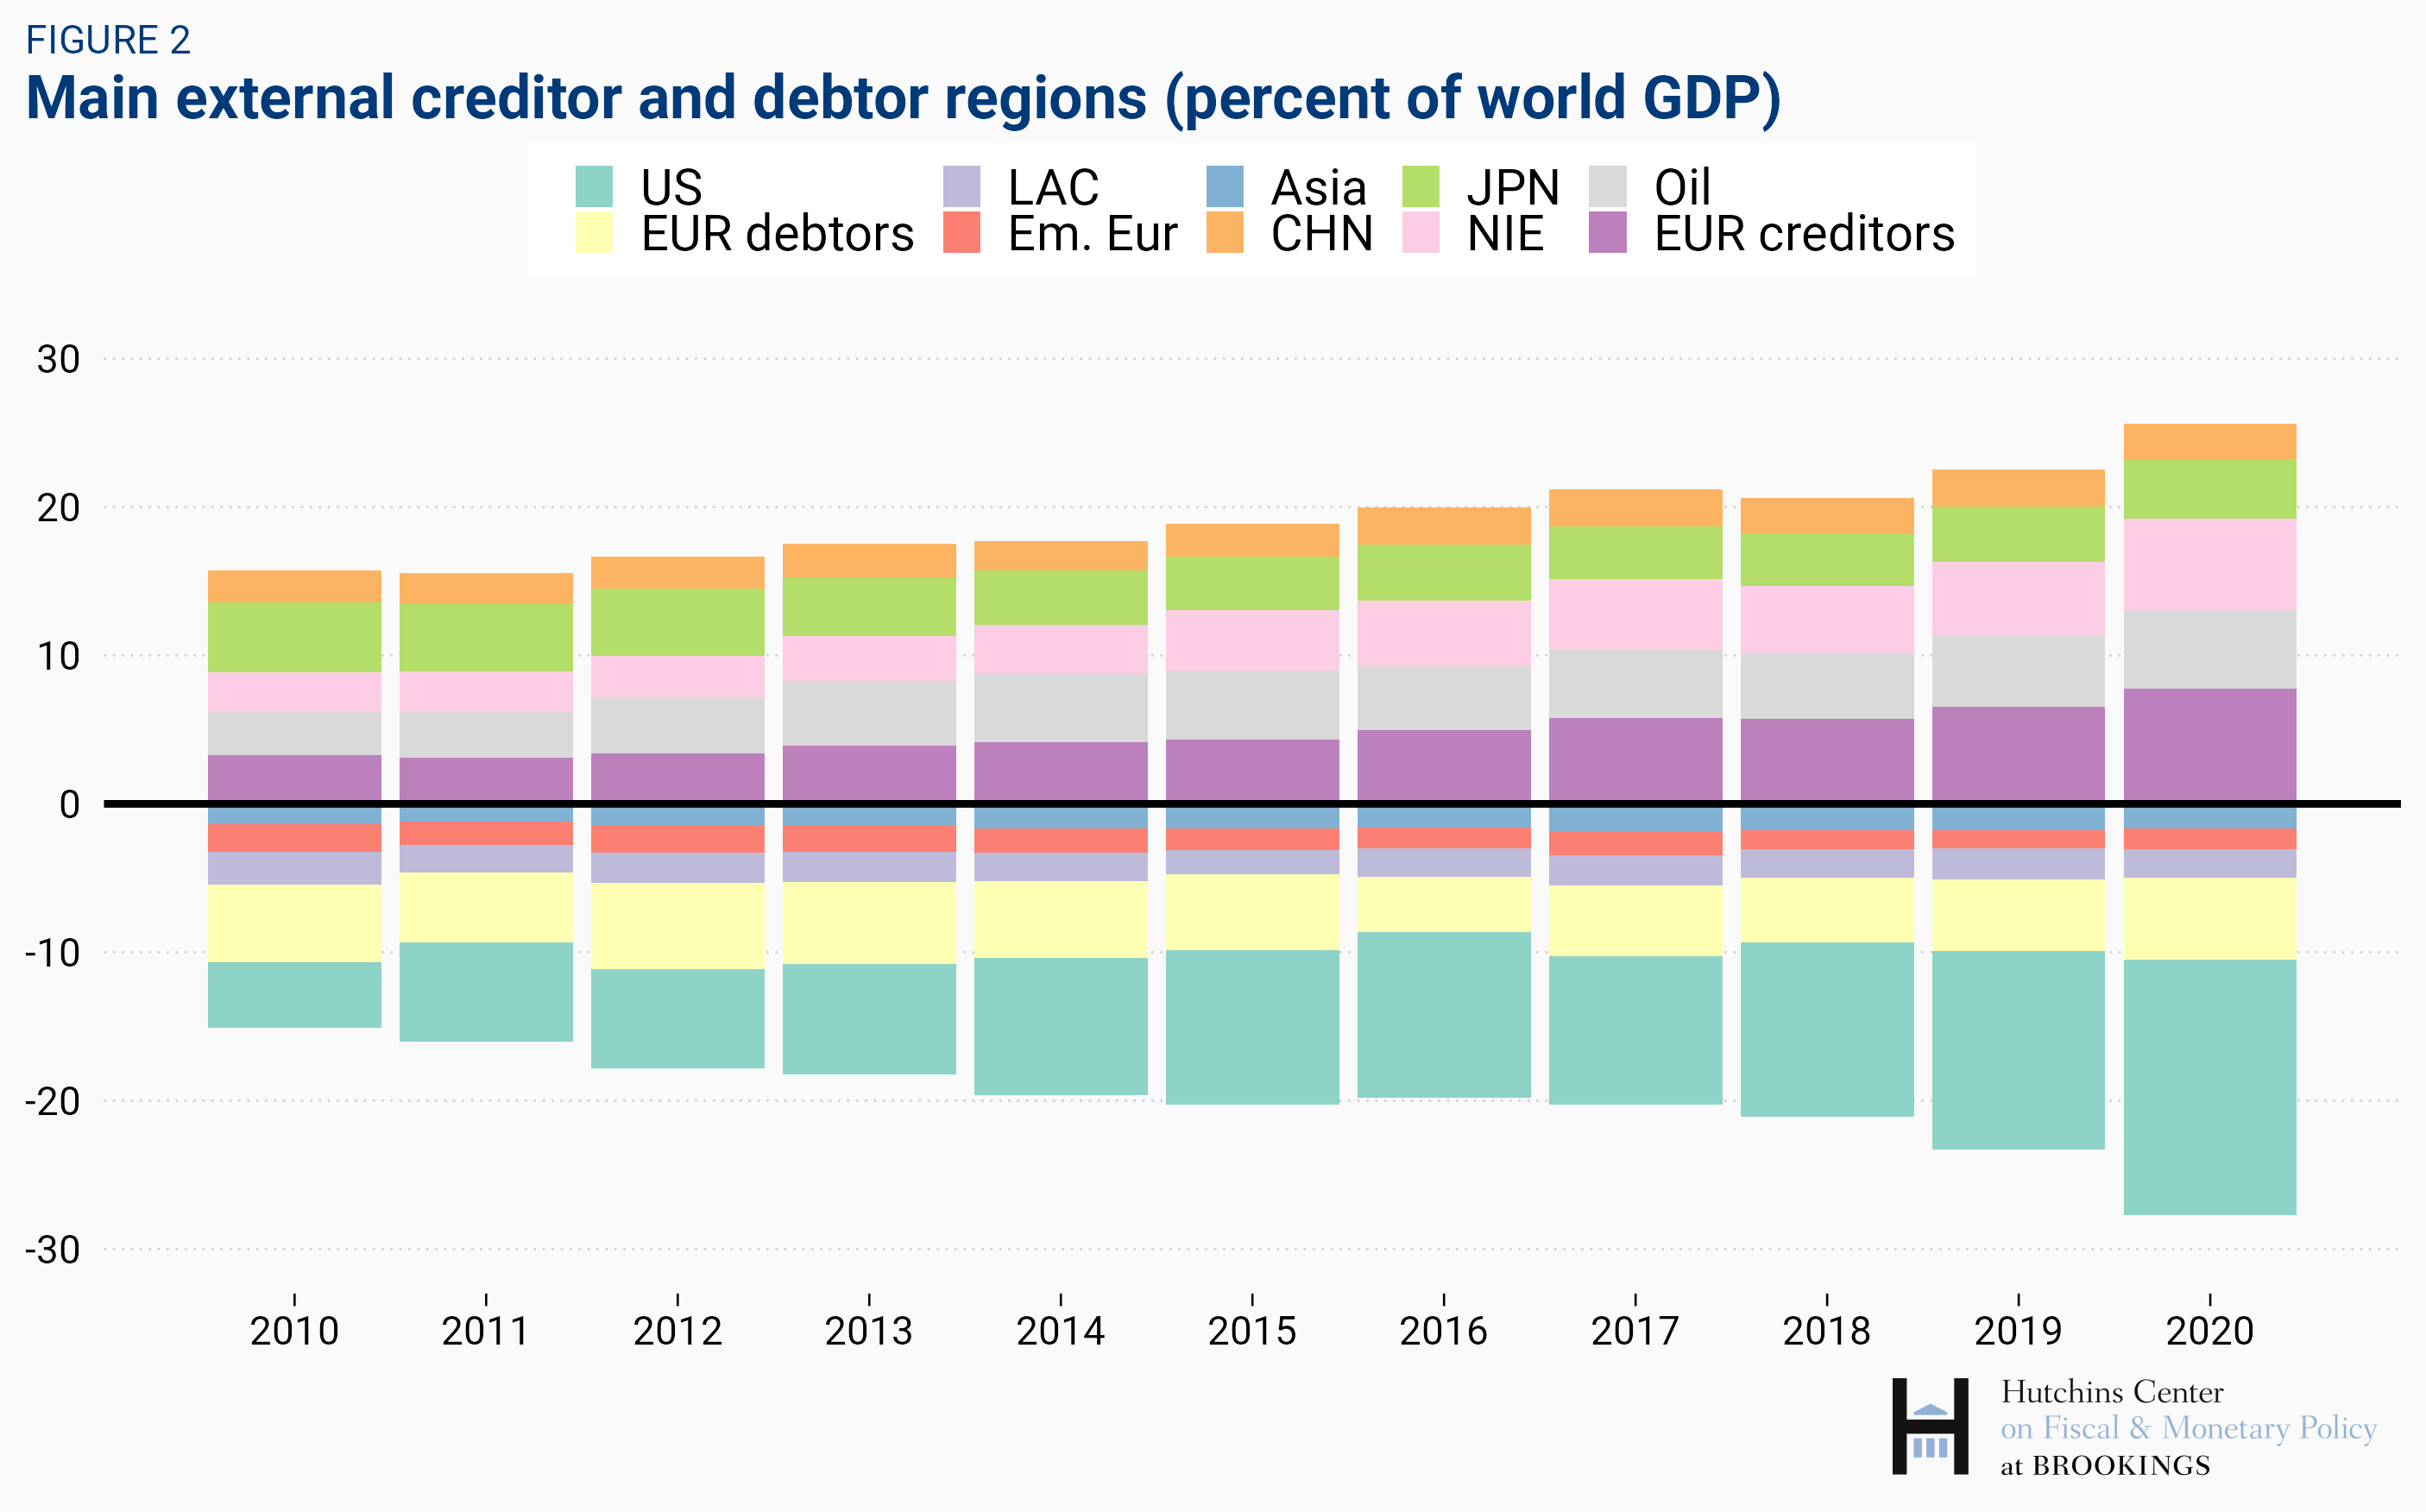
The main creditors are a group of European advanced economies, including Germany, the Netherlands, Norway, and Switzerland among others; large oil exporters (Middle East and Russia); Japan; other advanced Asian economies (Hong Kong, Korea, Macao, Singapore, and Taiwan), and China. While the overall size of creditor and debtor positions has been expanded throughout the past decade, the increase in 2020 is particularly large. This was due to three factors noted earlier: the decline in global GDP, current account imbalances, and the sizable valuation gains experienced by countries with large net equity holdings overseas (which include major oil exporters, advanced European creditor countries, and Asian advanced economies), with corresponding valuation losses for debtor countries experiencing a rapid runup in domestic equity prices, like the United States.
[1] Countries with missing 2020 data are predominantly in Africa and the Middle East, as well as small offshore centers and Pacific islands. The largest are Oman and Venezuela.
[2] The market value of external assets and liabilities is also affected by changes in interest rates and exchange rates.
[3] Rising domestic stock price valuations imply an increase in the value of domestic financial wealth—the deterioration of the net external position only reflects the fact that some of the gains accrue to nonresidents holding domestic stocks.
[4] For the U.S., a country where the net position in equity instruments was close to balance at end-2019, the much stronger rise in domestic stock prices relative to stock prices elsewhere has led to a sizable worsening of the U.S. external position, as documented in Milesi Ferretti, 2021.
[5] For a discussion of global imbalances and changes in net external positions in 2020 for major economies, see the IMF’s 2021 External Sector Report.
References:
Lane, Philip R. and Gian Maria Milesi-Ferretti, 2001, “The External Wealth of Nations: Measures of Foreign Assets and Liabilities for Industrial and Developing Countries“, Journal of International Economics 55 (2), 263-294.
Lane, Philip R. and Gian Maria Milesi-Ferretti, 2007, “The External Wealth of Nations Mark II: Revised and Extended Estimates of foreign Assets and Liabilities, 1970-2004“, Journal of International Economics 73 (2), 223-250.
Lane, Philip R. and Gian Maria Milesi-Ferretti, 2018, “The External Wealth of Nations Revisited: International Financial Integration in the Aftermath of the Global Financial Crisis,” IMF Economic Review 66, 189-222.
The Brookings Institution is financed through the support of a diverse array of foundations, corporations, governments, individuals, as well as an endowment. A list of donors can be found in our annual reports published online here. The findings, interpretations, and conclusions in this report are solely those of its author(s) and are not influenced by any donation.
Related Content


Author

The Brookings Institution is committed to quality, independence, and impact.
We are supported by a diverse array of funders. In line with our values and policies, each Brookings publication represents the sole views of its author(s).

Commentary
The external wealth of nations: September 2021 update
September 16, 2021