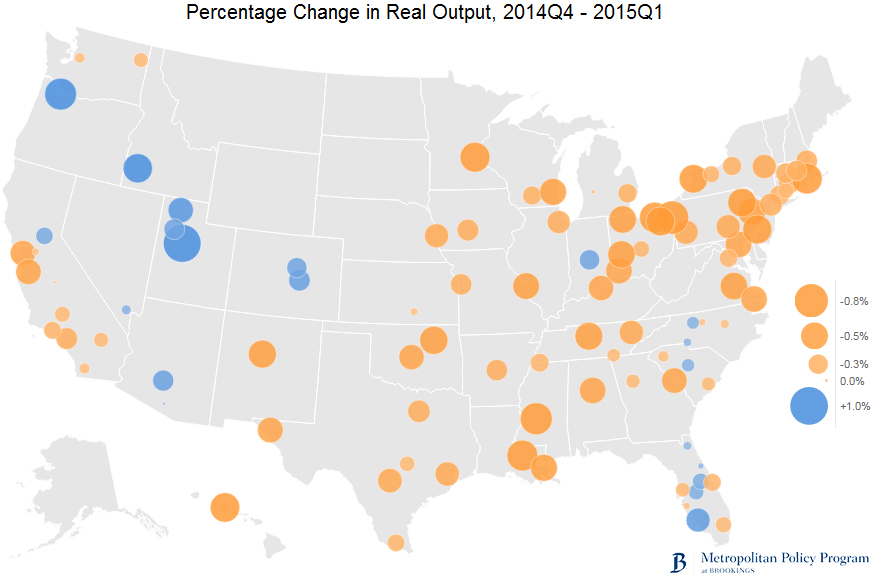
The first quarter of 2015 saw U.S. GDP contract for the first time in nearly five years, prompting new concerns about the durability of a recovery—nominally underway since 2009—that seems yet to have reached a predictable trajectory.
As the latest Brookings Metro Monitor interactive shows, the national-level slowdown was felt unevenly across the country’s 100 largest metropolitan areas—the places where over 70 percent of Americans live and work. GDP growth in four-fifths of the country’s largest metro areas followed the national economy into negative territory. The one-fifth of metro areas where output continued to expand unabated could nearly all be found in the West and South. These metro areas escaped the severe weather that contributed to the declines elsewhere, but those in the West in particular also tended to specialize in the tech-oriented sectors that have proven most resilient in this recovery.
GDP is of course only one economic indicator. The other three indicators of economic vitality tracked by Brookings’ Metro Monitor—employment growth, house price growth, and the unemployment rate—revealed slow but steady gains in overall economic health across the country.
Mountain region metro areas, spanning Arizona, Colorado, Idaho, Nevada, New Mexico, and Utah, saw nearly uniform progress on all indicators. In that region, only Albuquerque saw a reduction in its output during the quarter while Las Vegas also saw its unemployment rate edge slightly higher.
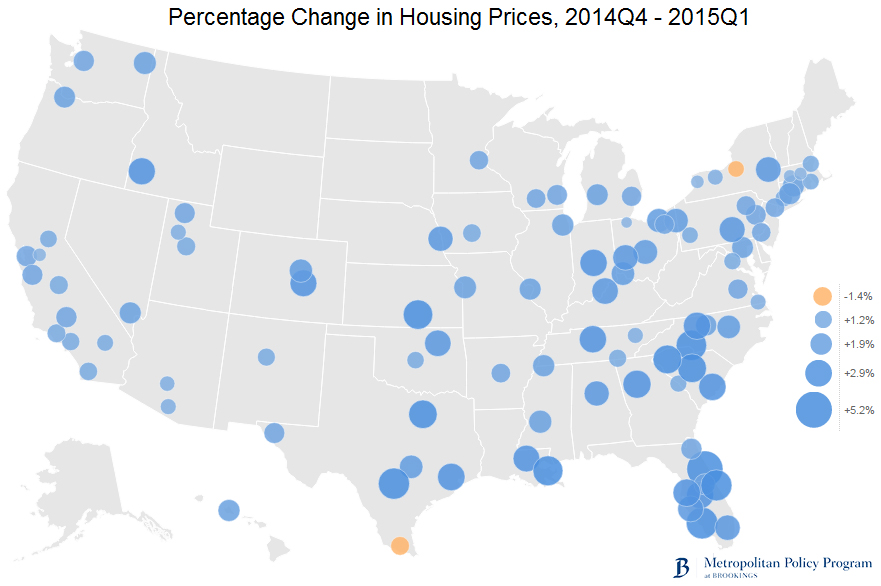
The housing and job growth picture looked consistently better nationwide. Only two places—Syracuse, N.Y., and McAllen, Tex.—saw average house prices decline between the end of 2014 and the beginning of 2015. Metro areas in Florida and other states in the South and Mid-Atlantic chalked up the biggest increases in housing prices, with Deltona and Cape Coral, Fla. ranking first and second respectively for quarterly gains. After a brief hiatus during the recession, the resumption of in-migration to the Sun Belt likely explains the renewed vitality of the region’s housing markets.
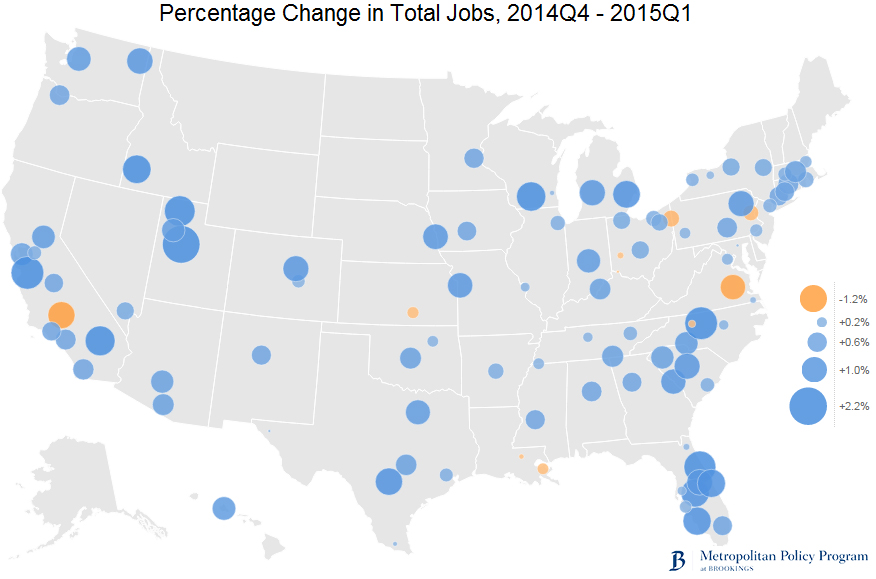
Nearly every major metro area—92 out of 100—had more jobs in the first quarter of 2015 than in the final quarter of 2014. The strongest job growth occurred in metro areas in California—in both the regular top performer San Jose and the metros of the mercurial Inland Empire—as well as in places in Utah and Florida. Unemployment rates improved across the board with Detroit, Portland, Ore., and Fresno seeing the largest decreases over the quarter. Almost all large metro areas in Connecticut, Pennsylvania, and Florida saw increases in the unemployment rate, however.
Quarterly changes aside, many large metro areas now boast stronger economies than before the recession hit. Here, Texas metro areas lead the way. Austin, Dallas, Houston, and San Antonio all enjoy more than 10 percent more jobs today than before the recession started. Joining them as the metro areas furthest beyond the recession are: San Francisco and San Jose in California; Denver; Provo, Utah; and Portland, Ore. in the West; Grand Rapids, Mich.; Columbus, Ohio; Madison, Wisc.; and Omaha, Neb. in the Midwest; and Charlotte, N.C.; Louisville, Ky.; Nashville, Tenn.; and Raleigh, N.C. in the South.
National macroeconomic indicators can often obscure substantial variations in economic activity at the regional level. This quarter’s Metro Monitor finds that, underneath the headline of a national economic slowdown, the West and the South appear to be reclaiming their pre-recession role as drivers of U.S. economic growth, just as some places in the industrial Midwest and parts of the Northeast struggle to counter other economic headwinds.
The Brookings Institution is committed to quality, independence, and impact.
We are supported by a diverse array of funders. In line with our values and policies, each Brookings publication represents the sole views of its author(s).


Commentary
GDP contractions aside, recovery continues in most metro areas
July 20, 2015