I have been invited to talk with you about what this Subcommittee could do to reduce poverty and increase economic mobility. I begin with a brief word about the problem; namely, how difficult it has been reduce the poverty rate. This leads to an overview of one of the most successful government reforms to reduce poverty, the welfare reform law of 1996 and its impacts on work rates and poverty. I then turn to review of what this Subcommittee could do to replicate the success of welfare reform while avoiding its most important problem.
Are We Reducing Poverty and Increasing Economic Mobility?
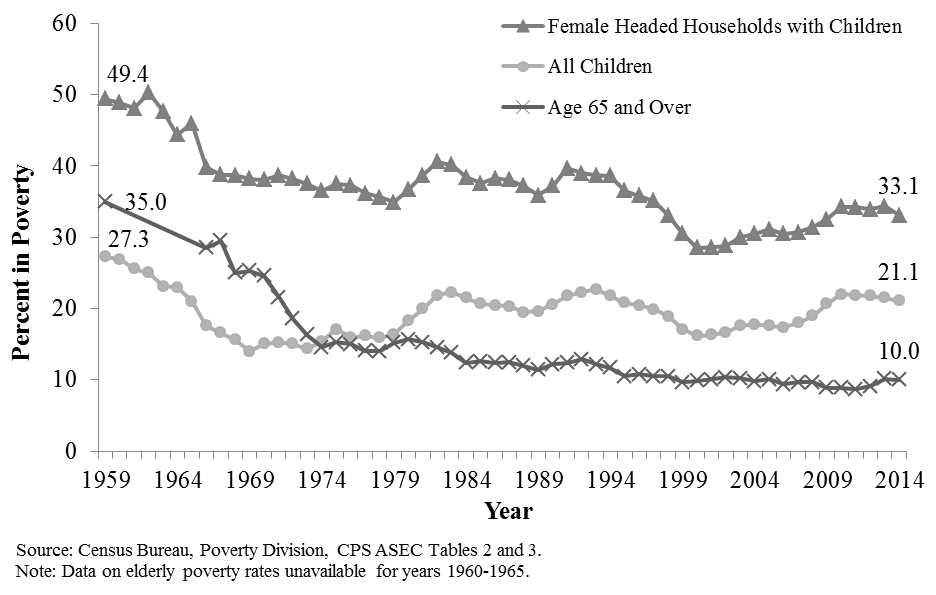
Figure 1 shows the changes in poverty rates since 1959 for three important groups— all children, children in female-headed families, and the elderly. Trends in poverty among the elderly show something like the progress everyone hopes we can make in reducing poverty among all Americans. There was rapid progress in the early 1960s followed by a slower rate of decline but very few years in which the poverty rate increased. Poverty among the elderly today is 10 percent, much lower than the rate among children in the other two groups. The explanation for this pattern can be found in two words—Social Security.[1] Most of the elderly receive a monthly cash payment from the federal government that in most cases, including for the elderly who have few or no additional sources of income, is adequate to keep them out of poverty.
Progress among the other two groups is far less impressive, with an exception to be examined in more detail below. The poverty rate for all children under the official measure shows rapid progress in the 1960s, but little consistent progress since. The child poverty rate in 1960 was 14 percent. By 1980, it was over 21 percent. Worse, in no subsequent year has the child poverty rate reached the 14 percent achieved in 1969. The rate last year, the most recent available, was well over 20 percent. Changes over time in the poverty rate of children in female-headed families has been uneven, and has rarely been below 30 percent. But there was a major decline in the late 1990s that holds an important clue about reducing poverty. I examine this decline in more detail below.[2]
Official Poverty Rates for the Elderly, Female-Headed Households with Children and All Children, 1959-2014
Income Quintile of Children When They Grow Up Relative to Their Parents’ Income Quintile
Note: Numbers are adjusted for family size.
Source: Pew Charitable Trusts, “Pursuing the American Dream: Economic Mobility Across Generations” (Washington: July 2012).
Figure 2 shows a standard measure of economic mobility; namely, the economic position of children compared to the economic position of their own parents based on data from the Panel Study of Income Dynamics that started collecting data on 5,000 families in the 1960s.[3] Then, as the children of parents in the original sample grew up, they were followed as well, yielding data on family income for both the parents and their children. In Figure 2, the five bar graphs divide the parents into five parts (called “quintiles”) based on family income with an equal number of parents in each bar graph. Thus, the 20 percent of parents with the lowest income during their prime earning years are in the bar graph on the left and the 20 percent with the highest income are in the bar graph on the right; parents with income between these two groups are displayed in the middle three bar graphs. Notice that each bar graph is divided into five parts. Each of these five parts represents the income quintile the children of parents in that income quintile wound up in during their prime earning years.
Figure 2 provides an informative way to look at economic mobility across generations. If children wound up in an income quintile that was not correlated in any way with their parents’ income, each bar graph would have five equal parts, each containing 20 percent of the children of the parents represented in the bar graph. This pattern is close to the one found in the middle bar graph which shows that children from parents in the middle income quintile were almost equally likely to wind up in each of the five income quintiles.
But the other quintiles, especially the bottom and the top quintiles, show that where children wind up in the income distribution in their generation is greatly influenced by their parents’ income. Consider the bottom quintile. Adult children from the bottom quintile have a 43 percent chance of winding up in the bottom themselves and only 4 percent of them wind up in the top quintile. Now consider the top quintile. Here we see that adult children whose parents were in the top 20 percent were more likely than adult children in the other quintiles to wind up in or near the top. For example, whereas only 4 percent of the adult children of parents in the bottom quintile made it all the way to the top, 40 percent of adult children with parents in top quintile made it to the top. Equality of opportunity this is not. Several studies have shown that this pattern has not changed much over the generations.[4] We do not now have equality of economic opportunity in America, nor have we ever, although there are and have been many examples of individuals rising far above their parents’ income—and vice versa.
The conclusions are obvious, and almost everyone who studies poverty and economic mobility agrees: progress against poverty has been modest or nonexistent, depending on the group, and the nation has an unequal distribution of income that persists across generations. We have limited equality of educational and economic opportunity in America.
Why Are We Having Trouble Fighting Poverty and Increasing Mobility?
Why has it been so difficult to reduce poverty and increase economic mobility? We now spend around a trillion dollars a year on programs for poor and low-income families and individuals.[5] Until recently, spending increased almost every year. But as spending increased, the nation neither reduced poverty by much nor increased economic mobility. Why, despite all this spending, have we made so little progress?
Most analysts would agree that the dissolution of the two-parent family, little progress in improving the educational achievement of the poor relative to that of the more advantaged, and the decline of work among men are major factors in accounting for our lack of progress.[6] More specifically:
- An ever rising share of American children live in female-headed families, the family type in which children are five times as likely to be poor as children in married-couple families and in which their development is negatively affected.[7]
- In addition, until recent years, more and more children were born outside marriage, in most cases instantly creating the family form in which children are likely to be poor.[8]
- Although education levels have improved modestly, the education gap between kids from poor and rich families has increased substantially, making it difficult for children from poor families to close the income gap between themselves and children from rich families.[9]
- Although work rates among women, especially low-income and poorly educated women, have shown improvement, the work rate for men has declined over the last four decades and wages for men in the lower half of the wage distribution have been stagnant.[10]
A comprehensive strategy to fight poverty and increase mobility would attack these causes on three fronts by aiming to increase the share of children growing up in married-couple families, in part by delaying unplanned births; to increase the educational achievement and years of schooling completed among children from poor families; and to increase work rates among the poor. In this testimony, I confine my attention to increasing work rates, an important determinant of poverty and mobility that this Subcommittee could actually do something about. I begin with the example of welfare reform.
What to Do: An Example
In 1996 Congress passed and President Clinton signed one of the most sweeping pieces of welfare reform legislation ever passed by Congress. [11] A primary goal of the legislation was to help, encourage, and cajole mothers to work. The law did three things to try to increase work rates: it ended the legal entitlement to welfare payments, thereby clearing the way for cash benefits to be contingent on working or preparing to work; it placed a five-year time limit on receipt of cash welfare for most mothers; and it required states to place half their welfare caseload in programs designed to help recipients find work or prepare for work. After the welfare reform law was enacted, work rates among single mothers increased dramatically, the welfare rolls fell more than ever before, and child poverty rates declined to their lowest level ever among black children and among all children in female-headed families. These effects cannot be attributed exclusively to welfare reform. There is general agreement among researchers who study welfare that the growing economy of the second half of the 1990s and the maturing of a system of federal and state subsidies for low-income workers with children, which will be referred to here as the “work support system,” also played important roles in accounting for the dramatic increases in work and falling poverty rates.
[12]
Effect of Earnings, Transfers, and Taxes on the Poverty Rate among Households Headed by Single Mothers, 1987-2013
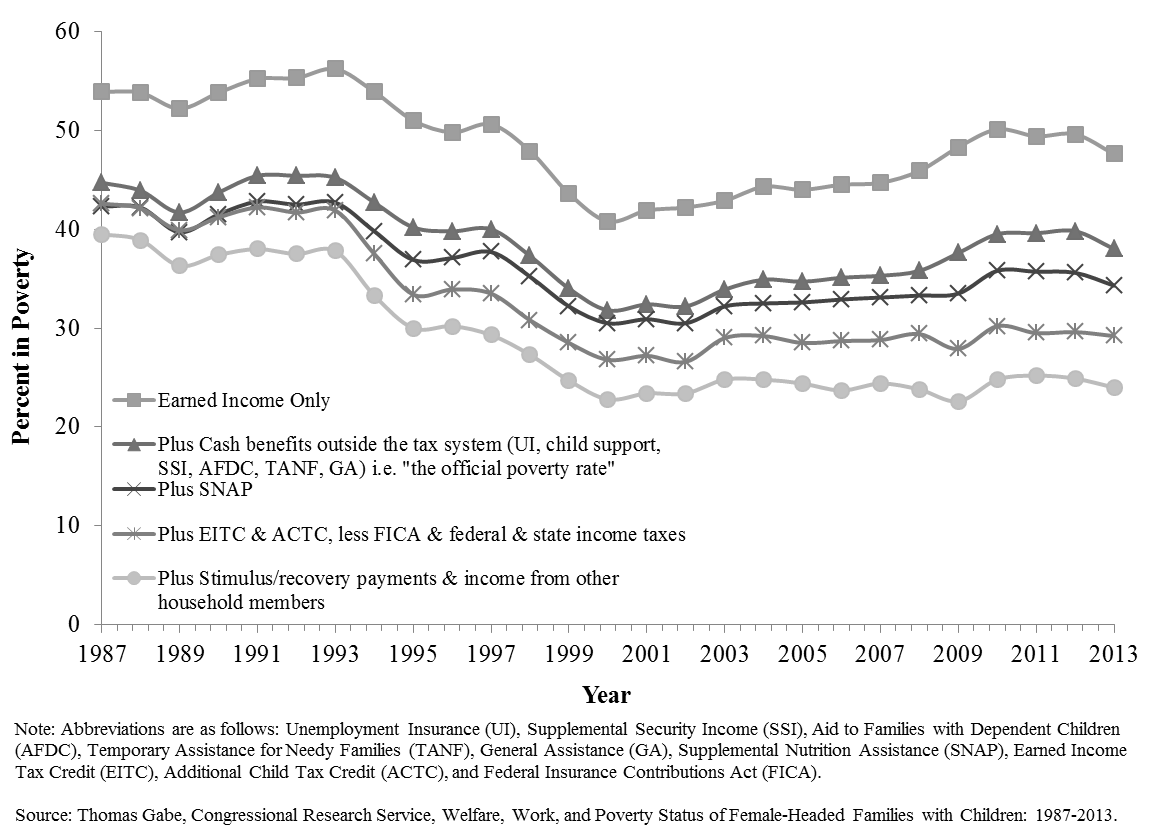 Thus, it is the combination of the push of strong work requirements and the pull of earnings supplements from the work support system that provides the most complete explanation of how the nation can reduce welfare rolls, increase work, and reduce child poverty. A recent report from the Congressional Research Service shows how the new push and pull system works. Figure 3 shows the trends in poverty rates from 1987 to 2013 based on a poverty measure that, unlike the official measure used above, counts a wide-range of government benefits (including noncash benefits like the Supplemental Nutrition Assistance Program, SNAP, often referred to as food stamps, and cash benefits such as tax credits) as income. The top line shows the poverty rate among female-headed families when only earnings are counted as income. Lines below the first line show the poverty rates when income from the various work support benefits is added to earnings and taxes are subtracted in stepwise fashion.
[13]
The major finding from the figure is that government work support benefits have greatly reduced poverty rates among female-headed families (and low-income two-parent families as well) in every year since 1987. In addition, the chart reveals a number of important lessons for members of this Subcommittee for fighting poverty. Here is a summary of data from Figure 3 that provides the information we need to understand these lessons:
| Poverty Rate Based on: | |||
|
Years |
Earnings Only |
Earnings plus Benefits Minus Taxes |
Difference (Percent) |
|
1987-93 |
54.3 |
41.7 |
-23.2 |
|
2000 |
40.8 |
26.8 |
-34.0 |
|
2010 |
50.1 |
29.6 |
-40.9 |
|
2013 |
47.6 |
29.2 |
-38.7 |
In the early period from 1987 to 1993, the poverty rate among female-headed families with children based only on the mothers’ earnings was very high—well over 50 percent in every year and averaging 54.3 percent. Then the poverty rate based on earning plummeted for the next seven years, falling from 54.3 percent to 40.8 percent, the lowest it had ever been for female-headed families. This precipitous decline in poverty was caused mostly by much more work among single mothers, attributable in large part to welfare reform.
Now consider how work support programs impacted the poverty rate based on earnings only. Government transfer programs drove the poverty rate down from 54.3 to 41.7 percent in 1987-93,[14] a reduction of about 23 percent. But when the work rate was much higher in 2000, the poverty rate based exclusively on earnings was only 40.8 percent, 25 percent lower than the comparable rate in the 1987-1993 period. Even better, after single mothers received the package of work-based benefits, the 2000 poverty rate fell to 26.8 percent, a decline of 34 percent.[15]
In 2010, work declined and poverty rose, due to the Great Recession. Yet the combination of relatively high work rates in 2010 (relative to the 1987 to 1993 period) kept poverty lower than during the earlier period and the impact of government programs in percentage terms produced nearly twice as great a decline in poverty as in the earlier period (a reduction of 40.9 percent vs. 23.2 percent).
Finally, the figures for 2013 show that female heads are now increasing their earnings from work, and the work-based safety net continues to reduce poverty a great deal (nearly 39 percent).
This analysis shows that the federal work support system achieves the goal of, as President Clinton put it so tersely, “making work pay.”[16] The most important element of the work support system was the creation of the EITC program in 1975 and its expansion, almost always on a bipartisan basis, on several occasions since. The EITC provides working families that include children with nearly $60 billion each year, mostly in one-time cash payments. The passage of the Additional Child Tax Credit (ACTC) as part of the Bush 2001 tax reforms, along with subsequent expansions of the ACTC, were also important and now provide working families that include children with around $30 billion each year. In addition, child care subsidies have been expanded on numerous occasions, the Supplemental Nutrition Assistance Program (SNAP) has been modified to make it easier for working families to claim the benefit, the Medicaid program has been modified and extended (in part by creating the Child Health Insurance Program in 1997) to cover almost all children under 200 percent of poverty, and a number of other improvements have been made in the work-based safety net at both the federal and state levels. This system is available to all low-income working families with children and virtually guarantees that if parents work close to full time, they and their children can escape poverty.
What to Do: Two Ideas for the Nutrition Subcommittee
There are two actions this Subcommittee could take in the near future that would have an excellent chance of reducing poverty. The most important outcome of welfare reform was increased work rates by single mothers. Not only did the work rate of single mothers increase in the years after welfare reform, they have stayed higher than they were in the early 1990s and previously despite two recessions and the increased unemployment that comes with recessions. Given the importance of benefits from the work support system in fighting poverty, work becomes even more important because welfare recipients have to work to get benefits from the work support system. So work opens up two sources of income—earnings from the employment and benefits, especially tax credits, that can only be obtained if mothers work.
The food stamp program currently has modest work requirements, but they do not appear to be rigorously enforced. Last year Congress, at the instigation of the House Agriculture Committee, wisely provided $200 million over a period of years for the Department of Agriculture to sponsor ten pilot demonstration programs by states that are willing to explore innovative ways to encourage work among food stamp recipients.[17] An interesting parallel of this action is that the 1996 welfare reforms were preceded by more than 40 states conducting demonstration programs aimed at testing ideas about how to promote work, many of which were evaluated by high quality research designs. These demonstrations generally showed that mothers on welfare could work and that programs that helped them prepare for work and look for jobs increased work rates and reduced the welfare rolls.[18] By the time of the welfare reform debate of 1995-96, most members of Congress on both sides of the aisle realized that many mothers on welfare were capable of working and that good programs that helped them prepare for and find jobs could substantially increase their work rate and reduce the welfare rolls. It seems likely that the ongoing food stamp demonstration programs will provide solid ideas about how states can increase work rates among food stamp recipients, in this case both women and men. These results can be expected to provide the Subcommittee with ideas about how to write legislation that would encourage work among food stamp recipients.
An outcome of welfare reform that should be emphasized is that most mothers who found employment worked in low-wage, mostly unskilled jobs. Thus, their earnings were generally quite low.[19] Few states had effective programs that attempted to upgrade the skills of mothers. Even low-wage jobs provided a step toward self-sufficiency, but many analysts think that with training (especially training for jobs available in the local economy), these mothers could attain the skills that would lead to better jobs, higher earnings, and even lower poverty rates. There is now a large and growing literature on how skilled jobs that require a certificate, a license, or a two-year degree, often from a community college, can help young people from poor and low-income families qualify for good jobs with higher incomes.[20] According to the Department of Agriculture, the work demonstration pilots will test “a range of job-driven strategies, including intensive sector-based approaches and career pathways that prepare workers for specific occupations.” And because the pilots are being subjected to scientific evaluations, we can be confident that the findings will be reliable. These pilots, in other words, are very likely to provide the basis for legislation that will encourage or require states to establish programs that increase both work rates and earning among food stamp recipients.
A word of caution, based on the results of welfare reform, is in order. The share of families in poverty receiving welfare cash payments has declined as compared with the share receiving cash under Aid to Families with Dependent Children (AFDC), the cash welfare program that preceded the 1996 welfare reforms. In 1979, for every 100 families in poverty, 82 families received AFDC. By contrast, in 2013, for every 100 families in poverty, only 26 families received Temporary Assistance for Needy Families (TANF), the cash welfare program established by the welfare reform law of 1996.[21] Some observers have concluded that the increases in work and reductions in poverty achieved by welfare reform resulted from work requirements and time limits that forced too many mothers off TANF without jobs. But there is little evidence that harsh provisions are necessary to encourage able-bodied adults to work. Reasonable requirements, strongly enforced, and accompanied by the carrots for work provided by the work support system, may well be enough to encourage adults to work. And in any case, the Subcommittee will have the results from ten state food stamp pilot work programs to provide ideas about how food stamp recipients can be encouraged to work without resorting to harsh measures.
A second caution is that some people believe the goal of food stamp work requirements should be to get as many people as possible off food stamps. This goal, however, sharply conflicts with another goal of food stamps as a vital part of the work support system; namely, to supplement the earnings of low-wag
e workers and thereby both improve their economic standing and provide a strong work incentive. Just as many mothers who join the welfare rolls lack the skills and experience to fill the requirements of high wage jobs, so many recipients of food stamps are similarly qualified only for low-wage jobs. To both Congress and society, the goal of luring people into work and helping them improve their economic condition should be the most important goals. Some of these people will work their way into jobs that pay enough that they will no longer qualify for food stamps. But most people, including parents, who are on food stamps will not have the skills to command high wages. In these cases, food stamps will provide an incentive to continue working and will allow workers to boost their income.
Conclusion
Over the last four decades, Congress has constructed a work support system that not only makes work pay, but also provides substantial work incentive. The food stamp program is a vital element of that system. When the incentives of the work support system are combined with effective programs that encourage work, help people acquire skills, and help them find employment, many of the adults receiving food stamps today and in the future will join the workforce, increase their self-sufficiency, set an example for their children, and improve their economic condition. Moreover, the state food stamp work demonstrations now being implemented seem likely to serve as a beacon to help states implement and sustain programs of this type.
Note: The views expressed in this piece are those of the author and should not be attributed to the staff, officers, or trustees of the Brookings Institution.
[1] Jonathan Gruber and Gary Engelhardt, “Social Security and the Evolution of Elderly Poverty,” in Public Policy and the Income Distribution, ed. Alan Auerback, David Card, and John Quigley (New York: Russell Sage Foundation, 2006), 259-287.
[2] “Income and Poverty in the United States: 2014” (Washington: United States Census Bureau, September 2015).
[3] Pew Charitable Trusts, “Pursuing the American Dream: Economic Mobility Across Generations” (Washington: July 2012).
[4] Raj Chetty, Nathaniel Hendren, Patrick Kline, Emmanuel Saez, and Nick Turner, “Is the United States Still a Land of Opportunity? Recent Trends in Intergenerational Mobility,” American Economic Review Papers and Proceedings 104 (2014):141-147.
[5] “CRS Report: Welfare Spending the Largest Item in the Federal Budget,” accessed October 23, 2015, http://1.usa.gov/1O4ZADy.
[6] Ron Haskins and Isabel Sawhill, Creating an Opportunity Society (Washington: Brookings Institution Press, 2009).
[7] David Ribar, “Why Marriage Matters for Child Wellbeing,” Future of Children, Policy Brief, Fall 2015.
[8] Ron Haskins, “The Family is Here to Stay—Or Not,” Future of Children 25(2) (Fall 2015): 129-153.
[9] Sean Reardon, “The Widening Academic Achievement Gap Between the Rich and the Poor: New Evidence and Possible Explanations,” in Whither Opportunity? Rising Inequality, Schools, and Children’s Life Chances, edited by Greg Duncan and Richard Murnane (New York: Russell Sage Foundation, 2011), p. 91-116.
[10] Harry Holzer and Marek Hlavac, “A Very Uneven Road: US Labor Markets Since 2000,” US2010 series (New York: Russell Sage Foundation, 2012).
[11] Ron Haskins, Work over Welfare: The Inside Story of the 1996 Welfare Reform Law(Washington, DC: Brookings, 2006).
[12] Carolyn J. Heinrich and John Karl Scholz, ed., Making the Work-Based Safety Net Work Better: Forward-Looking Policies to Help Low-Income Families (New York: Russell Sage, 2011).
[13] Figures were adapted from Thomas Gabe, “Welfare, Work, and Poverty Status of Female-Headed Families with Children,” R41917 (Washington: Congressional Research Service, November 21, 2014), especially Figure 13, p. 33.
[14] Poverty rates in this section that take benefits into account are not the official federal poverty rate. They are based on the official poverty threshold (the amount of income that divides the poor and nonpoor) but add benefits that are mostly not included in calculating the official poverty rate.
[15] The bottom line in Figure 9 includes payments from programs enacted as part of the American Recovery and Reinvestment Act of 2009, most (but not all) of which are now expired. Also included in the last line is income the mother receives from other household members.
[16] The combination of work support benefits does have work disincentives in the sense that some program benefits are reduced as earnings rise. In most cases, however, the combination of earnings and work support benefits yield higher total income than either earnings alone or welfare benefits alone. According to the Congressional Budget Office, the marginal tax rates on earnings for low-income working families can be as high as 60 percent. See Congressional Budget Office, “Effective Marginal Tax Rates for Low- and Moderate-Income Workers” (Washington: CBO, November 2012).
[17] Department of Agriculture, “2014 SNAP E & T Pilots,” accessed October 22, 2015, http://www.fns.usda.gov/2014-snap-e-t-pilots.
[18] Judith M. Gueron and Howard Rolston, Fighting for Reliable Evidence (New York: Russell Sage, 2013).
[19] Greg Acs and Pamela Loprest, “TANF Caseload Composition and Leavers Synthesis Report,” (Washington, DC: Urban Institute, March 28, 2007).
[20] Tamar Jacoby, “The Certification Revolution,” in Michael Petrilli, ed., Education for Upward Mobility (New York: Rowman & Littlefield, 2016); Sheila Maguire et al., “Tuning Into Local Labor Markets: Findings from the Sectoral Employment Impact Study” (Philadelphia: Public/Private Ventures, 2010).
[21] LaDonna Pavetti, “Testimony of LaDonna Pavetti, Ph.D., Vice President, Family Income Support Policy, Before the House Ways and Means Committee, Subcommittee on Human Resources” (Washington: Center on Budget and Policy Priorities, April 30, 2015), http://waysandmeans.house.gov/wp-content/uploads/2015/06/LaDonna-Pavvetti-Testimony-043015-HR3.pdf
Related Books


The Brookings Institution is committed to quality, independence, and impact.
We are supported by a diverse array of funders. In line with our values and policies, each Brookings publication represents the sole views of its author(s).


Commentary
TestimonyHow to reduce poverty and increase economic mobility
October 27, 2015