Nearly a decade after the founding of Uber and Airbnb it’s still hard to get a handle on the size and importance of either those particular platforms or the larger “gig economy.”1
On the one hand, the rise of Uber, Lyft, and Airbnb has generated so much controversy about online talent platforms, the changing nature of work, and workers’ rights that it has at times been hard to get a clear fix on the sector and its meaning.2
On the other hand, the sector’s size and growth has been difficult to clarify, because it has been difficult to measure. Government data-gathering, for example, has not been well positioned to capture the gig economy, in part because it is conceptually complex and in part because the government stopped counting “contingent workplace” arrangements after 2005.3
Which means that no comprehensive database exists on either employment in the gig economy or its geography.
As a result, debates have flared over the true size and significance of the sector. Some skeptics, by way of aggregate self-employment statistics, conclude that “proof of the revolution…is hard to find.” Others have worked directly with platform company data or leveraged other proprietary information to assess the size and nature of online gigging. Overall, these national analyses have tended to describe a small but rapidly growing realm of platform-enabled freelancing. So far, though, the findings have yet to be extended to city-by-city estimates of growth or comparisons of activity across metro areas.
However, it turns out that for all of the limitations of the available data, additional light can in fact be thrown on the online gig economy. Specifically, insight can be gleaned—if one knows where to look for it—from an obscure Census Bureau dataset on “nonemployer firms,” which tracks the activity of “businesses” that earn at least $1,000 per year in gross revenues (or $1 in construction) but employ no workers.4
As it happens, the vast majority of these “businesses”—up to 93 percent of them in the rides and rooms industries—turn out to be self-employed, unincorporated sole proprietors.5 In other words, they are individuals earning income by freelancing or contracting with other businesses such as Uber, Lyft, and Airbnb. All of which means that one can learn a lot by analyzing these “firms’” proliferation and location—especially since the data (derived from tax records at the Internal Revenue Service) are available at fairly detailed levels of industrial activity (NAICS codes) and geography (counties).6
Related Content

And so one of us looked last year at one city (early-adopting San Francisco) and at two leading gig economy segments (rides and rooms) and found a substantial rise in platform “gigs” between 2009 (when uptake began) and 2013 (the latest year data was available). The platform economy was clearly trackable and substantial—if only in one unique city.7
Yet now, with another year of data available, it is possible to update and expand the initial analysis. Therefore, we look here at the two industries most closely associated with the online gig economy—peer-to-peer ride-sharing and peer-to-peer room-sharing—and assess gig activity both nationally and with a particular focus on the 50 largest metropolitan areas. For comparison, we benchmark these trends against trends in nonemployer firms for the entire economy, and against payroll employment in the requisite industries. In addition, we used corporate websites and local news outlets to confirm that Uber, Lyft, and Airbnb were in fact operating in the 50 large metro areas during the years examined. They were. Uber and Lyft were running in many of the 50 metros’ principal cities by 2012 and in most of them by 2013. Airbnb was operating in all of the metros by 2012.8
What, then, do we see in these data focused on the rides and rooms industries? Three major findings stand out:
The gig economy, as reflected by nonemployer firms, is significant and growing fast.
Overall, there has been a clear surge in nonemployer firms’ business activity in the last decade, which almost certainly reflects, at least in part, the rise of online platforms.
To begin with, nonemployer firms—though still relatively small in overall economic value historically (accounting for about 3 percent of total business receipts)—are becoming a more important factor in the entire economy, having come to encompass nearly 24 million “businesses” in 2014 up from 15 million in 1997 and 22 million in 2007. (By comparison, total U.S. payroll employment was about 145 million in 2014, up from 129 million in 1997). To be sure, some of the recent growth in nonemployer firms reflects the spread of myriad investment vehicles and other partnerships such as limited partnerships that are increasingly used for disbursing a particular pools of funds. However, self-employed, sole proprietor, unincorporated firms (that is, contractors and freelancers) constitute the lion’s share of this activity (seven of every eight nonemployer firms). In short, gig employment—whether digital platform enabled or not—has been growing.

Turning to the rides and room industries, the nonemployer firms data documents parallel, but differently scaled, increases in activity in the two industry segments associated with passenger ground transit after 2010 (when Uber launched in San Francisco) and in the two industries linked to traveler accommodation after 2008 (the year Airbnb opened). Granted, nonemployer firms in the taxi and limousine industry were a big part of the “rides” sector prior to the arrival of Uber and Lyft.9 However, after 2010, independent contractor growth in the ground transportation industry suddenly takes off—and then explodes in 2014 (a trend that is likely to have continued in 2015 and 2016). In that year the nonemployer firm growth rate in ride-sharing was 34 percent, compared with 4 percent for payroll employment in the industry. Between 2010 and 2014, nonemployer firms in ride-sharing grew by 69 percent while payroll employment grew by just 17 percent.

Trends in the “rooms” sector are similar but of a lesser magnitude. Nonemployer firms in the sector play a much more modest role in employment, which makes sense given how many employees it takes to operate a typical hotel. Nonemployer firms, on the other hand, contract out things like cleaning services, and meals and entertainment that will spill over into the local economy. Even so, nonemployer firms have been growing at a faster pace in the rooms business than has payroll employment, particularly after 2008 when Airbnb launched. An especially sharp jump is apparent in 2014—when more than one-half of the period’s growth occurs (specifically, a one-year increase of 9 percent). Moreover, home-sharing sectors are likely especially undercounted in the data, because of tax reporting requirements—which again, are not mandatory until a room-sharing host exceeds $20,000 in receipts or 200 transactions each year. In addition, recent reports suggest that many Airbnb hosts are not individuals, but businesses renting properties on a permanent basis—an activity that likely does not show up in the data.

In short, a surge of nonemployer firm activity—explosive in ground transportation and noticeable in accommodations—seems to directly coincide with the large-scale expansion of the gig economy and uptake of online platform services. Whereas payroll employment in the ride-sharing industry grew by 17 percent between 2010 and 2014, nonemployer firms (including gigging freelancers) increased by 69 percent. Likewise, although payroll employment in the home-sharing industry grew by 7 percent, nonemployer firms grew by 17 percent.
Of course, these numbers should be interpreted with caution. While the expansion of nonemployer firms in the two sectors coincides with widening adoption of these online platforms, we cannot say for sure that one caused the other, nor can we say that growth is entirely attributable to ride- and room-sharing apps. However, it is reasonable to conclude that, at a minimum, the emergence of these online platforms is contributing to the growth of the freelance and contractor workforce in a material way.
Platform-based freelancing is not yet substantially displacing payroll employment—but that could change.
Despite the uptick in nonemployer contractors, payroll employment in “rides and rooms” industries has not declined during the last five years. Instead, payroll employment has increased in these industries, particularly in the passenger ground transit sectors.

Again, caution is due when interpreting the data as the underlying dynamics are complex. Nonetheless, the rides and rooms sectors saw 17 percent and 7 percent growth, respectively, in payroll employment between 2010 and 2014. This rise contradicts the widely held belief that platform-based freelancing has displaced wide swaths of existing businesses. Uber and Airbnb, at least between 2010 and 2014, were not in most cases driving traditional incumbent firms to lay off payroll workers or go out of business. Instead, these data lend credence to the contention that Uber and Airbnb are meeting unmet consumer demand or stimulating new demand through innovative service offerings.
Yet it is still early. Nonemployer firm growth is clearly rising, and accelerating in the ride-sharing sector. These trends raise the possibility that the online marketplaces could cannibalize competing payroll businesses in some industries, particularly given the rapid deployment of new technologies. For example, Lyft recently claimed that most of its cars will be self-driving in five years. While that forecast sounds overly-ambitious to us, its actualization would spell trouble for human drivers, both those on payrolls and freelancers alike. More detailed tracking of the industry will be necessary to ascertain how these dynamics play out.
Online gigging in the rides and rooms industries is so far concentrated in large metropolitan areas.
Turning to the geography of nonemployer firm growth, it appears that gig economy activity is unevenly distributed in the rides and rooms industries. To begin with, the spread of nonemployer firms between 2010 and 2014 occurred mostly in the largest metro areas. No less than 81 percent of the four-year net growth in nonemployer firms in the rides sector took place in the 25 largest metros, while 92 percent occurred in the largest 50 metros. For rooms, those figures were, respectively, 56 percent and 70 percent—just slightly more than it was across all industries. (It makes sense that rides would be more concentrated in urban areas than rooms, given that a larger share of the nation’s travel and stays in overnight accommodations lies outside of urban areas.)
A closer look at the distribution of nonemployer firm growth reveals a variegated map of often rapid growth. Focusing now on just the years 2012–2014 (when Uber, Lyft, and Airbnb were really catching on), growth is explosive for rides across most larger US metro areas, with all 50 large metros gaining activity. For rooms the growth is more muted but also noticeable.
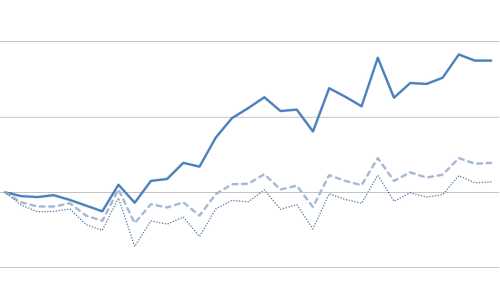
Change in nonemployer firms and payroll in select passenger ground transportation industries (2012-2014)
50 largest metropolitan areas; click on chart legend to resort metro areas
Source: Brookings analysis of Census Bureau and Moody’s data. Note: Payroll employment has been suppressed for Tampa and Milwaukee.
Setting the pace of growth in the ride-sharing industry were seven tech-oriented, mostly Western, metro areas. These seven saw nonemployer-firm activity in the ride industry double during the two years, with San Jose and San Francisco leading the way, followed by Los Angeles, Austin, San Diego, and Nashville. More broadly, more than half (27) of the large metro areas saw 50 percent or better growth in nonemployer firms in ground transportation industries, with two-year growth rates ranging of 94 percent in Boston, 85 percent in Pittsburgh, and 82 percent in Seattle to 63 percent in DC, 61 percent in Indianapolis, and 52 percent in Providence. Lending credence to the suggestion that nonemployer-firm growth reflects gig economy growth is the fact that five of the slowest growing ten metros for nonemployer firms on the rides side are five of the six metros in which either Uber or Lyft had yet to launch during the study years.
By comparison, payroll employment growth in the industry was much more subdued, or negative, in 17 metro areas.10 In San Jose and Sacramento, where nonemployer firms in ground transportation grew by 145 and 92 percent, respectively, payroll employment declined by 31 percent and 22 percent, respectively. This evidence suggests that while peer-to-peer rides do not appear to be cannibalizing taxi drivers on payroll in a widespread fashion, the potential may be there in some markets. With that said, the present data do not allow formal analysis of whether displacement is occurring, so the coincidence of nonemployer firm growth and payroll decline should be interpreted with caution, as many other factors could be at play. After all, the shift to contractors in the rides industry began well before the arrival of Uber and Lyft. Meanwhile, the dynamics of individual markets vary widely and lie beyond the scope of this analysis.
Data on the rooms sector, meanwhile, reveals a more subdued story of change. Still, nonemployer firm growth was widespread, with five metro areas (Austin, San Francisco, Portland, New Orleans, and San Jose) registering 37 percent or better two-year firm growth, and 13 metros seeing gains of 20 percent or more. Payroll employment, meanwhile, has held steadier than in the rides industry.
Change in nonemployer firms and payroll in select traveler accommodation industries (2012-2014)
50 largest metropolitan areas; click on chart legend to resort metro areas
Source: Brookings analysis of Census Bureau and Moody’s data.
Overall, the nonemployer firm data consulted here add to what is known about the development and implications of the online-enabled gig economy.
To be sure, the information here remains imperfect.
For one thing, the nonemployer firms data only allow analysis of potentially gig-driven changes in two industries, given that it remains a proxy measure for platform-based gigging. For another thing, the present analysis remains confined to just two precincts of the much larger gig economy, given that such activity is difficult to capture in more diffuse industry areas, such as crafts, errand-running, and task-fulfillment. For now, the conceptual blurriness of such activities precludes analysis of freelancing on platforms like Etsy, Taskrabbit, or Thumbtack.
Finally, the nonemployer firm trends presented here reflect lagged data, and do not include activity in 2015 and 2016. As such these data clearly underestimate the true amount of activity occurring on these platforms. Given this fact, it seems fair to say the trends noted here represent a lower-bound estimate of online gig growth in these two industries.
And yet, despite these flaws, the nonemployer firm data suggests that the online platform economy is showing up in the official statistics; that it is mostly an urban phenomenon, at least in rides and rooms, where it is having a sizable impact locally; and that its onset in early-adopter cities like San Francisco and San Jose is now extending to other large cities all across the nation. Granted, future analysis will need look more closely at the effects of the gig economy on payroll employment and wages over time. Whether platform-based gigging serves unmet consumer demand or cannibalizes it from payroll enterprises will be a critical question in the next few years. Likewise, additional work must tackle the size and growth of the gig economy in broader and harder-to-measure industries.
With that said, this analysis does provide a start at a solid cross-sectional picture.
In any event, it is good to know—in the absence of systematic, topic-specific government counts—that the nonemployer firm data can provide a plausible estimate of the growth and geography of some zones of the hard-to-measure gig economy. Though imperfect, these data, we believe, point in the direction that common sense suggests: The platform economy for rides and rooms is now sizable and growing rapidly in many larger metro areas.
Authors


-
Footnotes
- Online ride platforms like Uber and Lyft, as well as Airbnb and other short-term room-rental and accommodations firms, are currently the best-known enablers of what has frequently been called the “gig economy.” We define the “gig economy” as the matching of freelance workers or service providers to customers on a digital platform or marketplace.
- See, among proponents, Arun Sundararajan, <em>The Sharing Economy: The End of Employment and the the Rise of Crowd-Based Capitalism</em> (Cambridge: MIT Press, 2016). For a critical account of the “gig economy” see Steven Hill, <em>Raw Deal: How the “Uber Economy” and Runaway Capitalism Are Screwing American Workers </em> (New York: St. Martin’s Press, 2015).
- For a good review of non-standard and “contingent” work arrangements and the many data gaps that complicate analysis of them see Annette Bernhardt, “Labor Standards and the Reorganization of Work: Gaps in Data and Research” (Berkeley: Institute for Research on Labor and Employment, 2014). The Current Population Survey (CPS) Contingent Work Supplement (CWS) attempted to measure contacted work in its worker surveys but was not viewed as highly reliable and was discontinued in 2005. Earlier this year Labor Secretary Thomas Perez announced that the Bureau of Labor Statistics, in conjunction with the Census Bureau will revive the CPS supplement in the 2017 survey.
- Authors’ analysis of United States Census Bureau, “Nonemployer Statistics.” See <a href=”http://www.census.gov/econ/nonemployer/”>www.census.gov/econ/nonemployer/</a>
- Our analysis of the nonemployer statistics across the entire economy suggests that some 86 percent of nonemployer “firms” are actually self-employed, unincorporated sole-proprietors—in other words, individuals earning income as independent contractors or freelancers. In the rides and rooms industries some 93 percent of the “firms” are freelancers or contractors. These are exactly the types of workers who seek part-time work in the gig economy.
- For the “rides” sector, the following NAICS codes were used (4853 Taxi and Limousine Service; 4859 Other Transit and Ground Passenger Transportation). For the “rooms” sector, the following NAICS codes were used (7211 Traveler Accommodation; 7213 Rooming and Boarding Houses).
- The San Francisco analysis focused on only the city and central county, rather than the complete metropolitan area.
- Only in six cases across the three platforms in the 50 metros did the official launch date of the platforms post-date the 2012-2014 period under examination, raising questions about whether gigs in the rides industry drove the growth effects under analysis. Uber did not launch officially until 2015 in Las Vegas, Portland, and St. Louis and has still not launched in Rochester. Lyft did not launch until 2015 in Las Vegas and Philadelphia and 2016 in New Orleans and Richmond. By contrast, Airbnb was operating in all metro areas before 2012.
- In fact, nonemployer firms in the rides industry were nearly as many in number as were payroll employees from the late-1990s (as far back as our data goes) and steadily diverged throughout the 2000s
- Payroll data for Milwaukee and Tampa have been suppressed in our source data.
The Brookings Institution is committed to quality, independence, and impact.
We are supported by a diverse array of funders. In line with our values and policies, each Brookings publication represents the sole views of its author(s).