With the 2022 midterms ushering in a divided federal government, the consensus view—at least in the media—is that Washington’s moment to enact big policy measures has now passed. The New York Times, The Washington Post, The Wall Street Journal, and others predict that disputes between a Republican-led House and Democrat-led Senate will cause federal legislative work to grind to a halt. A Politico headline said it most succinctly: “Biden’s era of big government is over.”
It’s true that a divided Congress should mean a less productive and less ambitious legislative calendar. But Washington has only begun to execute all the work created by the previous Congress—and nowhere is that more true than infrastructure policy.
Between the Infrastructure Investment and Jobs Act (IIJA) and the Inflation Reduction Act (IRA), the 117th Congress invested $1.25 trillion across the transportation, energy, water resources, and broadband sectors for the next five to 10 years. It’s now the Biden administration’s responsibility to get that historic amount of money out the door—yet the bulk of it is still sitting in federal coffers or unrealized tax credits on the federal balance sheet.
Nor will implementation outside Washington be easy. Leaders in state and local governments, utilities, and qualifying industries will confront a range of challenging economic conditions to put all that federal money to work. Significant price inflation in the construction sector, the growing cost of municipal debt, a tight labor market, and a general downturn in state and local government revenues could all limit how many projects move from planning to physical construction. Communities and companies may need to right-size their infrastructure ambitions for those volatile economic realities.
The goal of this report is to use the past year of legislative activity and economic data to prepare public officials, practitioners, and analysts for what the next few years of federal infrastructure implementation may entail. If there’s one common theme across all the data, it’s this: With so much money available across so many programs, strategic implementation is now the most urgent priority. We recommend the following three cross-cutting strategies:
- Rank major priorities. No matter the infrastructure sector or asset owner, there is a likelihood that not all “good” projects can be completed by the time the IIJA or IRA expire. Leaders must reconsider priorities and rank what matters most to constituents, customers, and the bottom line.
- Prepare for different funding scenarios based on shifting economic conditions. Even with the significant increase in federal resources, all projects will require either matching public funding (such as formula programs), private investment (such as those incentivized by tax credits), or both. With economic conditions feeling especially volatile, practitioners should consider how different amounts of state and local dollars will impact access to federal funding. Experiences in Philadelphia and Colorado—both of which adopted policies to secure funding to make federal matches—could serve as models.
- Expand the talent pipeline. The IIJA and IRA primarily fund capital investments or operations, leaving the question of where talent comes from to infrastructure owners and operators. With five to 10 years of funding increases, public and private stakeholders won’t complete their project pipeline if they don’t also address their workforce pipeline. States should make use of flexible workforce funding within the IIJA, and localities should consider new regional strategies.
The IRA is an enormous commitment to address climate change, but its policies don’t outweigh the IIJA’s more traditional spending
After years of false starts and empty promises from Congress, the IRA is the first major federal spending response to climate change. There are plenty of articles discussing the law’s market-based mechanics—our colleague Samantha Gross wrote an excellent starting point—but it’s also crucial that we assess how the IRA compares to the IIJA. Using the same methodology as our Federal Infrastructure Hub, we can see the combined reach of the two bills (you can download the full IRA dataset here).
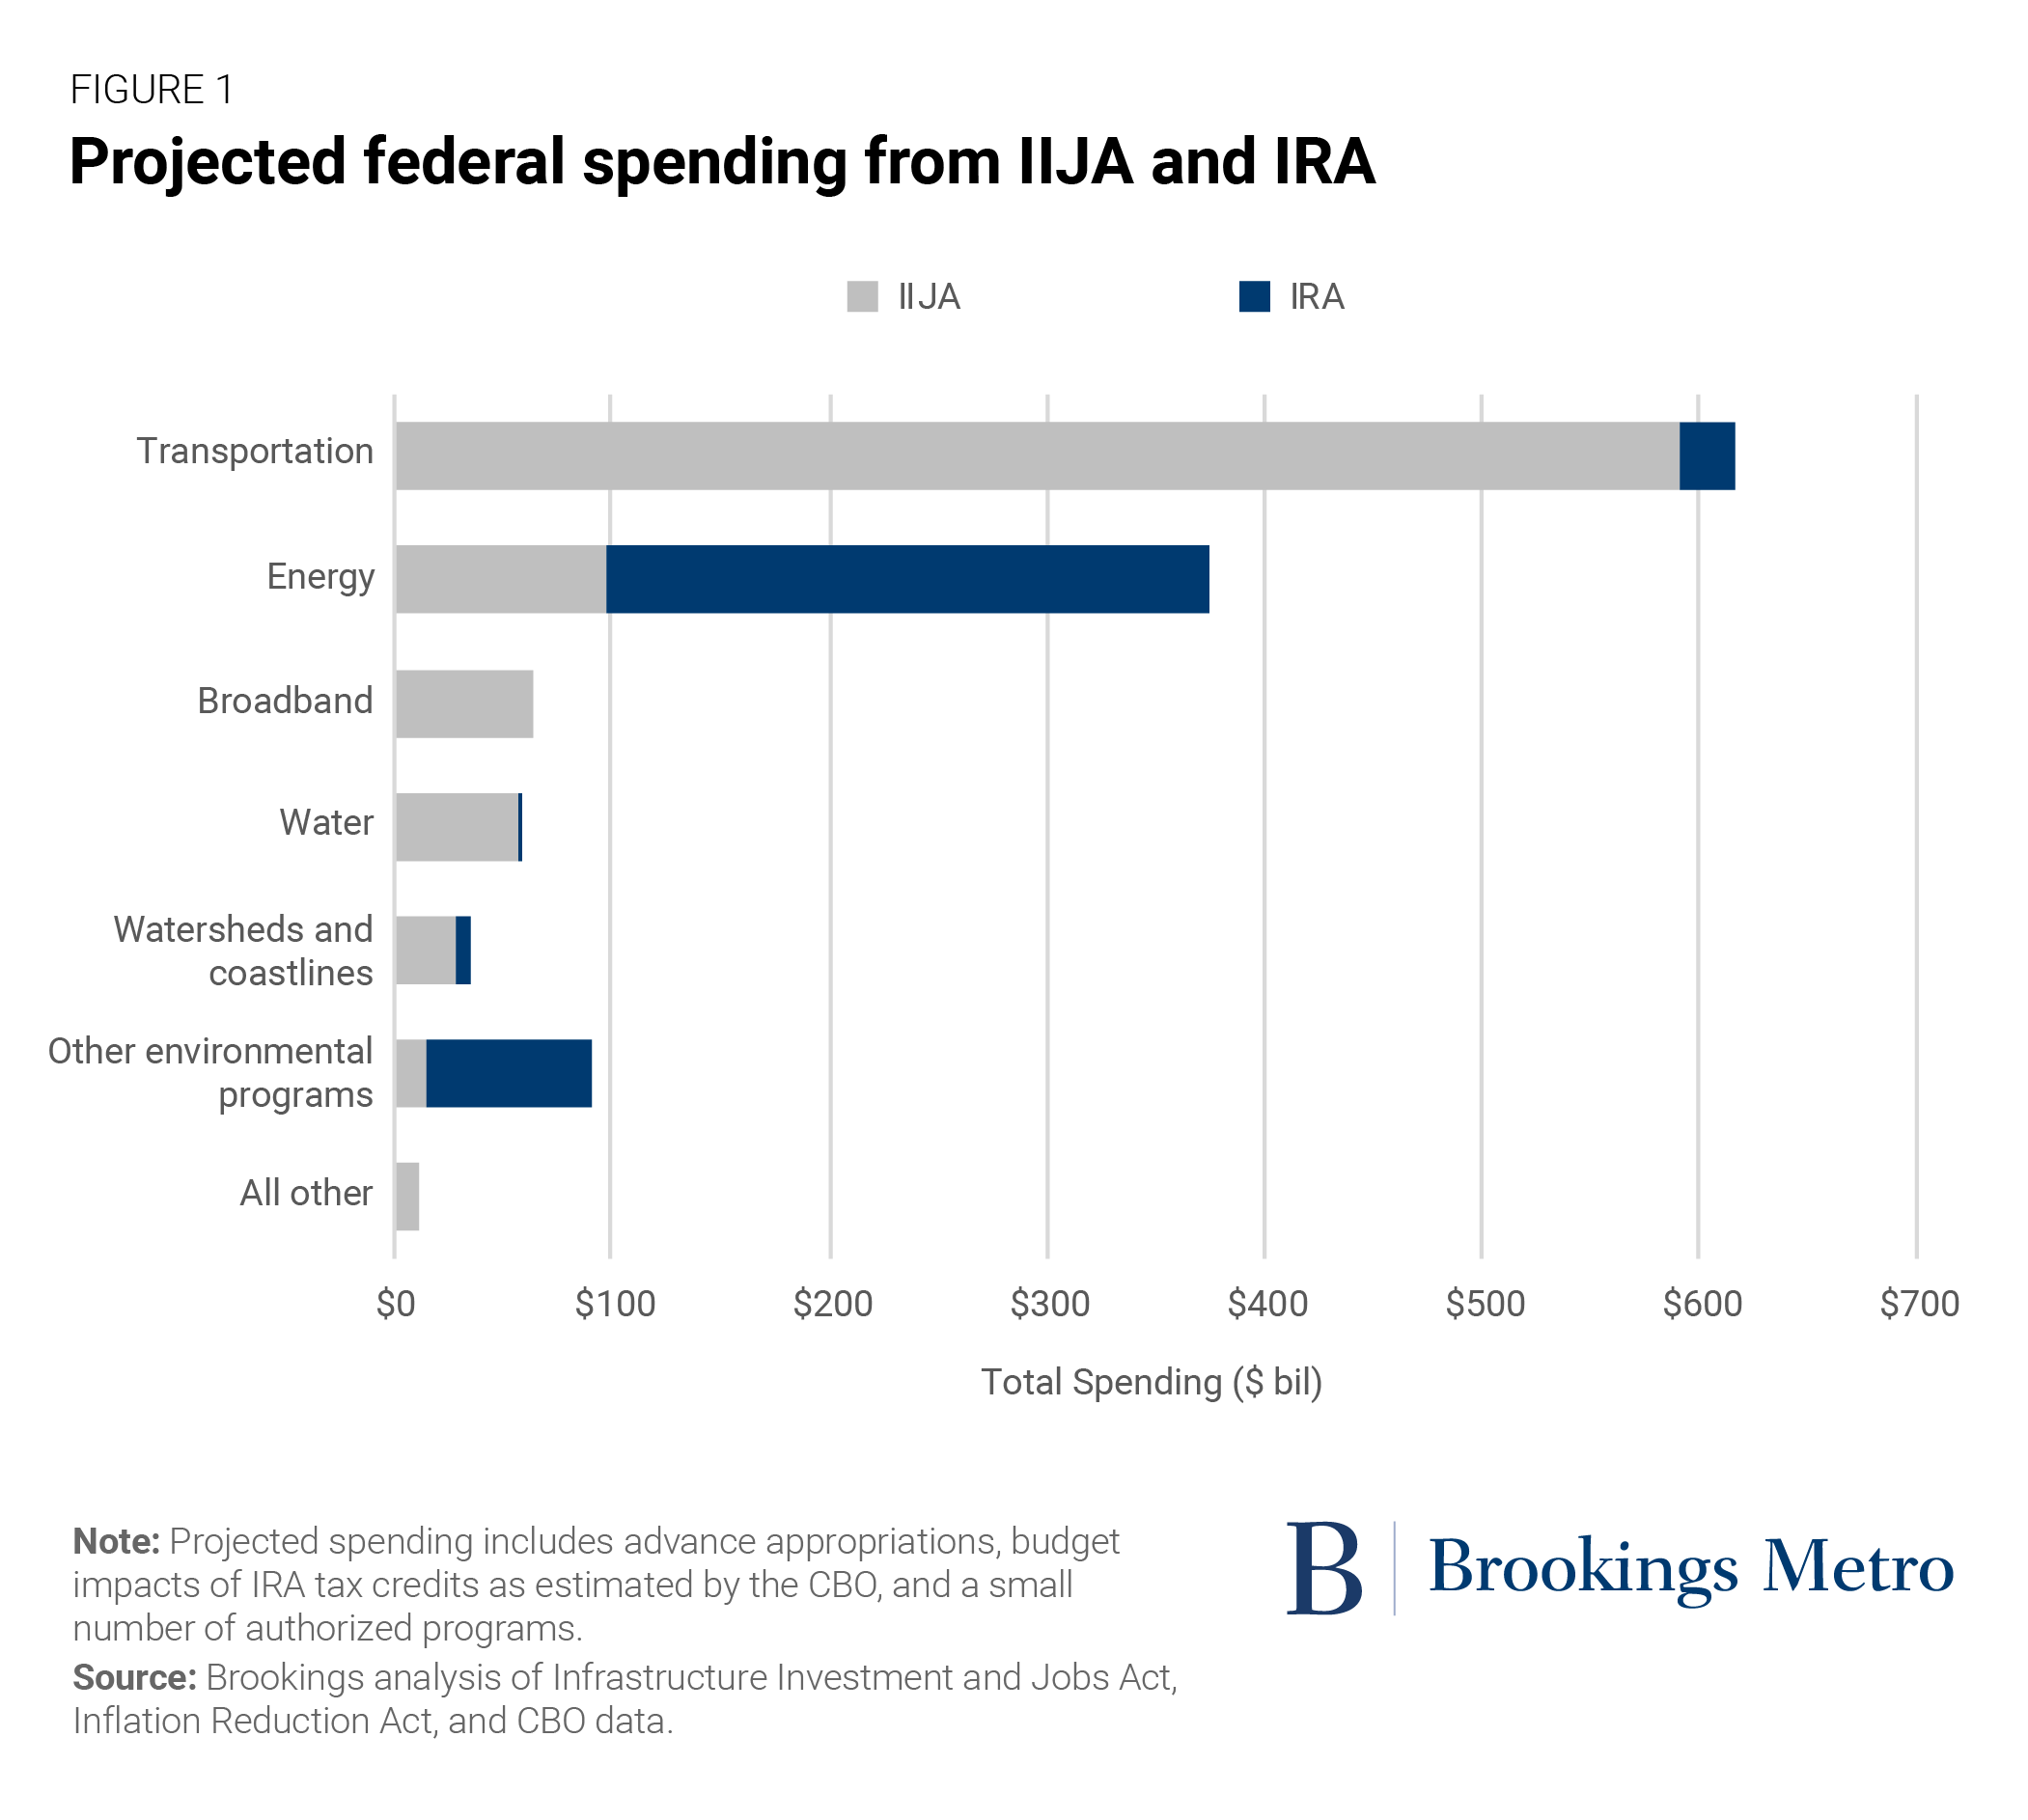
It’s no surprise that the energy sector is the IRA’s biggest beneficiary. We estimate energy-focused programs will receive $276 billion over 10 years under the law, with most funding delivered via tax credits the Congressional Budget Office (CBO) scores at $221 billion. The IRA intends to clean up our energy systems by investing across the entire value chain, including the construction of clean energy facilities and manufacturing of similar equipment ($114.5 billion); the generation of clean electricity and research into cleaner fuels ($105.5 billion); and incentivizing more energy efficiency through building retrofits ($51.4 billion).
The other major winners are environmental programs that don’t fit neatly into traditional infrastructure categories but still focus on emissions reductions or environmental resilience. The largest example is the $27 billion appropriated to the Environmental Protection Agency (EPA) to launch a Greenhouse Gas Reduction Fund, which includes two financing pots and a competitive grant program that intend to catalyze investments in qualifying emissions-reduction technologies. In total, we count 62 IRA funding streams in this “other environmental” bucket, including a new $3 billion block grant program to advance environmental justice and $5 billion to established forestry programs. By the standards of typical federal spending, these are significant amounts.
The IRA’s singular focus on climate outcomes also establishes an interesting contrast between energy spending and transportation spending across the two bills. Both the IRA and IIJA invest almost exclusively in energy programs that intend to reduce greenhouse gas emissions. And since the private sector owns most energy generation, transmission, and distribution facilities, the federal government primarily uses tax credits and loans to catalyze private investment in cleaner assets.
The bulk of the transportation program, however, is more climate agnostic. Most spending is on roads, and thus continues to incentivize driving—particularly the $240 billion Federal-Aid Highway Program and a $27 billion formula program for bridges. Both programs give states and some localities wide latitude to determine how they invest in highways and local-serving roads. While there’s plenty of flexibility for state officials and other key decisionmakers to be more climate-friendly, it’s not required—the federal government effectively devolved the responsibility to determine how green the country’s transportation networks will be.
States hold most of the spending power and discretion for IIJA awards
The IIJA marked its one-year anniversary this past November, and White House data offers a look at the first year of awarded funding. For several reasons, the law’s first year represents a low point in terms of expected annual spending. For example, funding recipients have had to update their capital spending plans to new, much higher funding levels and write rules for the many new federal programs. Still, the initial tranche of awards confirms just how much power Congress gave to the states and other major formula grant recipients (see Figure 2).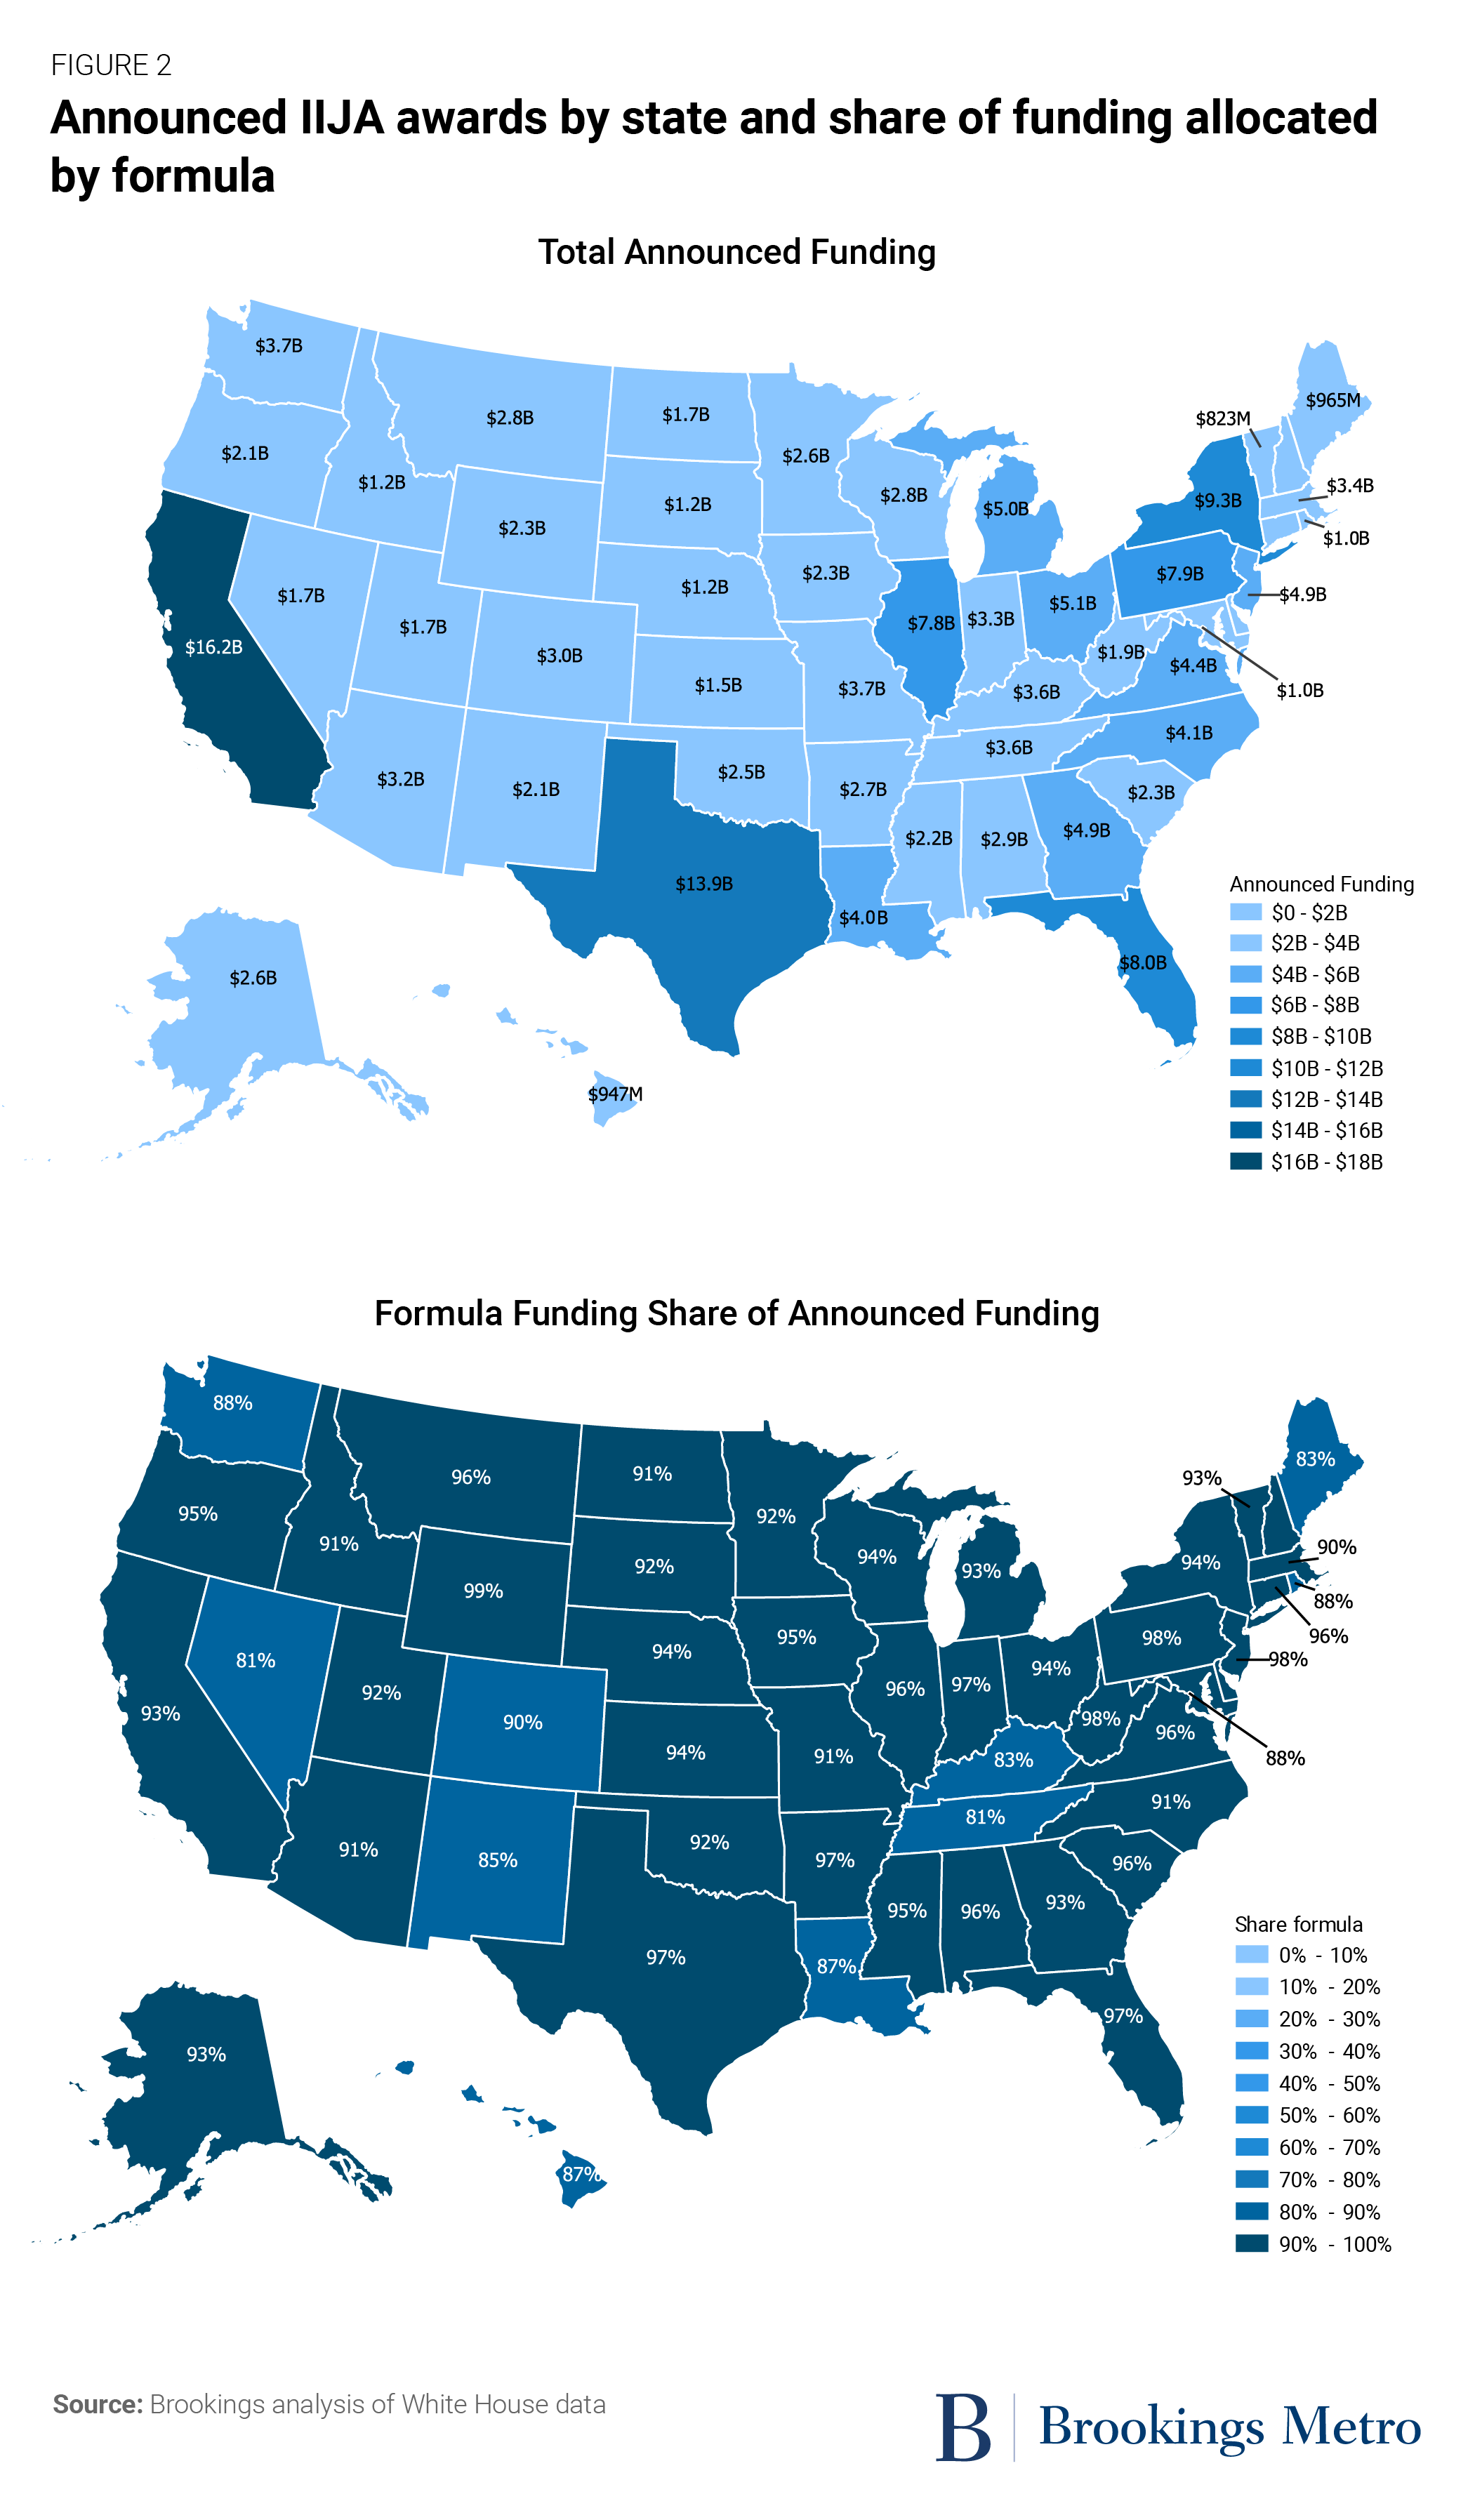
Overall, formula programs received 92% of the IIJA’s first-year awards when measured by total funding awarded by federal agencies. This pattern was universal, with every state seeing more than 80% of total awards distributed via formula programs. The primary beneficiaries of these formula programs are state governments, which directly receive these funds through Federal Highway Administration programs and the EPA. State-controlled funding will only grow as the $42.5 billion Broadband Equity, Access, and Deployment (BEAD) formula funding starts to move.
This is not to say competitive grants aren’t sizable or important. Major awards such as Norfolk, Va.’s $250 million floodwall, $197 million toward a new St. Louis-area battery components plant, and $105 million to reconnect Detroit around I-375 are all significant projects that can influence economic activity and environmental performance in their regions for decades to come. Competitive grants are also attractive for cities, counties, and other local governments who prize direct access to federal funding, without the need for allocations from their states. And there’s plenty more of the competitive money coming; by October 2022, only 7% of competitive funding had been awarded.
Still, the fundamentals are irrefutable: If local practitioners want to maximize their chances to receive federal infrastructure funds, state officials are their most important partners. State officials control larger pots of funding and may not require detailed applications to access that funding; by contrast, federal competitive programs are typically smaller and over-subscribed. State funding received by federal formula can also serve as matching funds when localities need to qualify for federal competitive funds. With state capital budgets still adjusting to the IIJA’s increased funding levels, now is the time for local leaders to build strong ties with their counterparts in state capitals.
Economic headwinds are driving up project and borrowing costs while driving down buying power
It took decades for Congress to deliver a comprehensive infrastructure bill and a robust response to climate change. Yet in a twist of fate, both landed during one of the most unusual macroeconomic environments in recent history, with historically low unemployment combined with high inflation. Now, all levels of government and the private sector must confront a set of industrial, fiscal, and labor market challenges that threaten the impact of the new laws.
First, the construction sector is dealing with eye-popping price inflation, especially for input goods. Two infrastructure-specific commodity indexes within the Producer Price Index (PPI)—which count material inputs in the roadway industry and the energy and communications industries—are both up about 25% from January 2021 to December 2022. That’s nearly double the growth in the Consumer Price Index (13.7%) over the same period. And much like households facing rising grocery and home heating bills, infrastructure-related construction companies can’t easily dodge higher costs like those measured in this index. Instead, whether pushed by more expensive commodities, higher wages, or other factors, projects will cost more. Higher-priced projects thus threaten to devour—or significantly offset—the intended impact of the major funding increases Congress approved in these new laws.
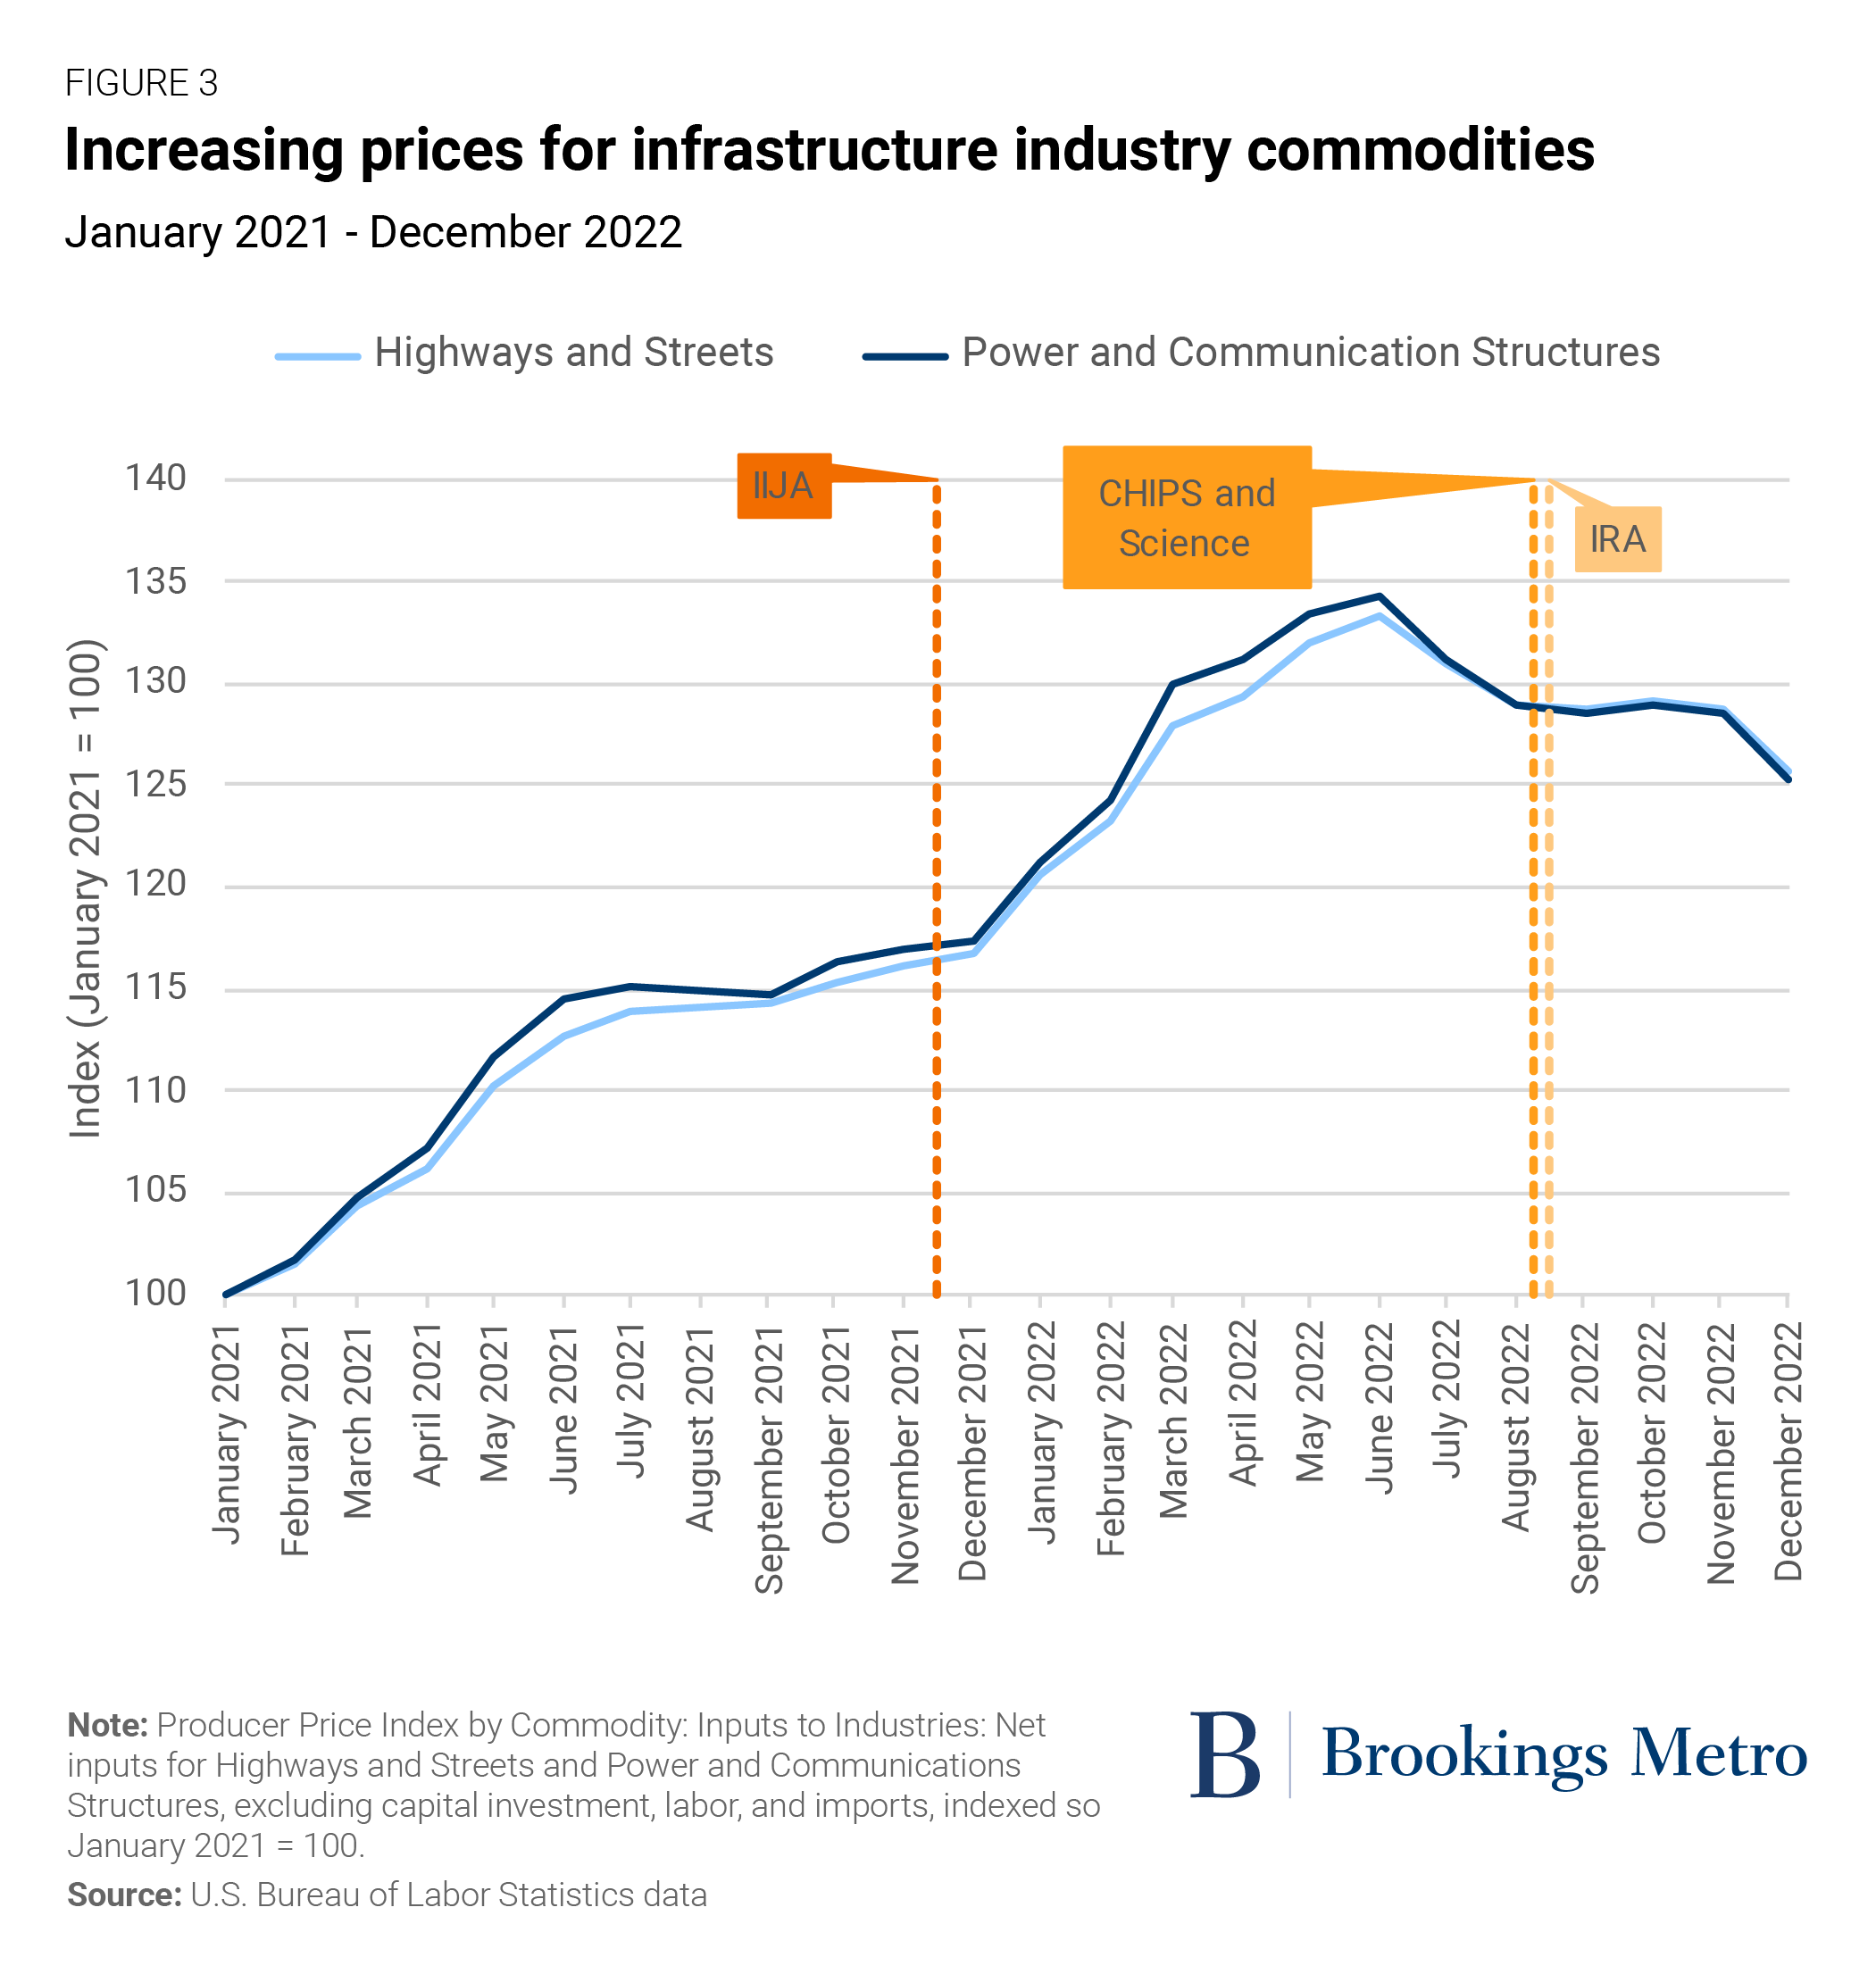
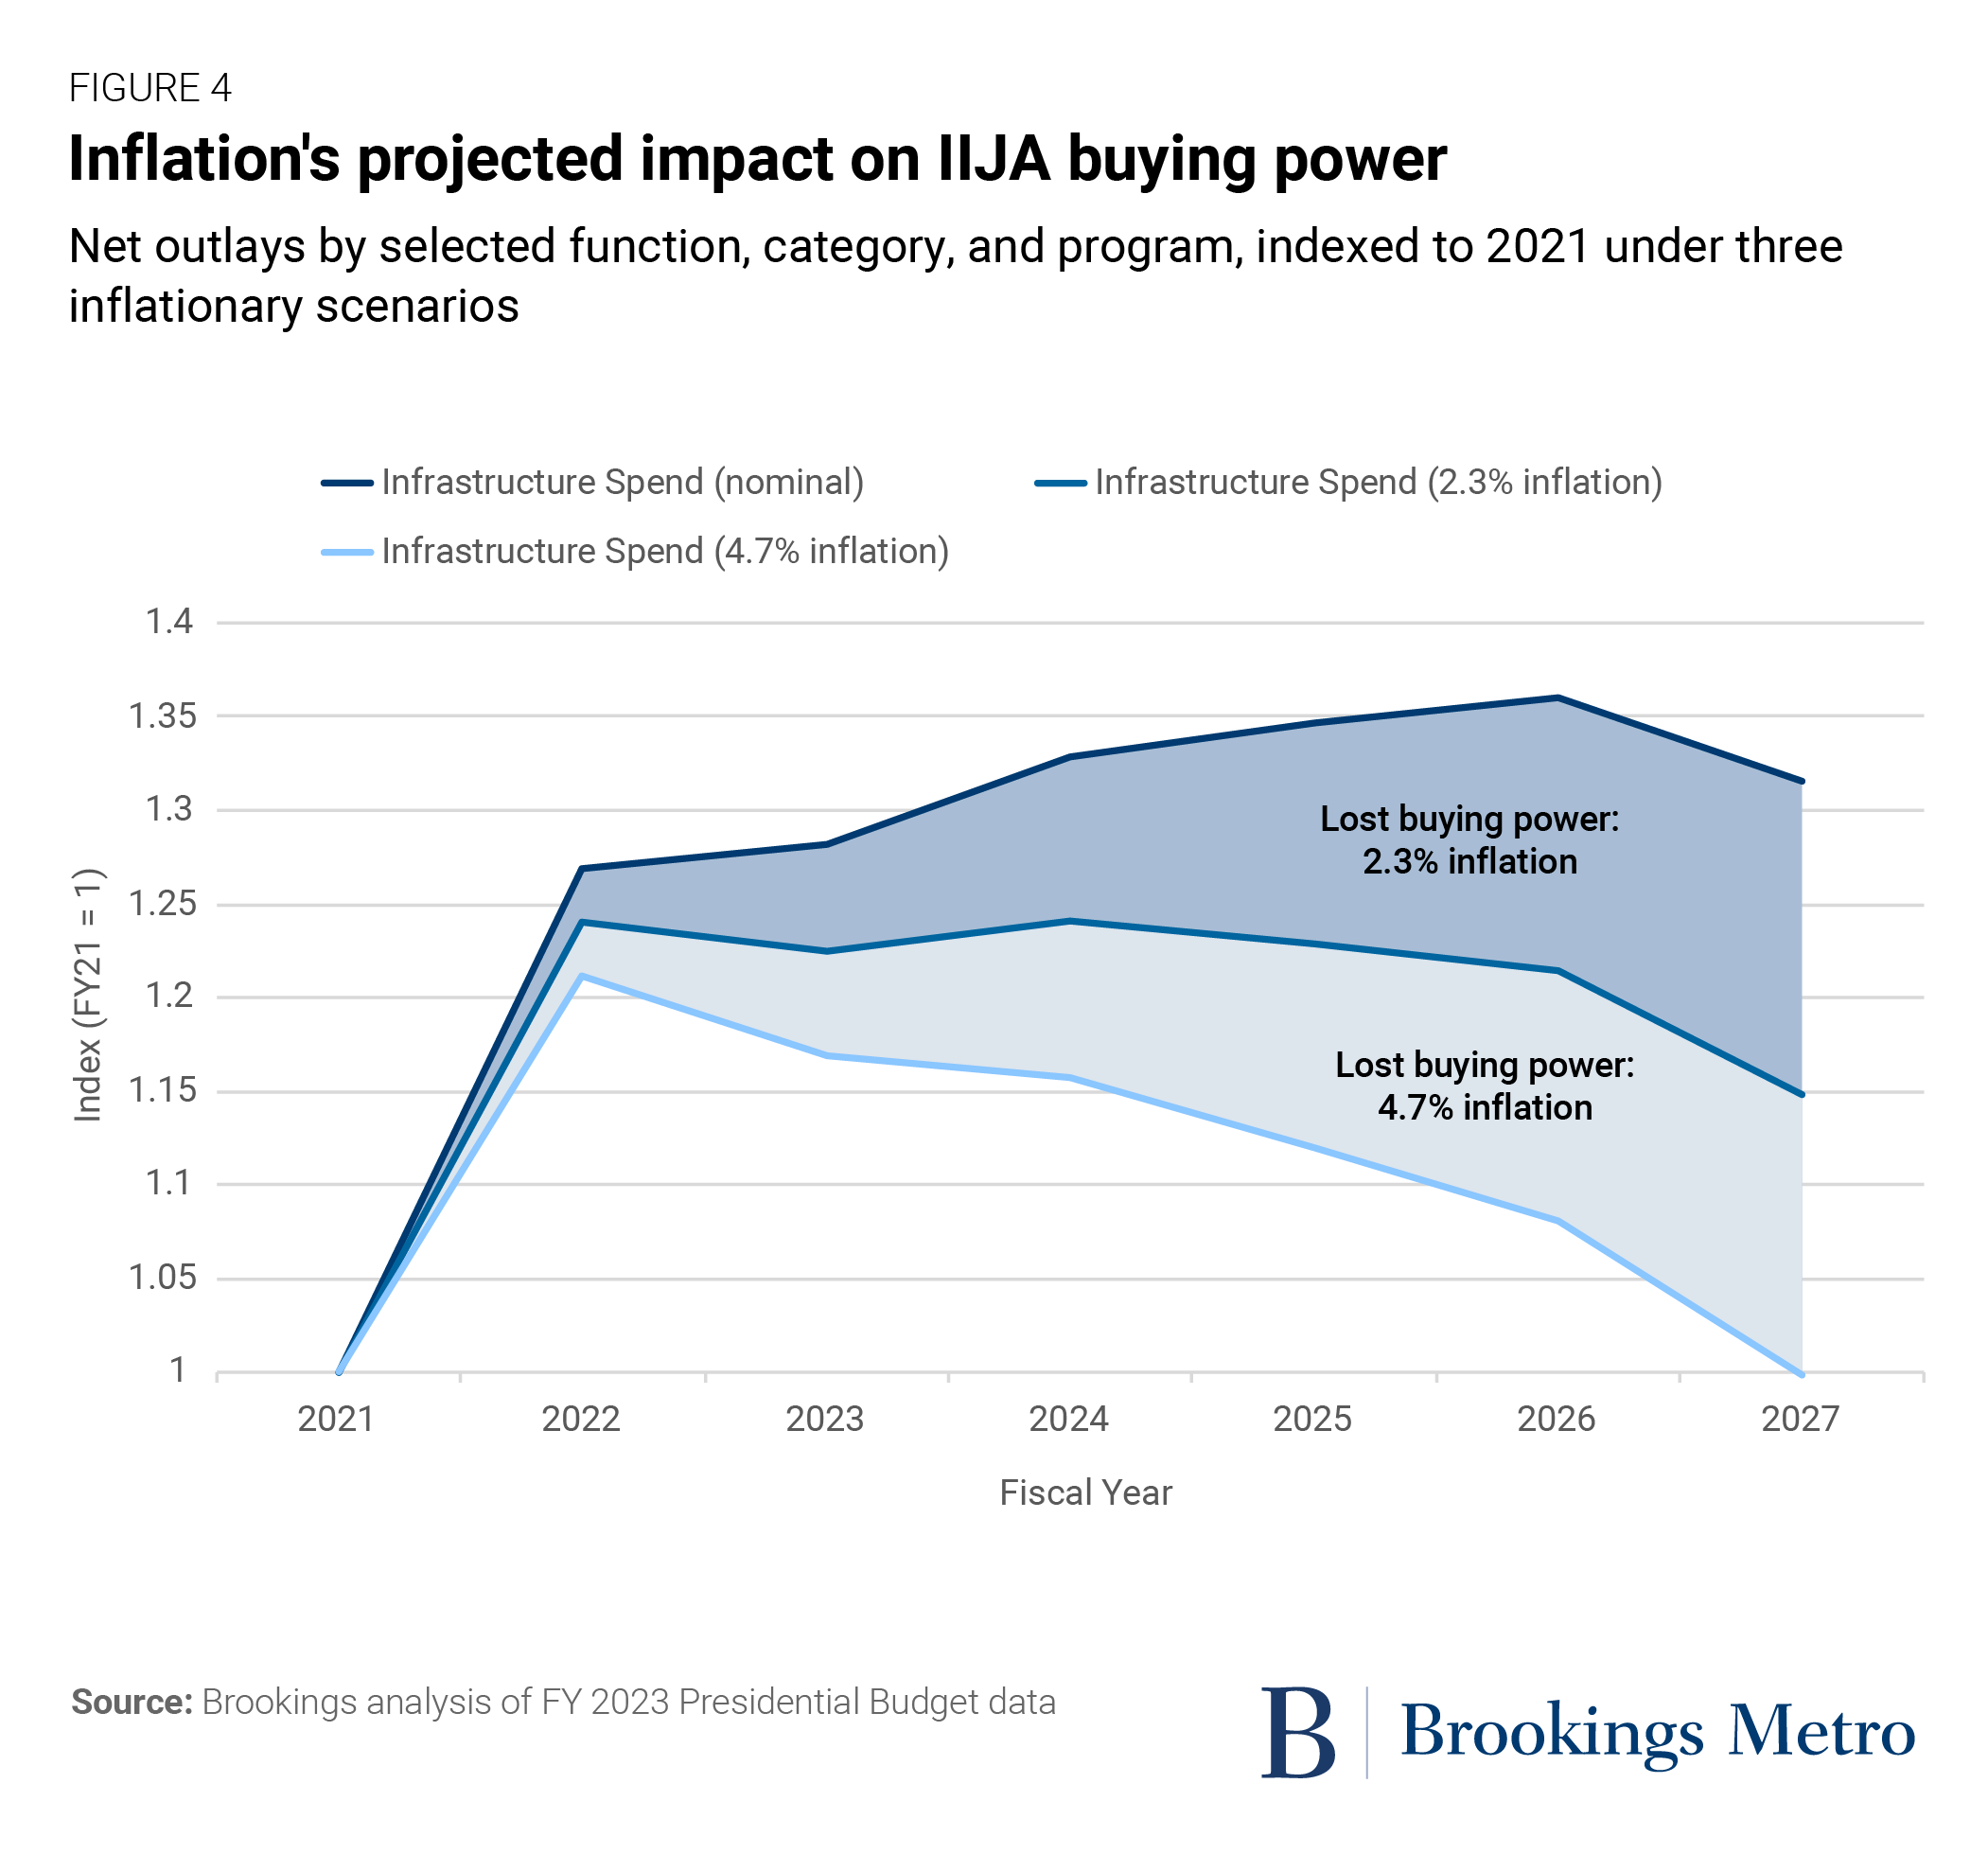
Figure 4 shows the potential impacts of sustained inflation. Inspired by a transportation-focused analysis by our colleague Jeff Davis and using data from the FY 2023 President’s Budget, we charted how varying inflation levels could chip away at the output effects of federal infrastructure spending. If inflation was 2.3% higher each year than expected, it would effectively cause infrastructure industries to lose $137 billion in estimated buying power via federal spending. If inflation persisted at 4.7% each year, the federal government would effectively be spending as much on infrastructure in 2027 as it did in 2021 in constant dollars—hardly the massive leap Congress intended.
We’re encouraged by recent drops in overall goods prices, but indexes like the PPI need to keep trending in the right direction over a sustained period for everyone to breathe easier.
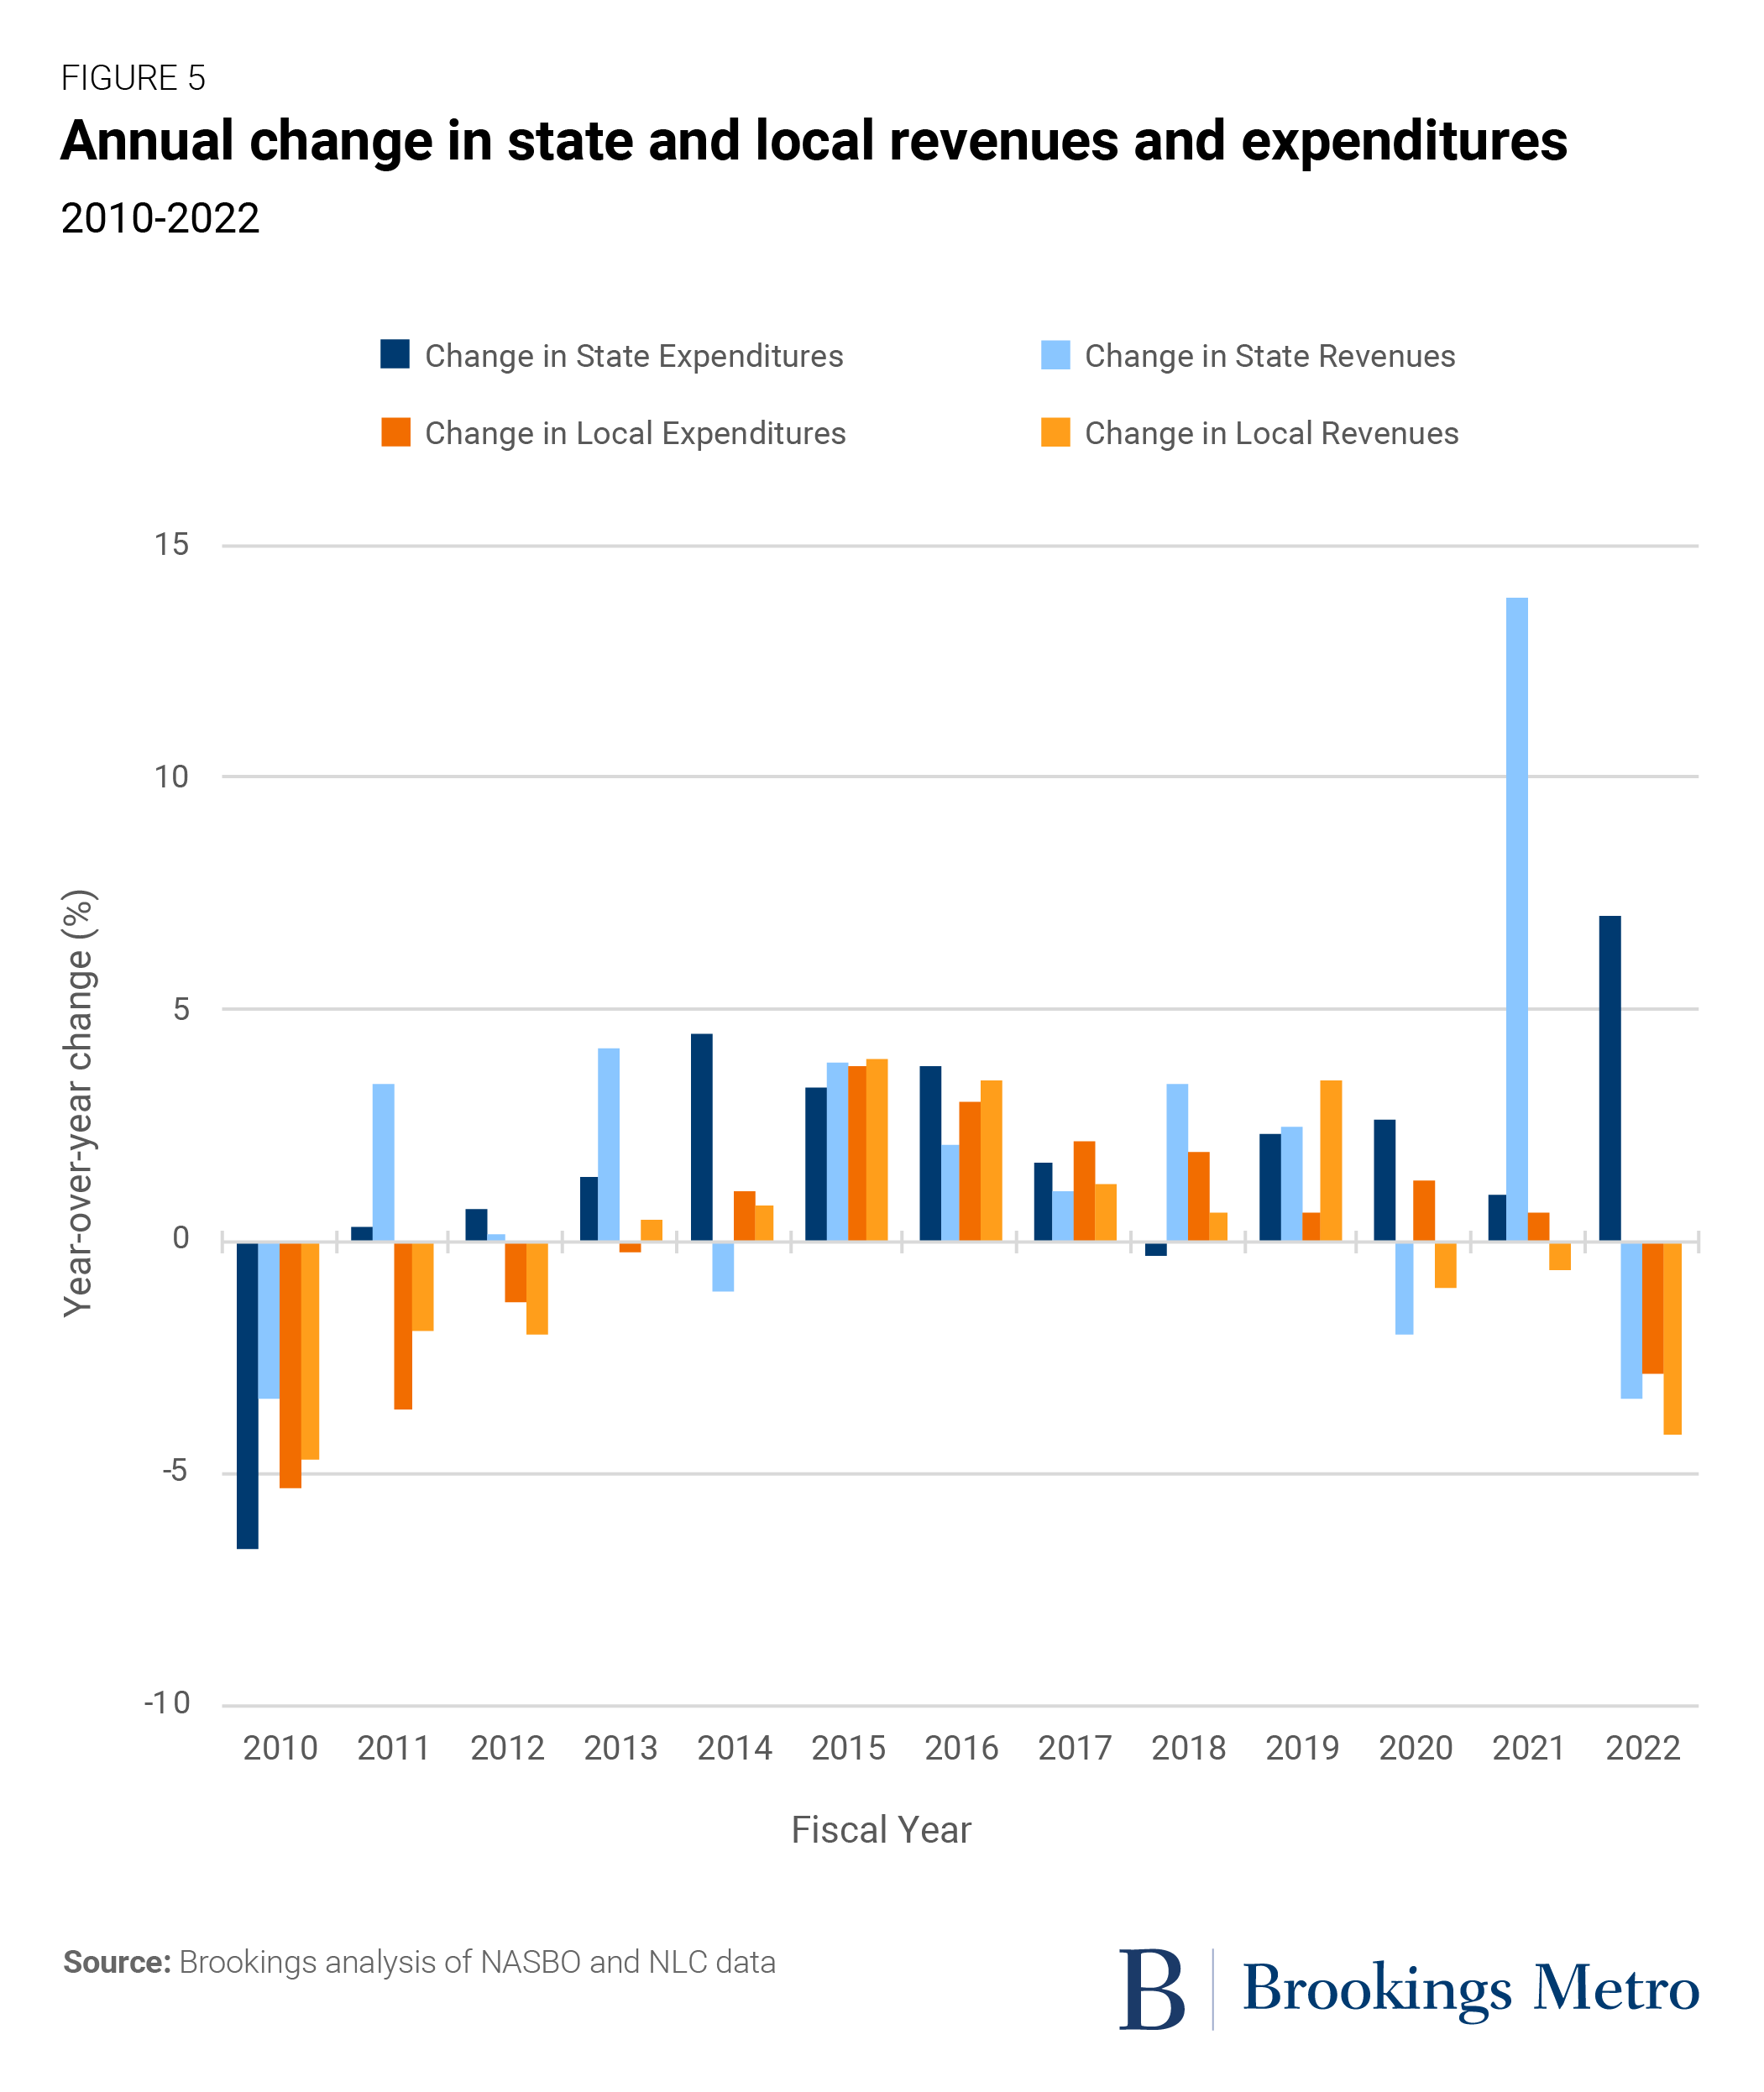
In addition, state and local revenues are trending downward (Figure 5). While the fiscal tsunami feared during 2020 and 2021 never appeared—in no small part due to large federal fiscal infusions under the CARES Act and American Rescue Plan Act—data now shows that state and local revenues are trending down more in 2022 than in any year since 2010. If the revenue drops are more than a reflection of the loss of those nonrecurring federal infusions, it could portend future service cuts or other tough fiscal decisions, such as reducing education budgets or cutting transit service. And because most federal programs require anywhere from a 10% to 51% local match, the revenue drop could leave states and localities with less cash available to access “free” federal funds.
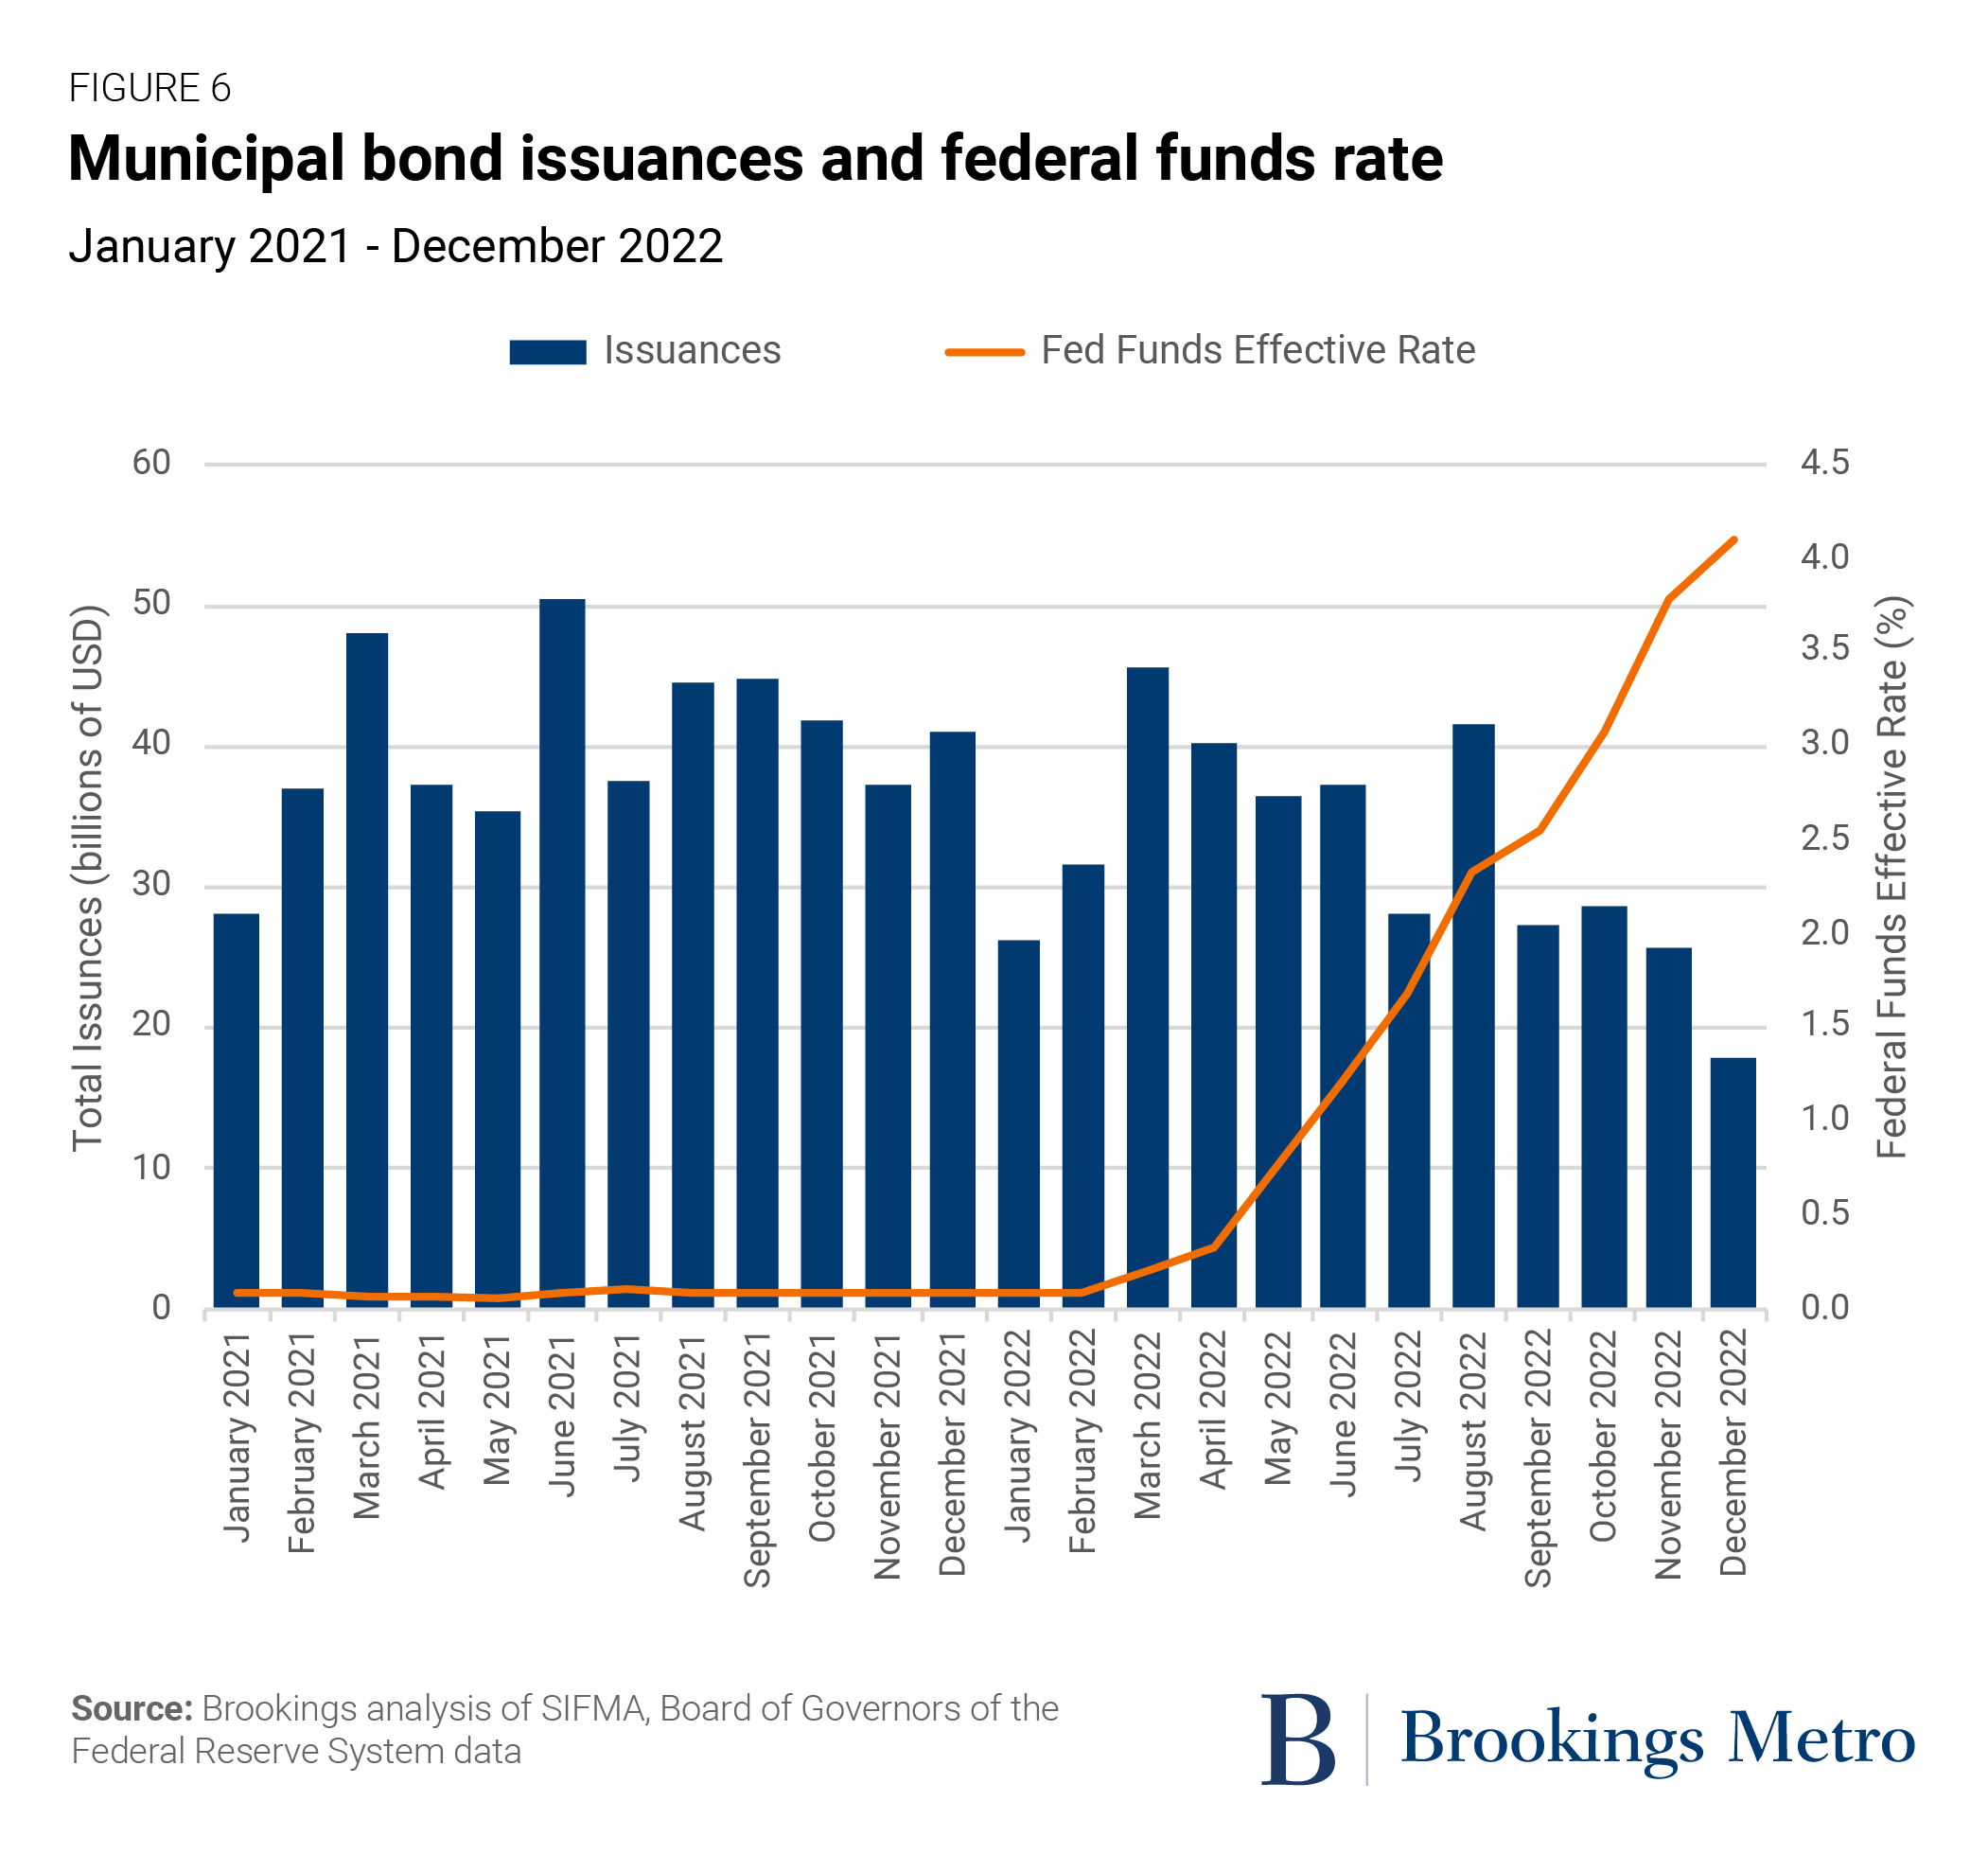
Meanwhile, higher interest rates are making debt—a major source of infrastructure investment—more expensive, restricting one path to adjusting for higher project costs and sagging public revenues. The basics are simple: As the Federal Reserve raises the federal funds rate to respond to inflation, borrowing costs rise for entities issuing almost all kinds of debt, including bonds to finance infrastructure. Local, state, and other entities qualified to issue municipal debt fall into this category, and data and reporting show a downward trajectory on the volume of municipal debt issuances (Figure 6). It’s the same issue for private energy utilities or owners of broadband infrastructure. Budget leads, financiers, and investors are well aware of these changes, but other stakeholders must also adjust their expectations.
Finally, among the key economic challenges, there’s a tight labor market and missing talent pipeline of new workers—including the hundreds of thousands of people needed to replace those expected to leave the infrastructure workforce.
There isn’t a ready supply of qualified workers to handle a major increase in infrastructure projects. The last time the federal government infused significant spending into the infrastructure sector was during the Great Recession, but for straightforward reasons, the housing crisis had left many skilled laborers in search of work. At the time, this was touted as one of the main reasons to invest significantly in transportation and other infrastructure—project costs came in below estimates, making public dollars go even farther.
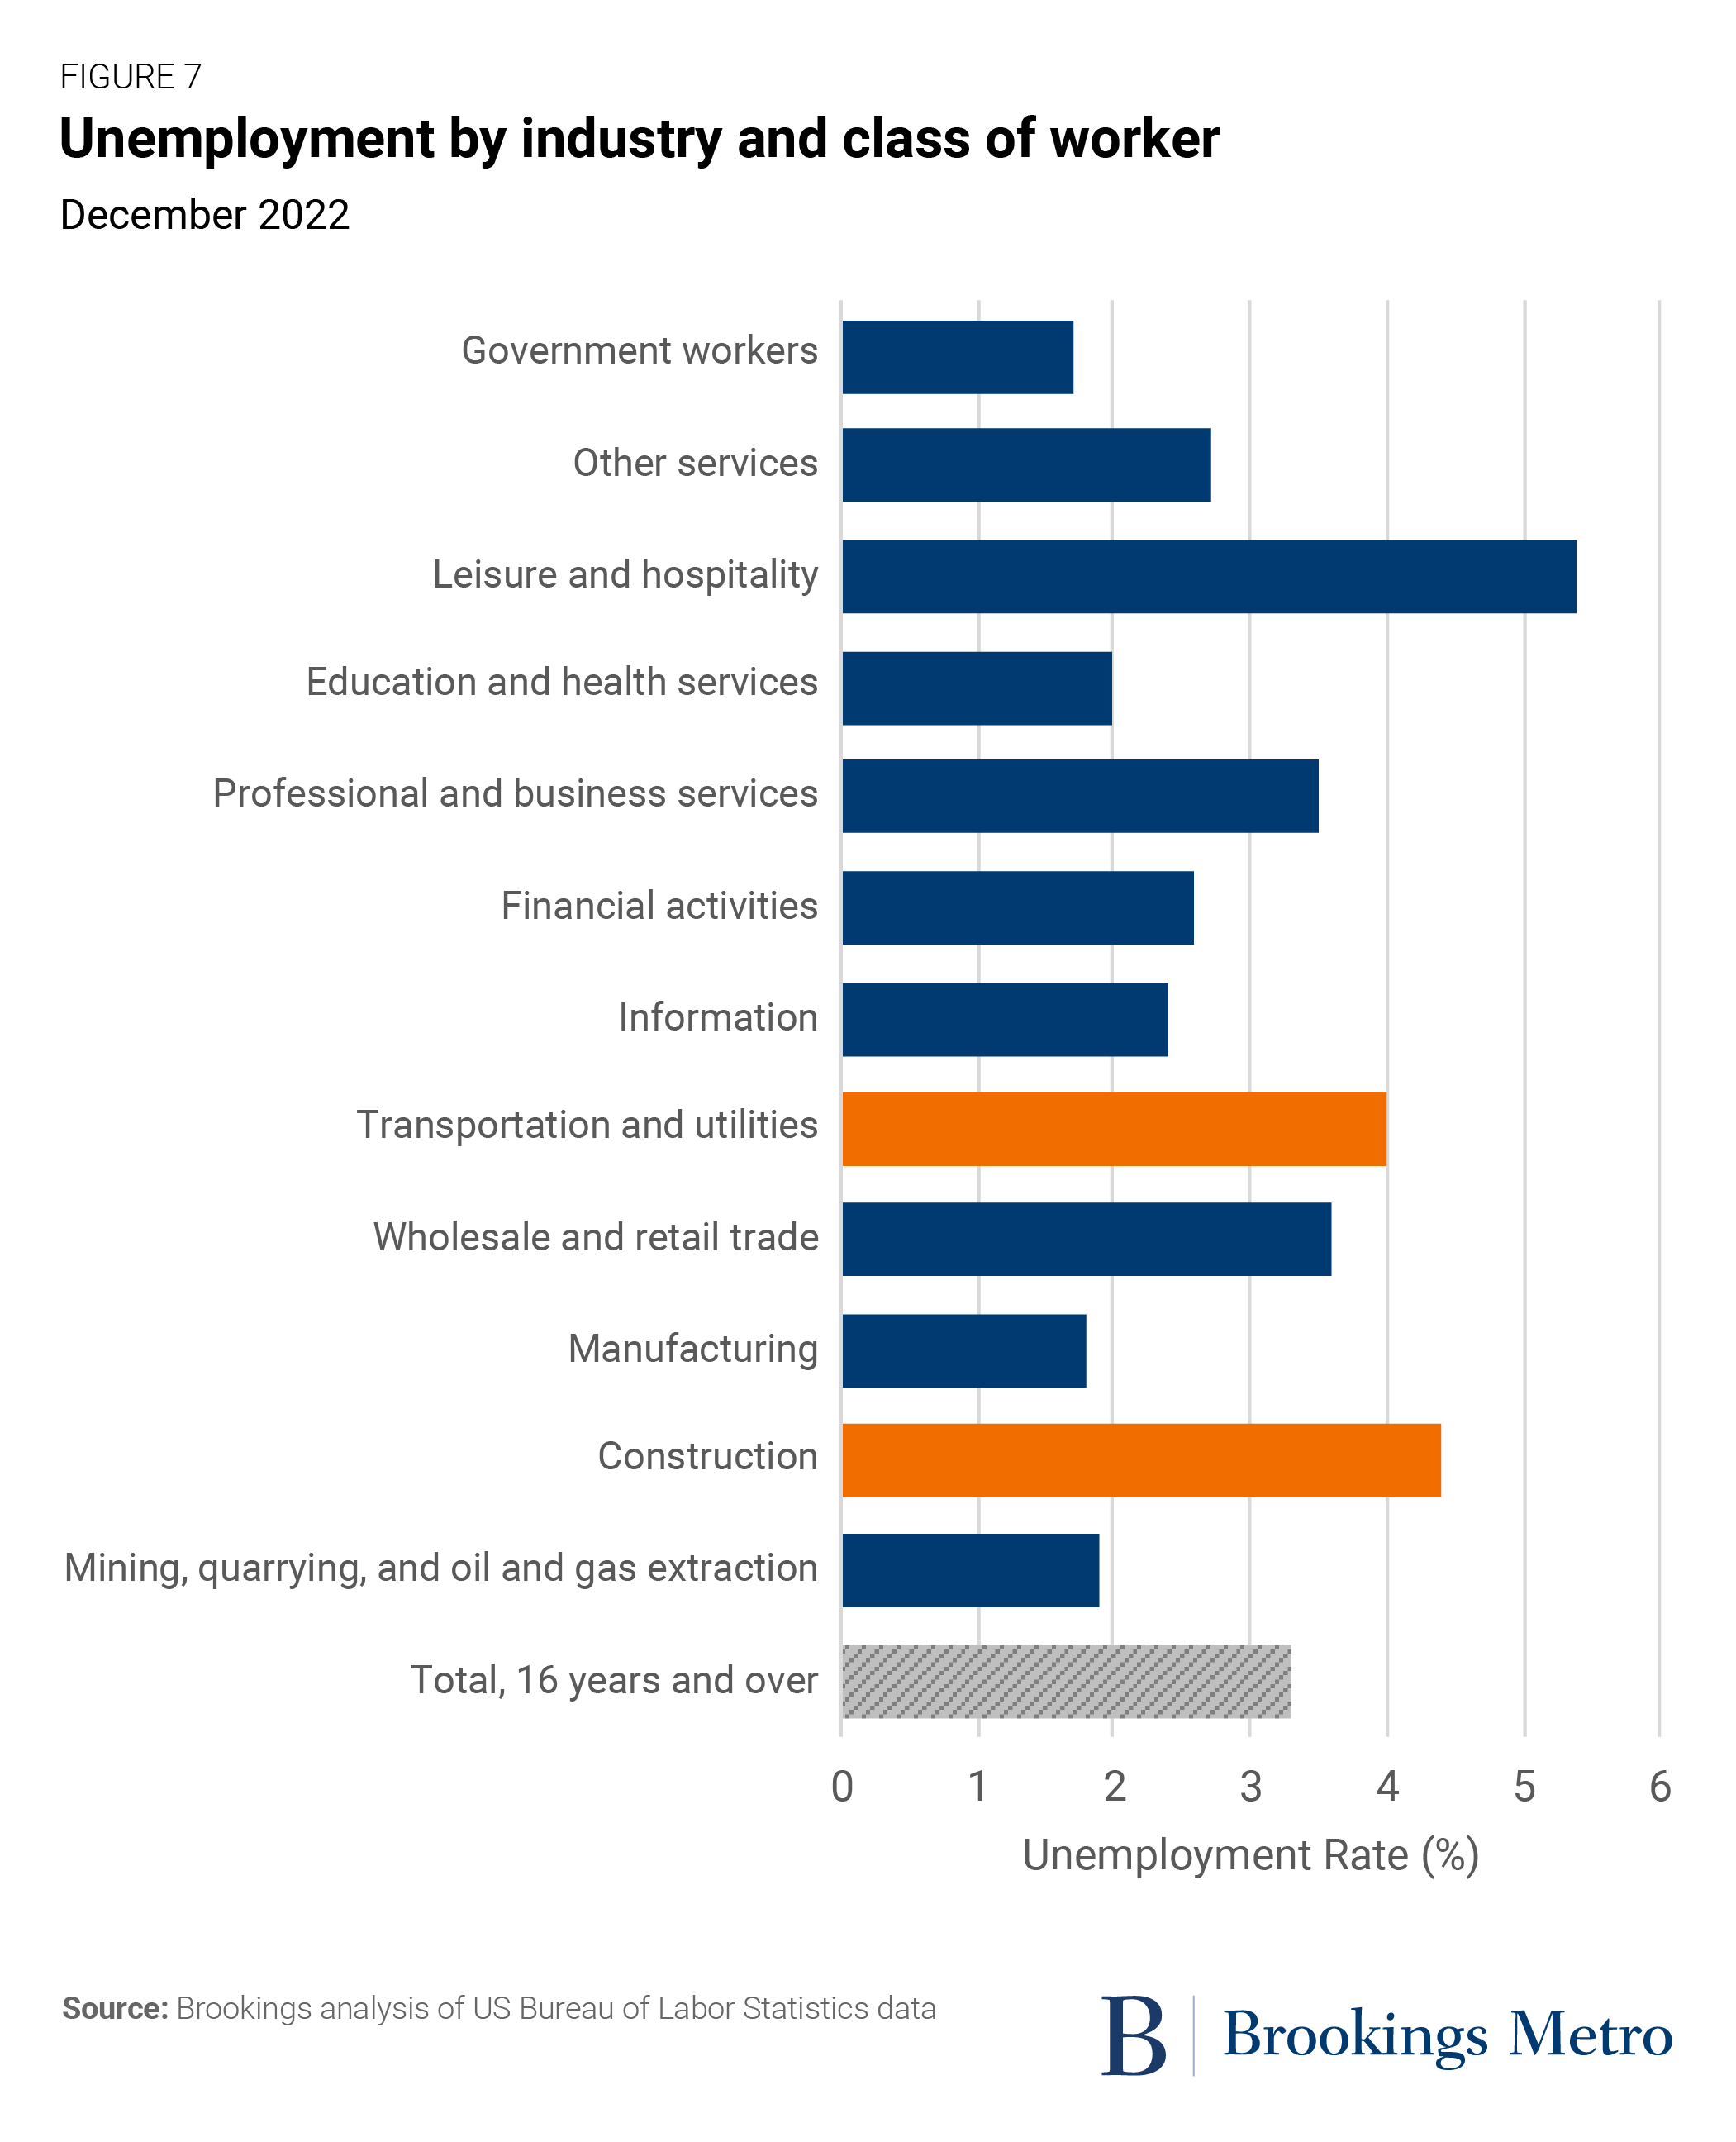
Unfortunately, that’s not the case today. As Figure 7 shows, in November 2022, unemployment in both the construction and the transportation/utilities sector was low by historic standards (4.4% and 4%, respectively). With retirements and other job separations happening faster than new infrastructure workers can be found—and the overall unemployment rate also low—a labor shortage could derail states, localities, and other infrastructure employers’ plans.
What comes next at the state and local level
As IIJA and IRA implementation move into full swing, the responsibility falls to governors, mayors, and other state and local practitioners to leverage all this federal funding at a time of economic uncertainty. The law purposely gives each state, locality, and private infrastructure owner considerable latitude to decide what projects they want to pursue, how they will design and construct those projects, and who will execute the work. Even if construction projects take years to complete—and the laws’ impacts take years to study—many of the most critical what, how, and who decisions will be made this year.
As implementers finalize their plans for the coming years, the findings in this report point to three high-level implementation strategies that can apply across all infrastructure sectors:
First, government practitioners should rank their major priorities. The combination of economic headwinds, limited budgets, and boundless demand for new infrastructure projects means not every project will get off the ground. So, infrastructure owners and operators need to be ready to make tough decisions about what projects to pursue.
That process starts with being realistic about a community’s long-term goals for growing its economy, making sure outcomes are more inclusive, and protecting the natural and built environment. Leaders should not simply look at old capital budgets and blindly greenlight long-standing ideas, like a multibillion-dollar project to add highway lanes between exurban Kansas City, Mo. and exurban St. Louis. Just because previous officials prioritized something doesn’t mean current leaders should pursue it. Instead, they should consider the evidence showing what economic competitiveness will require in the future—helping small businesses grow locally; attracting and developing young talent; boosting public health for the most vulnerable; making families, companies, and community services more resilient to climate change—and prioritize projects that advance those goals.
Those prioritizations shouldn’t made in a vacuum. Empowered officials should find ways to understand what local communities want their future to look like and include that vision in any project rankings. Similarly, understanding where real estate developers, energy utilities, and telecommunications owners plan to invest should also shape public investment decisions.
Second, government practitioners should prepare for different funding scenarios based on shifting economic conditions. With over $1.25 trillion in federal grants, loans, and tax credits now available, state and local officials should treat the next five to 10 years as the best moment they’ll ever have to use federal cash to reduce the costs of construction and related projects. However, federal dollars are only accessible with matching state and local dollars. And the more projects a government wants to build, the bigger the matching pot must be.
Economic headwinds further complicate the financial picture. As materials costs go up, workers demand higher wages, and public debt gets more expensive, the required amount of matching funds rises. Likewise, as state and local revenues potentially shrink, leaders will have to ask themselves tough questions; they may look to use federal infrastructure dollars as a replacement for state and local infrastructure spending to ensure that systems such as education or public safety can avoid layoffs and service cuts.
To complete as many highly ranked projects as possible, state and local officials should secure the total amount of funds they think will be necessary and protect those funds from competing spending pressures. Estimating total needs is an important first step, which includes working with budget directors to run scenarios tailored to this unique moment of large federal funding opportunities and wider economic uncertainty. Philadelphia Mayor Jim Kenney did this in his city’s FY 2023 capital plan, which now includes a $60 million set-aside for federal matching.
Officials should also explore strategies to secure necessary own-source funding without creating inflexible long-term fiscal structures. One option is issuing new debt and limiting the funds to qualifying sectors, like many of the $66 billion in voter-approved bond referenda passed in 2022. Another option is creating a temporary “lockbox”—already popular for state transportation systems—that sunsets when IIJA or IRA obligations end. And states could create their own funds to support local efforts, like in Colorado.
Third, a mix of government officials, private infrastructure companies, and workforce development actors must work together to expand the talent pipeline. While the Biden administration has spent two years talking about the importance of workforce development within infrastructure industries, the reality is that Congress mostly left state and local infrastructure owners and operators to solve talent issues on their own.
There’s no shortage of issues, either. The workforce challenge facing infrastructure employers such as transportation departments and water utilities is two-fold. First, they cannot find enough new talent—particularly younger workers, who may not know these careers exist or lack flexible training pathways to enter them. (Workers under the age of 24 represent only 11% of the country’s infrastructure workforce.) Second, employers are struggling to hold onto existing talent; projections show that 1.7 million infrastructure workers will either retire or permanently leave their jobs each year on average over the next decade. With 16.6 million infrastructure workers employed nationally, that means the entire workforce will essentially turn over in the next 10 years, leading to huge knowledge and retention—and potentially productivity—gaps.
To maximize the impact of expanded federal infrastructure funding, state and local leaders must shift from short-term, business-as-usual approaches and instead focus on longer-term strategies to enhance opportunities for workers and meet employer demands. That means planning and addressing workforce needs over time, rather than lunging at pots of money to complete individual projects in the short term. Both infrastructure and workforce leaders must find ways to utilize the flexibility of federal funding and invest in worker training and retention. These efforts also need to involve community outreach, support services, reskilling, and more. Innovations already underway in Massachusetts, Wisconsin, and Colorado are beginning to do just that, including new mentorship programs, training programs, and sector partnerships around clean energy careers.
Conclusion
When it comes to infrastructure, the era of big government isn’t over—it’s just getting started.
Most of the $1.25 trillion in infrastructure spending approved by Congress and signed into law by President Biden is still sitting in the federal government’s bank account, waiting to strengthen and modernize the country’s economy and communities. Yet even at this early stage, governments and their industry partners have precious little time to get their infrastructure plans in place. And achieving their goals won’t be easy—any one of multiple challenging economic conditions could limit the number of projects that get completed.
President Biden has framed the next 10 years as America’s “infrastructure decade.” The chances of it being remembered that way may well be decided in the coming year, and there’s no time to lose.
The authors would like to thank J.R. Reed for excellent research assistance throughout this piece.
Authors


The Brookings Institution is committed to quality, independence, and impact.
We are supported by a diverse array of funders. In line with our values and policies, each Brookings publication represents the sole views of its author(s).