

Part I of the 2013 Brown Center Report on American Education
 In December 2012, the latest international test scores were released. The Trends in International Math and Science Study (TIMSS) is given every four years, and the Progress in International Reading Literacy Study (PIRLS) is given every five years. The latest results came from the 2011 administration of both tests, a unique event. Because of their asynchronous schedules, the two tests share the same year only once every twenty years. Forty-nine nations and nine benchmarking participants took part in PIRLS, which is given at fourth grade, and 63 nations and 14 benchmarking participants took part in TIMSS, which is given at both fourth and eighth grades.1
U.S. National Achievement
The U.S. did reasonably well in all three subjects—reading, math, and science. In reading, the U.S. scored 556 on the international scale. All of the tests discussed in this section have a mean of 500 and a standard deviation of 100. Only four countries scored statistically significantly higher on the reading test. (In the discussion below, the term “significant” is used as shorthand for statistical significance at p less than .05). Hong Kong led the world at 571, followed by the Russian Federation (568), Finland (568), and Singapore (567). The U.S. score for 2011 represented a 14-point gain since 2001 (significant).
In math, U.S. fourth graders scored 541, near the middle of second-tier countries on TIMSS. The top-tier countries were five Asian nations: Singapore (606), Korea (605), Hong Kong (602), Chinese Taipei (591), and Japan (585). The U.S. fourth-graders’ score represents a 23-point gain since 1995 (significant). Eighth graders in the U.S. scored 509, which is significantly higher than the 500 international average—but just barely. The 509 score is a 17-point improvement over the 1995 U.S. score (a significant gain).
In science, U.S. fourth graders scored 544, with six countries scoring at significantly higher levels. The fourth-grade gain of 2 points since 1995 is not statistically significant. Eighth graders scored 525, significantly above the international average and significantly below students from eight other nations. The 12-point gain since 1995 is statistically significant.
To sum up, the latest international scores are mostly positive for the U.S. American students scored above the international average on all five assessments of grade-subject pairings. For four out of the five tests, the gains since 1995 are statistically significant. Despite these encouraging results, there is much room for improvement. Over the past decade, countries joining TIMSS have been economically developing nations or, in the case of the Middle East, nations possessing abundant national wealth but lacking a tradition of public schooling. Such compositional changes can make international averages easier to surpass. Leading the world in reading, math, or science remains a challenge for the U.S.
State Achievement on TIMSS
Nine states took part in the TIMSS assessment (see Table 1-1). Let’s focus on eighth-grade mathematics as that is the only test on which all nine participated. As points of reference, be reminded that the international average for the test was 500, the U.S. national score was 509, and the top scoring nation was Korea at 613.
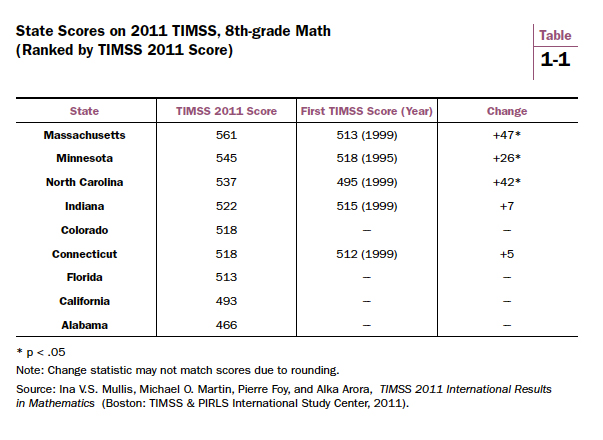
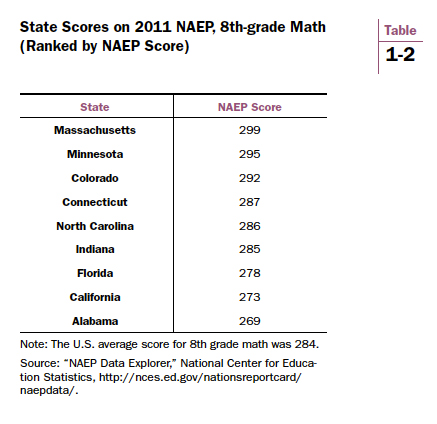
Massachusetts led the pack with a 561 score, followed by Minnesota (545) and North Carolina (537). Five of the states had taken TIMSS before, and three registered statistically significant gains from the first time they participated. As indicated in Table 1-2, the TIMSS scores map reasonably well onto NAEP scores. Because NAEP was also given in 2011, the National Center for Education Statistics was able to conduct a NAEP-TIMSS linking study.2 Items from TIMSS and NAEP were embedded in the same booklets so that items from both tests were taken by the same student at the same time. Results of the study will be released later in 2013. The hope is that future analysts will be able to calculate, with reasonable precision, projected state TIMSS scores based on NAEP scores, allowing local leaders to place state performance in an international context.3
Finland
Finland generated headlines from TIMSS. The “Finnish Miracle” story was called into question. In recent years, the popular press has been filled with stories about Finland’s wonderful education system. Educational tourism took many observers to Finland to see schools firsthand. Tales abounded of no homework, no high stakes tests, no tardy bells, a short school day, and the national belief that requiring children to start school before age seven violates “children’s right to be children.”4 Visitors marveled at the relaxed, home-like atmosphere—fireplaces in lounges, kids going shoeless, teachers called by their first names.5 The current worldwide angst (especially evident in the U.S. and Great Britain) over achievement, productivity, and rising test scores pursued through reforms such as school choice and accountability furnishes such a stark contrast that it has even drawn a derogatory acronym—GERM—from a Finnish scholar. That stands for Global Educational Reform Movement.6
One problem. Finland’s reputation is based largely on its performance on PISA, a very different test from TIMSS. The gap between the U.S. and Finland on PISA is statistically significant in mathematics literacy. On the 2011 TIMSS, however, Finland and the U.S. had statistically indistinguishable scores in both fourth and eighth-grade mathematics.
Look again at Table 1-1. Finland’s score of 514 in eighth-grade mathematics places it near the middle of the list of states. The scores of Alabama and California are the only two states scoring statistically significantly below Finland; the scores for Colorado, Connecticut, and Florida are about the same as Finland; and four states—Massachusetts, Minnesota, North Carolina, and Indiana—scored significantly higher than Finland. If Finland had been a U.S. state in 2011, it probably would have scored in the middle of the pack on NAEP. More troubling for the Finns, their TIMSS scores have declined significantly. Finland’s seventh graders took the test in 1999, scoring 520, and again in 2011, scoring 482. The 38 point decline is one of the largest recorded by a TIMSS participant.
A Progress Report on the A+ Countries
Cross-sectional data must be interpreted cautiously, and great care must be exercised when using them for predictive purposes. As Finland illustrates, a simple rule to remember is that sometimes things change.
Here is another example of that lesson, this time provided by a group of nations. The “A+ countries” are six nations that scored at the top of the 1995 TIMSS rankings in eighth-grade math. They are Belgium (Flemish community),7 Czech Republic, Hong Kong, Japan, Korea, and Singapore. Much hoopla was made about them when the 1995 TIMSS scores were released. In 2008, they were referenced as exemplars in the Final Report of the National Mathematics Advisory Panel. William H. Schmidt, Richard T. Houang, and colleagues have published a number of studies featuring a rubric based on the A+ countries’ math curriculums.8 The idea is that other countries should be more like the A+ countries. A 2012 study by Schmidt and Houang declared the Common Core mathematics standards comparable to the A+ countries’ curriculums in both focus and coherence. Moreover, they found that states with 2007 math standards similar to those of the A+ countries—again, using the same rubric from 1995—did very well on the 2007 NAEP. The findings were presented as implying that the Common Core will make the U.S. more like the A+ countries.9
Table 1-3 offers an update on the A+ countries. How are they doing? Let’s examine the table from the bottom-up. The Czech Republic left the TIMSS study after 2007, a year that saw its TIMSS score fall by 42 points from its performance twelve years earlier. Belgium (Flemish) has not participated in TIMSS since 2003. Its performance on TIMSS declined by 13 points before it left the study. The other four countries all took TIMSS in 2011. Hong Kong (+17) and Korea (+32) registered significant gains, Japan a significant decline (-11), and Singapore showed no significant change (+2). Of the six nations, then, two had statistically significant gains, three had statistically significant losses, and one scored about the same. The average score change for the six nations is -2.5 points, approximately equal to the average change for the 20 nations that participated in both 1995 and 2011. Put another way, the average A+ country made no more progress in math achievement than any other country in TIMSS.

Giving letter grades to entire nations may seem silly to many people but since the A+ designations have attained such widespread acceptance, readers are asked for their tolerance. It’s clear that A+ is no longer the appropriate grade for all of these countries.10 Korea and Hong Kong added to their outstanding 1995 scores and still deserve an A+. Singapore, too, although not making significant gains, surely preserves its A+ status by being one of only three nations with a 600+ scale score. Then things get dicey. Flemish Belgium was slipping when it left TIMSS in 2003. Its fourth graders did participate in 2011, however, and did well, scoring 549. That’s significantly higher than the U.S. at 541 and about the same as Florida at 545. But it represents no progress from the Belgian fourth graders’ previous TIMSS scores. Call Flemish Belgium a question mark—maybe an A- or B+, but definitely not an A+. We don’t know for sure without more recent eighth-grade data.
Japan’s score of 570 warrants an A, not an A+, and the downward trend is notable. Compare Korea with Japan. They both scored 581 in 1995. In 2011, Korea scored 43 points higher. The decline in the Czech Republic’s scores is the most dramatic, 42 points. The 2007 score of 504 is statistically indistinguishable from the international average of 500. Like Flemish Belgium, the Czech Republic fourth graders did participate in TIMSS 2011, scoring 511, a 30-point decline from 1995. The Czech Republic gets a C+ or B-.
Conclusion
What should we make of this? In 1995, six high achieving nations were described as “A+” to spur the U.S. towards greater math achievement. Their math curriculums were held up as ideals. And yet, since 1995, the U.S. gain of 17 points in eighth-grade mathematics is only exceeded by one A+ nation, Korea, and matched by another, Hong Kong. The other four A+ countries made less progress than the U.S. So in terms of gains, the U.S. should not look to the A+ countries for guidance. That said, five of the six A+ countries continue to lead the world in eighth-grade math achievement, and they continue to score significantly higher than the U.S.
The divergence of gain scores and status scores illustrates a problem that will be addressed in both remaining parts of this report. The tendency is for observers, when test scores are released, to zero in on the top performers, to ask what it is that the leading nations are doing, and then to urge the rest of the world to do those things. That response is understandable—but it is also potentially misleading. Causality is difficult to determine from cross-sectional data. Curriculum undoubtedly plays a role, but much more work needs to be done identifying potential curriculum effects in international data and testing well-formulated hypotheses with longitudinal models. Ideally, randomized trials would be conducted on the best curriculum programs, to tease out unobserved influences on learning. Those influences include a culture that places great value on academic success, parenting practices that promote achievement, and peers who award status based on working hard at school. They surely play a part in why some nations are “A+” while others only aspire to be.
| « Introduction | Part II: The Resurgence of Ability and Persistence of Tracking » |
Part I Notes:
1. In this section, the following rule was applied to ease the reading of the text. Subnational units, such as Hong Kong, may be referred to as “nations” or “countries.”
2. “2011 NAEP-TIMSS Linking Study,” National Center for Education Statistics, http://nces.ed.gov/timss/naeplink.asp.
3. Linking NAEP and international tests has been attempted before. See Gary W. Phillips, International Benchmarking: State Education Performance Standards (Washington, DC: American Institutes for Research, October 2010) and “Global Report Card,” Jay P. Greene and Josh B. McGee, http://globalreportcard.org/.
4. See “The Finnish Miracle,” Hank Pellissier, http://www.greatschools.org/students/2453-finland-education.gs.
5. Jenny Anderson, “From Finland, an Intriguing School Reform Model,” New York Times, December 12, 2011, http://www.nytimes.com/2011/12/13/education/from-finland-an-intriguing-school-reform-model.html?pagewanted=all&_r=0.
6. Pasi Sahlberg, Finnish Lessons: What Can the World Learn from Educational Change in Finland? (New York: Teachers College Press, 2011).
7. The Flemish, French, and German speaking communities operate separate school systems.
8. William H. Schmidt and Richard T. Houang, “Lack of Focus in the Mathematics Curriculum: Symptom or Cause?” in Lessons Learned: What International Assessments Tell Us about Math Achievement, ed. Tom Loveless (Washington: Brookings Institution Press, 2007).
9. William H. Schmidt and Richard T. Houang, “Curricular Coherence and the Common Core State Standards for Mathematics,” Educational Researcher 41, no. 8 (2012): 294-308.
10. Regression to the mean is possible, but the variance of the A+ countries’ gain scores suggests it’s unlikely.
The Brookings Institution is committed to quality, independence, and impact.
We are supported by a diverse array of funders. In line with our values and policies, each Brookings publication represents the sole views of its author(s).