
The Fiscal Impact Measure (FIM) is updated monthly by researchers in the Hutchins Center on Fiscal and Monetary Policy. Click here to see the most recent update to the FIM.
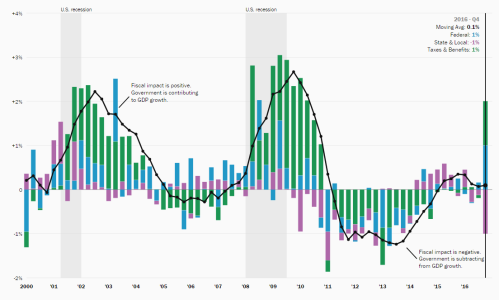
The Hutchins Center on Fiscal and Monetary Policy’s Fiscal Impact Measure (FIM) is a gauge of the contribution of federal, state, and local fiscal policy to near-term changes in the gross domestic product, the tally of all the goods and services produced in the economy. When the FIM is positive, the government is boosting the growth of real Gross Domestic Product (GDP), and when it is negative, it is restraining it.
The FIM includes both the direct effects of government purchases as well as the more indirect effects of government taxes and government transfers. The FIM is closely related to a measure of fiscal stance developed by Federal Reserve Board staff (see Cashin et al. 2017). The FIM captures the effects on the economy of changes in policy, trend growth in spending, and the automatic stabilizers.
The FIM reflects the following.
Policy changes: The FIM estimates the effects of changes in policy on the near-term economic outlook. For example, when Congress raises discretionary spending or increases taxes, the FIM shows the implications of those changes for GDP growth.
Trend growth in spending: When Medicare or Medicaid spending increases because health costs increase, this does not entail any legislative changes, but does represent a larger infusion of government spending into the economy.
Automatic stabilizers: These are changes in government taxes and spending that happen automatically when economic conditions change. When economic growth slows, spending on unemployment benefits and Medicaid increase because more people are eligible. Similarly, a slowdown in GDP leads to a reduction in tax rates that help to boost personal consumption spending.
The Hutchins Center FIM doesn’t include government spending multipliers. It measures the first order effects of government policy on GDP, but not any second round effects whereby higher GDP in one year stimulates hiring, which then boosts GDP further in later years. Nor does it include potential offsets from monetary policy. For example, a surge in government spending when unemployment rates are low could induce the Federal Reserve to raise interest rates, a response that might undo the effects captured by the FIM.
INTERPRETING THE HUTCHINS CENTER FIM
As noted above, when the FIM is positive, the government is contributing to real GDP growth, and when it is negative, it is subtracting from it. In order to calculate the contribution of government policy to the economy, however, it is necessary to specify a counterfactual; in other words, we need to compare the effects of a particular set of policies to some alternative. The counterfactual assumed by the FIM is that taxes and spending rise with potential GDP—the level of output that would occur if the economy were at full employment. A positive FIM value indicates that fiscal policy is expansionary in the sense that it is pushing GDP growth above potential growth. When the FIM is negative, policy is contractionary in the sense that it is lowering real GDP growth relative to potential growth.
Under this framework, the Fiscal Impact would be zero or neutral—neither dragging nor boosting growth—when inflation-adjusted government purchases, taxes, and transfers are growing with potential GDP.
CONSTRUCTING THE FIM
The Hutchins Center FIM uses quarterly data from the U.S. Commerce Department’s Bureau of Economic Analysis (BEA) to measure the contribution of fiscal policy to GDP growth. For a detailed derivation of the FIM components, please see this document.
The FIM for purchases is the actual contribution of real government purchases to GDP less the contribution that would have prevailed if real purchases were growing with potential GDP. To calculate the actual contribution of real purchases to GDP, we take the growth rate of real government purchases times their share of GDP; for the counterfactual we perform the same calculation but use the growth rate of real potential GDP.
Likewise, the FIM for taxes and transfers is the contribution of consumption to real GDP growth given actual net taxes (taxes less transfers) in real terms less the contribution that would have occurred had net taxes been rising with potential GDP. Calculating the contribution of taxes and transfers to consumption requires a number of assumptions. In particular, it requires assumptions about the magnitude of the effects of changes in taxes and transfers on consumption (the MPC, or the marginal propensity to consume) and the timing of the effects (the response to changes in taxes or benefits may take time to unfold). We then calculate what consumption growth would have been in the hypothetical scenario in which real taxes and transfers rise with potential GDP—the counterfactual net taxes. The difference between that growth rate and the actual growth rate represents the share of consumption growth attributable to fiscal policy. To get an estimate of the contribution to GDP growth, we multiply the change in consumption growth by the nominal ratio of consumption to GDP.
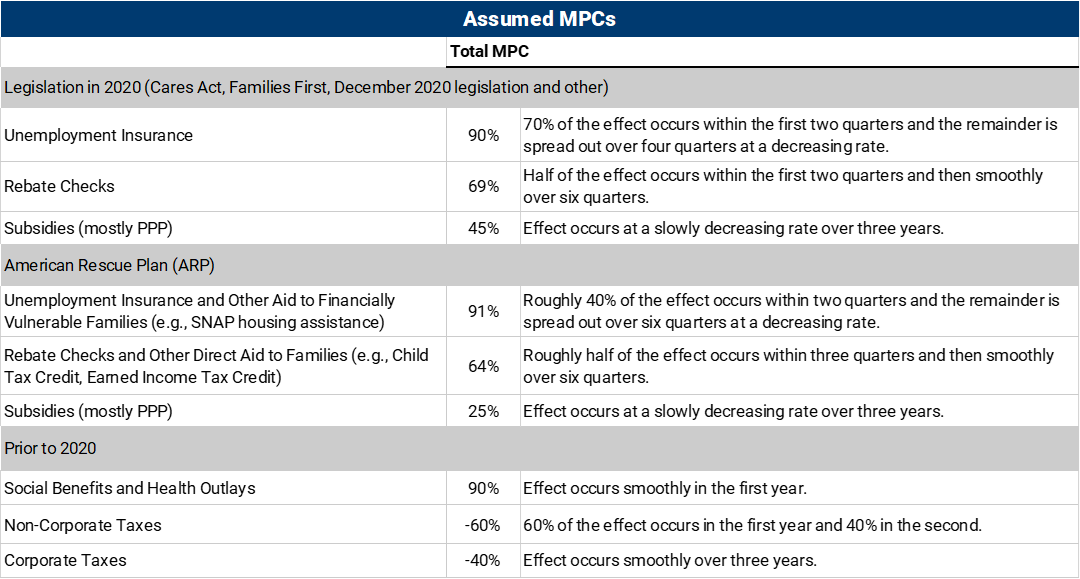
Assumed marginal propensities to consume
Our assumptions about marginal propensities to consume (MPCs) before 2020 are similar to those discussed in Cashin et al. (2017). For transfers, we assume that the MPC is 0.9, reflecting the fact that some transfers—like Medicare and Medicaid—are likely to increase spending one for one, and others, like temporary changes in unemployment benefits, are received by liquidity-constrained households that are likely to spend most of their benefits. For individual taxes, we assign an MPC of 0.6. The MPC out of a corporate tax cut is much smaller, since most corporate equity is held by high-income individuals and pension plans, who are less likely to be liquidity constrained. Part of the effect may also be viewed as a responsiveness of investment to corporate tax changes. Cashin et al. (2017) note that changes in MPC do not have a large effect on their fiscal stance measure.
We have modified these MPCs somewhat for legislation enacted during the COVID-19 pandemic, reflecting both the unusual nature of the pandemic and the fiscal response to it, as well as recent research on the spending effects of various transfer programs. We also adjusted the MPCs so that the boost to spending out of some of the American Rescue Plan provisions was assumed to be a bit smaller and more gradual, reflecting the fact that many households had built up a large stock of savings during the pandemic so were less likely to be liquidity-constrained in the near term.
Our assumed MPCs are summarized in the table below.
The FIM forecast focuses on the near-term outlook for fiscal policies. In general, we rely on the Congressional Budget Office’s 10-year economic and budget projections for our forecasts, making adjustments as necessary to reflect new legislation or changes in the economic outlook.
This is a corrected version of a previous post.
Related Content


Authors


The Brookings Institution is committed to quality, independence, and impact.
We are supported by a diverse array of funders. In line with our values and policies, each Brookings publication represents the sole views of its author(s).