
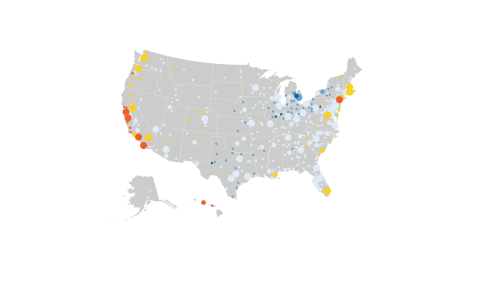
Nearly a decade after the Great Recession, U.S. housing markets show signs of two very different problems. Metropolitan areas along the Northeast and West Coasts are building relatively little new housing and have seen sharp price increases, due to tight local land use regulations. Older industrial cities, particularly around the Great Lakes, and many small Heartland communities have the reverse problem: too much housing, leading to high vacancy rates, long-term price declines, and neighborhood blight. But in other parts of the country, particularly metropolitan areas in the South and Southwest, housing markets are closer to the elusive “just right,” achieving a better balance between housing supply and demand.
In this analysis, I explore why housing markets are prone to supply-demand imbalances, and investigate how well housing supply has matched housing demand in several metropolitan areas over the past 70 years.
Housing markets have unique features that can lead to supply-demand imbalances.
In a market economy like the U.S., we typically do not expect long-lasting shortages for any particular good or service. When consumer demand increases for cars or haircuts, for example, the price of those goods will increase, leading automakers to increase production or barbers to add more chairs. But housing markets have several distinctive features that make them more prone to supply imbalances.
Housing supply adjusts slowly over time.
When housing demand contracts—for instance, due to population or income decline—existing houses do not cease to exist. The durability of buildings can lead to oversupply, resulting in vacant houses. Similarly, developing new homes also takes time, up to several years for large or complex projects, so home builders cannot instantly ramp up production to meet increased demand.
Both demand and supply of housing are highly localized.
People choose to live in a particular city or neighborhood because of proximity to their job, social networks, the quality of local public schools, and other location-specific amenities. Unlike cars, an oversupply of houses in one city cannot be loaded onto a flatbed truck and shipped to a local market with too few houses. (Structures can be relocated, but the host city still needs to provide land.) People can and do move from places with high prices and tight supply to places with lower prices, but the financial, professional, and emotional costs of moving are quite high.
All changes to supply require explicit approval from local government.
Ford and GM do not require sign-off from government agencies to increase the number of cars their factories produce. But when developers or landowners want to build new houses—whether an owner-occupant on a single lot, 500 unit subdivision on farmland, or a new apartment building on an empty parking lot—they must obtain permission from the local government. Local governments also have to grant permission to reduce supply by tearing down vacant houses or converting them into other uses. Policymakers may have incentives for limiting housing growth—often at the direct request of constituents who protest changes in their backyards—that may impede the response of landowners, developers, homebuyers, and renters. The complex network of regulations that governs new housing development not only increases the cost of housing, but can inhibit supply from responding to changes in demand.
Measuring supply imbalances: housing growth versus household growth
How do markets with housing supply imbalances—both too much and too little housing—compare to balanced housing markets? For this analysis, I define “balanced markets” as metropolitan areas that have consistently positive population growth, providing demand for additional housing, and where local government regulation does not unduly constrain development. Housing markets with excess housing supply are generally places that have experienced large-scale population losses: housing stock was built to support more households than currently live there. Metro areas where local governments restrict the development of new housing, despite strong population and/or income growth, are prone to an undersupply of housing.
The analysis focuses on three metropolitan areas, each of which represents a different market reality: too little, too much, or just right. San Francisco is the quintessential undersupplied housing market: it has some of the most restrictive land use regulations in the country, along with very strong housing demand. St. Louis is typical of older industrial cities that built housing for peak populations in the mid-20th century, but their central cities have since lost a large fraction of population. Nashville-Davidson, Tenn. represents a balanced housing market. Since 1940, both Nashville’s central city and suburban counties have experienced consistent population growth, and the metro area has few regulatory or geographic barriers to development.
Growth in population size does not translate one-for-one into demand for additional housing; for instance, newborn children do not require separate housing from their parents. Rather, additional housing demand reflects growth in the number of households, such as young adults moving out of homes shared with parents and roommates, or newly arrived families moving into a metropolitan area. Household formation rates and household size at the local level depend on housing costs and availability. Therefore I estimate county-level housing demand by dividing county population numbers by the average U.S. household size in each year.1 To measure the balance between housing supply and demand, I compare county-level changes in the number of housing units to changes in the estimated number of households from 1940 to 2010.2 County-level decennial census data comes from the National Historical Geographic Information System (NHGIS).
Supply imbalances are regional and local, not national
Across all metropolitan counties, housing supply grew slightly faster than the number of households from 1940 to 2010 (Figure 1). Household growth rates declined over the 20th century, due mostly to declining birth rates following the post-WWII baby boom. Housing growth declined somewhat more gradually, so that on average, increases to housing supply slightly exceeded household growth.

The gap between housing and household growth rates is more pronounced at the regional level. Households and housing supply grew much faster in the South and West than in the Northeast and Midwest from 1940 to 2010 (Figure 2), confirming the general shift of U.S. population towards the Sunbelt. In the Northeast, the two lines are parallel and almost perfectly aligned, suggesting that housing supply kept pace with modest rates of household growth. In the Midwest, household growth was slower than housing growth after 1980, a sign of possible excess housing supply. The South built housing significantly faster than household growth from 1940 until about 1980, with smaller margins thereafter. In the West, housing supply grew by less than estimated household growth during the entire study period—an indication of potential undersupply.

Besides population movements toward the Sunbelt, the study period coincides with a general population shift from central cities to suburban areas. Household and housing growth rates were consistently higher in suburban and exurban counties than in central counties (Figure 3). Moreover, the margin of excess housing varies across these three county groups. In central counties, housing supply moved parallel to, and slightly exceeded, household growth, with relatively consistent margins. Housing supply growth in the suburbs greatly exceeded household growth from 1940 to about 1990, after which point household growth exceeds supply growth.

St. Louis and San Francisco could learn from Nashville’s “just right” housing supply
Nashville represents a relatively small group of metropolitan areas with strong but not overheated housing markets. From 1940 through 2010, both the central city and most suburban counties experienced positive household growth (Figure 3). This is an anomaly compared to the decline of most central cities during the study period, and may be partly due to the 1962 merger between the city of Nashville and surrounding Davidson County. Housing supply grew somewhat faster than households in Nashville’s center, while housing supply tracked household growth closely in suburban and exurban counties. This implies that the region likely had sufficient supply to accommodate growth, while not generating excess housing that would stand vacant.

St. Louis offers a classic example of population and housing changes underway in older industrial cities during the study period. Households in the central city declined from 1950 through 2010, as many households left for suburban and exurban neighborhoods. Housing supply in St. Louis City also declined during most of the period, meaning that existing housing units were demolished. This is highly unusual: Even among counties that lost households, nearly 80 percent saw increases in housing supply. The graph shows that household declines exceeded housing declines, leaving St. Louis with excess housing—more than 30,000 units, or 19 percent of its stock—as of 2010. Suburban and exurban counties in the St. Louis metro area gained households more rapidly than housing until about 1980. For the last several decades, the inner ring suburbs around St. Louis have also seen nearly flat household growth, while housing supply continued to increase.

San Francisco’s household and housing growth trends are nearly the opposite of those in St. Louis: household growth exceeds housing supply growth in most counties for most of the study period. Household growth in the central city was positive but modest, while suburban and exurban counties initially matched the region’s high household growth rates. Although housing supply grew rapidly outside the center through about 1980, housing supply in San Francisco’s suburbs has grown much more slowly in recent decades than in Nashville’s suburbs. The graph shows estimated household growth exceeding housing supply growth; the classic definition of a situation predicted to drive up housing prices.
The analysis estimates household growth by dividing population by the U.S. average household size. In practice, too little housing supply (and high housing costs) can reduce household growth in several ways. Young adults delay forming independent households, separate from family. Individuals and families double up, sharing housing with others. And in the worst instance, people become homeless—a perennial problem in the Bay Area.

How can researchers and policymakers move housing markets closer to “just right”?
These results suggest several avenues for nudging regional housing markets towards equilibrium.
Supply imbalances have not corrected themselves.
In general, economists expect prices to bring about equilibrium. But the persistence of housing supply imbalances in San Francisco and St. Louis suggest that the combination of unique housing market features and supply regulation can inhibit equilibrium, even over several decades of supply-demand imbalances. Given how many metropolitan areas fall into the undersupply or oversupply buckets, it appears that well-functioning regional housing markets like Nashville may be the exception, rather than the rule. Acknowledging that imbalances will not self-correct is the first step to developing appropriate policy solutions.
Local government regulation of housing production can harm regional economic well-being.
Fragmented local regulation of housing markets can damage well-being not only for individual families, but for the larger region. The Bay Area’s high housing costs make it difficult for firms trying to retain workers and reduce the state’s overall productivity. Conversely, the ease of developing suburban greenfield housing, even as vacancy rates in the center city increase, has hurt cities across the Northeast and Midwest. If fragmented local governance leads to poor outcomes for regions, then state governments should intervene to override narrow parochial interests of local governments (and their NIMBY residents).
We need a better understanding of well-functioning housing markets
Researchers have tended to focus on troubled housing markets, those exhibiting both undersupply and oversupply, while largely ignoring markets in equilibrium. Understanding the political economy of these markets—why some local governments in growing regions support rather than oppose new housing development—is a critical area for future research. Learning how markets like Nashville have achieved better balance between supply and demand may yield insights into how to help less balanced regions.
Thanks to Cecile Murray and Rehan Hasan for excellent research assistance.
Related Content

Author

-
Footnotes
- Average household size drops substantially throughout the U.S. during the study period, from 3.67 in 1940 to 2.59 in 2010.
- The analysis includes all counties with consistent geographic boundaries that are within a metropolitan area as of 2000.
The Brookings Institution is committed to quality, independence, and impact.
We are supported by a diverse array of funders. In line with our values and policies, each Brookings publication represents the sole views of its author(s).