The coronavirus 2019 disease (COVID-19) pandemic has created both a public health crisis and an economic crisis in the United States. The pandemic has disrupted lives, pushed the hospital system to its capacity, and created a global economic slowdown. As of September 15, 2020 there have been more than 6.5 million confirmed COVID-19 cases and more than 195,000 deaths in the United States (Johns Hopkins University n.d.). To put these numbers into context, the pandemic has now claimed more than three times the American lives that were lost in the Vietnam War (Ducharme 2020; authors’ calculations). The economic crisis is unprecedented in its scale: the pandemic has created a demand shock, a supply shock, and a financial shock all at once (Triggs and Kharas 2020).
On the public health front, the spread of the virus has exhibited clear geographic trends, starting in the densely populated urban centers and then spreading to more-rural parts of the country (Desjardins 2020). Figure A shows the weekly number of deaths caused by COVID-19 in each U.S. region from late February to late August 2020. Early on, COVID-19 cases were concentrated in coastal population centers, particularly in the Northeast, with cases in New York, New Jersey, and Massachusetts peaking in April (Desjardins 2020). By April 9 there had been more COVID-19–related deaths in New York and New Jersey than in the rest of the United States combined (New York Times 2020). COVID-19–related deaths then peaked in the New England and Rocky Mountain regions during the third week of April, followed by the Great Lakes region in the fourth week of April, and the Mideast (excluding New York and New Jersey) and the Plains regions during the first week of May. The Southeast, Southwest, and Far West regions all experienced their peaks at the end of July and first week of August.

The COVID-19 crisis has also had differential impacts among various racial and ethnic groups. Inequities in the social determinants of health—income and wealth, health-care access and utilization, education, occupation, discrimination, and housing—are interrelated and put some racial and ethnic minority groups at increased risk of contracting and dying from COVID-19 (Centers for Disease Control and Prevention [CDC] 2020c). Inequities in infectious disease outcomes are the byproduct of decades of government policies that have systematically disadvantaged Black, Hispanic, and Native American communities (Cowger et al. 2020). For example, as a result of policies that have helped to determine the location, quality, and residential density for people of color, Black and Hispanic people are clustered in the same high-density, urban locations that were most affected in the first months of the pandemic (Cowger et al. 2020; Hardy and Logan 2020). In addition, Black people and Native American people disproportionately use public transit, which has been associated with higher COVID-19 contraction rates (McLaren 2020).
Relatedly, those demographic groups came into the crisis with a higher incidence of preexisting comorbidities including hypertension, diabetes, and heart disease, which also increase one’s risk of contracting and dying from COVID-19 (Yancy 2020; Ray 2020). Compared to white, non-Hispanic Americans, Black Americans are 2.6 times more likely to contract COVID-19, 4.7 times more likely to be hospitalized as a result of contracting the virus, and 2.1 times more likely to die from COVID-19–related health issues (CDC 2020b). While non-Hispanic white people are dying in the largest numbers (CDC 2020a), Black and Hispanic people are dying at much higher rates relative to their share of the U.S. population (see figure B1); moreover, this disparity is true for every age group (figure B2).

While voluntary social distancing and lockdowns that took effect in March 2020 worked initially to isolate and drive down infections, those actions precipitated a severe economic downturn. The demand shock resulting from quarantine, unemployment, and business closures dealt a blow to consumer services (Bartik, Bertrand, Cullen, et al. 2020). Lockdown measures and social distancing reduced the economy’s capacity to produce goods and services (Brinca, Duarte, and Faria-e-Castro 2020; Gupta, Simon, and Wing 2020).
The National Bureau of Economic Research (NBER) determined that a peak in monthly economic activity occurred in the U.S. economy in February 2020, marking the end of the longest recorded U.S. expansion, which began in June 2009 (NBER n.d.). Figure C shows the percent difference in real (inflation-adjusted) gross domestic product (GDP) from the peak of a business cycle through the quarter when GDP returned to the level of the previous business cycle peak for recent recessions. From the most recent peak in the fourth quarter of 2019, the United States experienced two consecutive quarters of declines in GDP; it even recorded its steepest quarterly drop in economic output on record, a decrease of 9.1 percent in the second quarter of 2020 (Bureau of Economic Analysis [BEA] 2020a; authors’ calculations). To put this contraction into historical context, quarterly GDP had never experienced a drop greater than 3 percent (at a quarterly, nonannualized rate) since record keeping began in 1947 (Routley 2020).

Figure D shows the percent change in employment relative to business cycle peaks. COVID-19–related job losses wiped out 113 straight months of job growth, with total nonfarm employment falling by 20.5 million jobs in April (BLS 2020b; authors’ calculations). The COVID-19 pandemic and associated economic shutdown created a crisis for all workers, but the impact was greater for women, non-white workers, lower-wage earners, and those with less education (Stevenson 2020). In December 2019 women held more nonfarm payroll jobs than men for the first time during a period of job growth; by May 2020 that relationship was reversed, in part reflecting job losses in the leisure and hospitality industry, where women account for 53 percent of workers (Stevenson 2020).

The COVID-19 crisis also led to dramatic swings in household spending. Retail sales, which primarily tracks sales of consumer goods, declined 8.7 percent from February to March 2020, the largest month-to-month decrease since the Census Bureau started tracking the data (U.S. Census Bureau 2020a). Although some areas (e.g., grocery stores, pharmacies, and non-store retailers) saw increases in demand as lockdown measures began, others (e.g., clothing stores, furniture and appliances stores, food services and drinking places, sporting and hobby stores, and gasoline stations) saw declines. In early May, as some states lifted social distancing restrictions, sales began to recover in most goods sectors (U.S. Census Bureau 2020a). Overall, U.S. retail sales increased 17.7 percent from April to May, the largest monthly jump on record, recouping 63 percent of March and April’s losses (U.S. Census Bureau 2020a). Growth in retail sales continued through the summer: by August, retail sales were 2.6 percent above their August 2019 level (U.S. Census Bureau 2020a).To help put those swings in such spending into historical context, figure E shows the percent change in real advance retail and food sales from the peak of a business cycle during recessions between 1980 and 2020.

In addition to consumer spending, the COVID-19 crisis has damaged the nation’s industrial production (i.e., output in the manufacturing, mining, and utility sectors). As shown in figure F, U.S. industrial production dropped sharply in March and has since only partially rebounded. This decline poses a host of challenges for the U.S. manufacturing sector, which employs nearly 13 million workers (Federal Reserve Bank of St. Louis [FRED] 2020a), especially those that depend on workers whose jobs cannot be carried out remotely.
The effects of the crisis vary by industry subsector, with the construction machinery subsector having experienced less-severe effects than it faced during the 2007–09 financial crisis due to expected government infrastructure stimuli and an increase in e-commerce, while companies in the machine tools, plastics machinery, and steel production equipment sectors have been more negatively affected (Kronenwett 2020). In addition, the partial rebound in industrial production was boosted by a 107 percent increase in auto production in June 2020 (Board of Governors of the Federal Reserve System 2020, table 1).
Six months into the COVID-19 crisis, we present 10 facts about the state of the U.S. economy. We highlight effects that COVID-19 has had on businesses, the labor market, and households. We conclude by considering how policy has supported businesses and families since March 2020. Taken together, these facts describe a joint economic and public health crisis of a scale and at a speed unprecedented in the history of the United States.
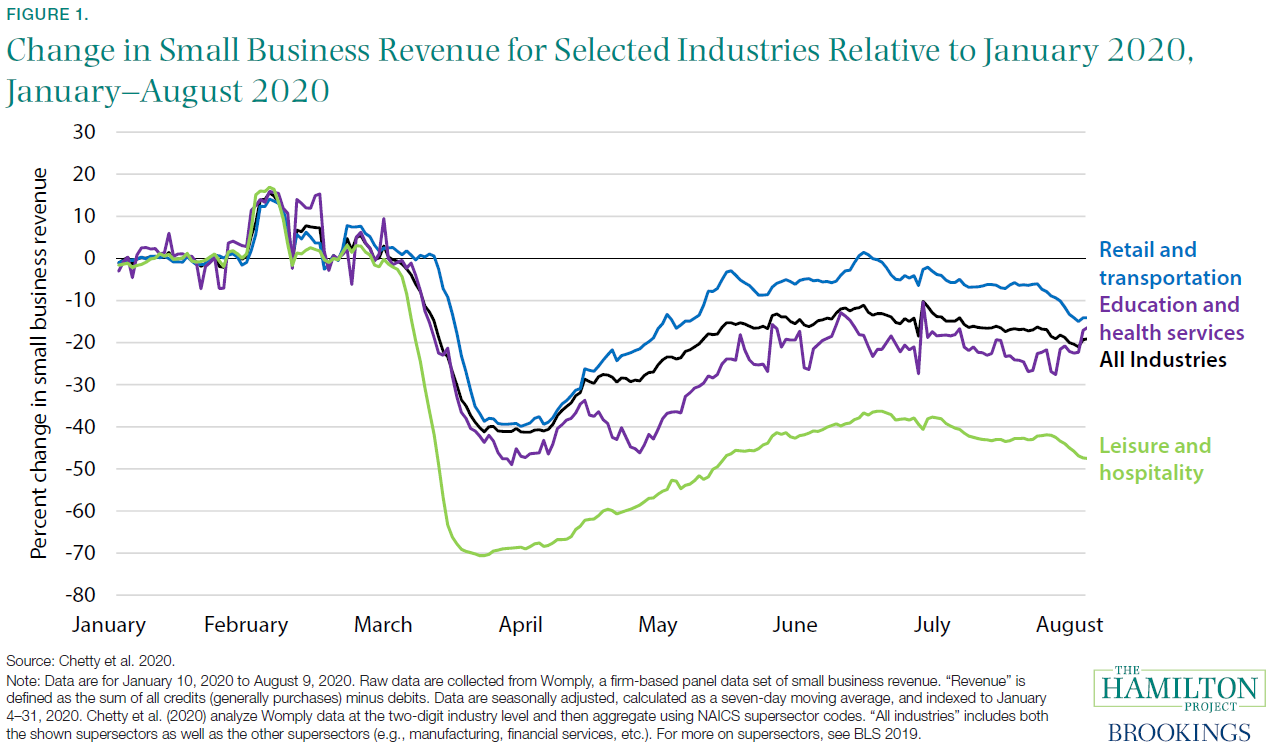
Fact 1: Small business revenue is down 20 percent since January.
The COVID-19 pandemic has been particularly damaging for small businesses, which represent the majority of businesses in the United States and employ nearly half of all private sector workers (Bartik, Bertrand, Cullen, et al. 2020; Small Business Administration 2012). Figure 1 shows how the different small business sectors have been affected by this downturn, highlighting severe declines in revenue among the leisure and hospitality as well as education and health services sectors. Compared to January 2020, average daily revenue as of August 9 was down by 47.5 percent in the leisure and hospitality sector, 16.4 percent in the education and health services sector, and 14.1 percent in the retail and transportation sector; aggregate small business revenue across all industries had fallen by 19.1 percent
Some sectors where employees could not work remotely and where businesses were not deemed essential to be open fared particularly poorly (Papanikolau and Schmidt 2020). Notably, some of these sectors, after partially rebounding, have begun to see revenue declines again starting in August. For example, the percent reduction in revenue fell by more than 5 percentage points in the first 10 days of August in the retail and transportation sector as well as in the leisure and hospitality sector.
In line with these declines in revenue, significant declines in employment at the beginning of the recession were seen in small businesses. Between March and April, employment in firms with fewer than 20 employees fell more than 16 percent; for firms with between 20 and 49 employees, the decline was 22 percent (Wilmoth 2020). Between August 30 and September 5, 50 percent of respondents had not rehired any employees, 5 percent of respondents had rehired at least one employee and 55 percent of respondents had not furloughed or laid off any employees (Small Business Pulse 2020).
There is, of course, substantial uncertainty in these calculations. A major source of uncertainty is the extent of climate change over the next several decades, which depends largely on future policy choices and economic developments—both of which affect the level of total carbon emissions. As noted earlier, this uncertainty justifies more aggressive action to limit emissions and thereby help insure against the worst potential outcomes.
Stabilizing business revenue is crucial—not only to avoid costly layoffs and firm closures, but also because reduced revenue will result in diminished investment, which can compound the future output and income damages of a recession (Boushey et al. 2019); for example, following declines in revenue during the Great Recession, real private nonresidential fixed investment fell 16 percent (FRED 2020c). For a Hamilton Project proposal on how to provide small businesses with relief in this crisis, see Hamilton (2020).
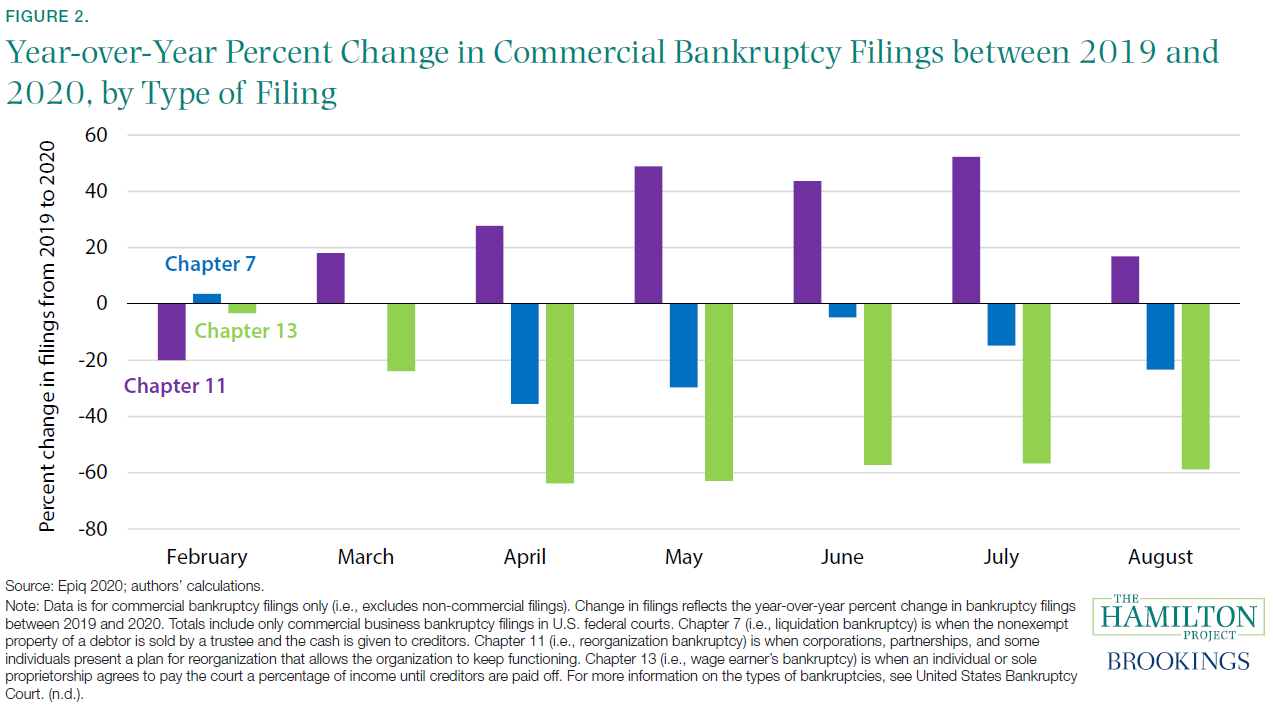
Fact 2: So far, only Chapter 11 bankruptcies have increased relative to last year.
The decline in business revenue has caused many firms to become insolvent. Hamilton (2020) estimates that by July nearly 420,000 small businesses had failed since the start of the pandemic, the number of failures typically seen in an entire year. Nevertheless, Wang et al. (2020) find that total bankruptcies are down 27 percent year-over-year between January and August. Breaking it out by type of filing, figure 2 shows how the filing of bankruptcies has changed since February 2020 from the same month last year. Chapter 11 bankruptcies—in which a plan for reorganization is negotiated—were down in February when the economy was relatively strong. Since March, such bankruptcies have regularly been between 15 percent and 50 percent higher than in the same month last year. Although larger firms benefit from entering into Chapter 11 bankruptcy in order to reorganize their operations, many smaller businesses opt for outright closures. Chapter 7 bankruptcies—in which the assets of the debtor are liquidated and used to pay creditors—decreased sharply from the same time last year in April and May and have remained below their 2019 levels through August. Finally, Chapter 13 bankruptcies—for individuals or sole proprietors who agree to pay a percentage of their income until creditors are paid off—have been down by about 60 percent from the same month in the previous year since April.
Court closures resulting from the virus have had significant effects on bankruptcy filings, with many negotiation meetings cancelled, court proceedings delayed, and lawyers holding off on bringing large cases (Church 2020).1 In addition to logistical challenges that have likely delayed bankruptcies, many owners of businesses that are closed or suffering large reductions in revenue are likely waiting to file for Chapter 7 bankruptcy. Firms that rely on financial institutions and markets for financing face curtailed access to credit (Federal Reserve Bank 2020). The Federal Reserve Bank of St. Louis finds that firms under those conditions during the Great Recession were more likely to declare bankruptcy. In all, conditions point to a coming wave of bankruptcies (Famiglietti and Leibovici 2020).
Firm closures can sometimes be the result of efficient market reallocation (Barrero, Bloom, and Davis 2020). Indeed, Bartik, Bertrand, Lin, et al. (2020) show that small businesses that were struggling in 2019 were the most likely to close early in the pandemic and the least likely to reopen. Nonetheless, this crisis will no doubt lead to the failure of viable, productive businesses; letting these businesses fail is costly to the economy (Hamilton 2020).
Fact 3: New business formations fell off in the spring, but are on track to outpace recent years.
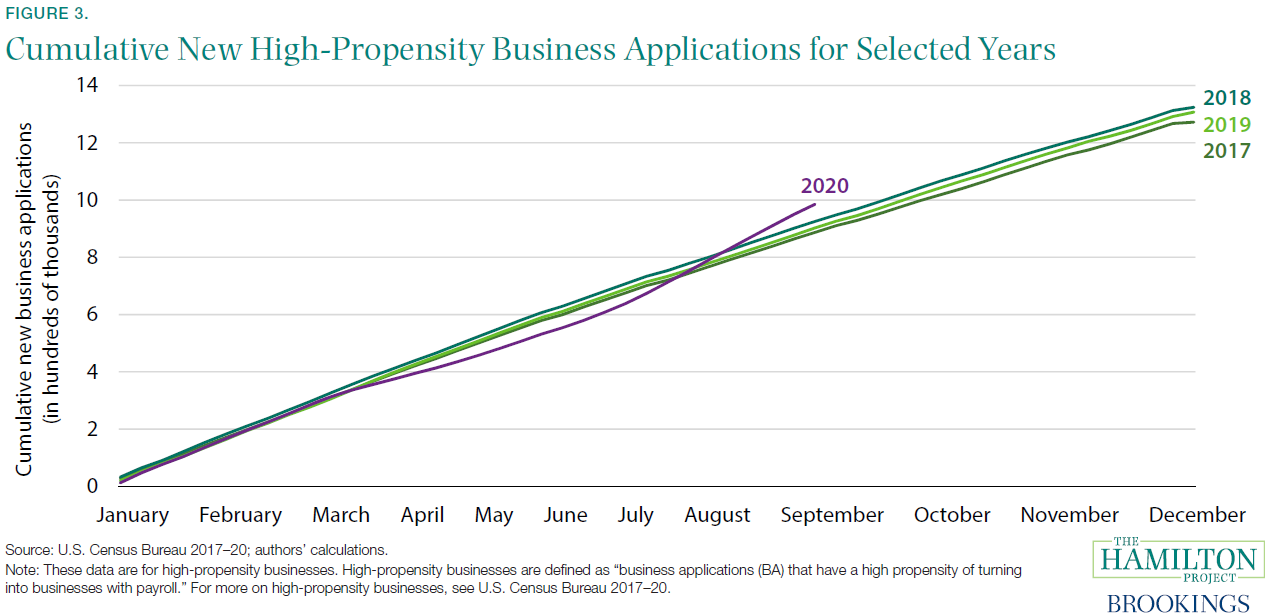
At the same time that business closures spiked in the spring, business formations lagged behind pre-crisis levels in the early months of the pandemic. More recently, business formations have begun to increase. Figure 3 shows how many new high-propensity businesses (i.e., those new businesses that are most likely to become employers) filed applications in recent years. By early June 2020 cumulative high-propensity business formations were 4.4 percent lower than they were at the same time in 2019; however, by mid-August there were actually 56 percent more new business applications than in mid-August 2019.
Business formations tend to decline during recessions (Boushey et al. 2019); in the current recession, public health conditions worked to depress business formation as well. For example, Sedláček and Sterk (2020) find that states with a larger number of COVID-19 deaths tended to have fewer high-propensity business applications
Since mid-summer, high-propensity business applications have rebounded. The Economic Innovation Group (EIG) offers three potential explanations for this recent increase: (1) there could have been a backlog in the processing of new business applications as a result of the same court closures discussed in fact 2, (2) newly unemployed persons might be starting their own businesses, and (3) some entrepreneurs could be trying to capitalize on potential reallocation or other opportunities occurring in the market (EIG 2020). There is some evidence that business creation has been boosted by demand for new kinds of goods: our analysis shows that many states with heavy manufacturing bases have seen the fastest rebounds (not shown). At the same time, 14 states still trail last year’s pace of business formation (Business Formation Statistics 2020; authors’ calculations).
Continuity in business formation is critical for long-term growth. Sedláček (2020) finds that the “lost generation” of firms during the Great Recession led to significant output loss: if firm entry had remained constant instead of falling, the economy would have recovered four to six years earlier and the unemployment rate would have been 0.5 percentage point lower even 10 years after the trough. Long term, a 1 standard deviation shock to the number of start-ups (resulting in an initial decrease in start-ups of about 10 percent) results in a 1–1.5 percent drop in real GDP that can last 10 years or longer (Guorio, Messer, and Siemer 2016). For more on the significance of entrepreneurship and innovation in the U.S. economy, see prior Hamilton Project work (e.g., Shambaugh et al. 2018).
Fact 4: Layoffs and shutdowns—and not reduced average hours—are driving in total hours worked.
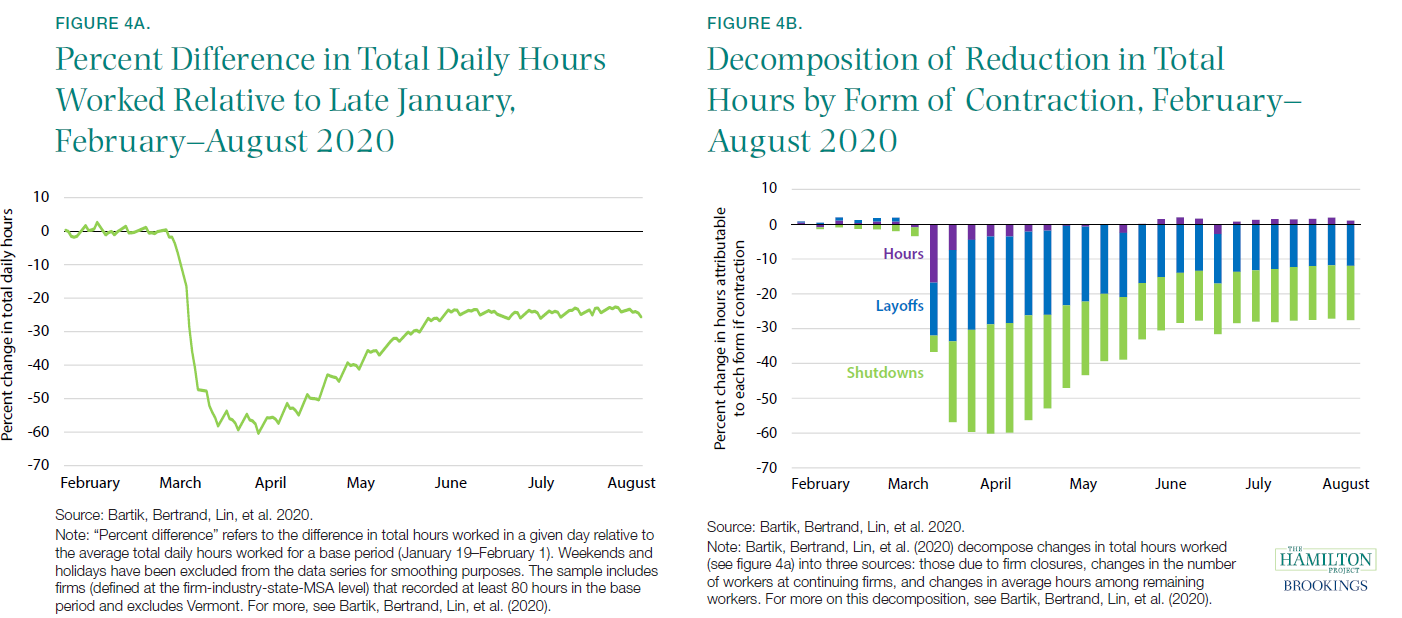
The labor market devastation caused by this pandemic has been the quickest and most severe in recent U.S. history. Many firms reacted to the COVID-19 pandemic by reducing their operations. Figure 4a shows the decline in total hours worked using data from Homebase, a firm that provides scheduling and time clock software to service-sector clients (e.g., food services, retail).2 Figure 4a shows the daily change in total hours worked from February through July, relative to a base period (January 19–February 1). The total number of hours worked fell by about 60 percent in March. While the number of daily hours began to rise again in mid-April, they leveled off at around 25 percent below baseline in June. Since then, aggregate hours have remained at between 25 and 30 percent of their baseline level.
Figure 4b shows Bartik, Bertrand, Lin, et al.’s (2020) decomposition of the reduction in total hours from figure 4a into (1) average hours worked by a worker, (2) layoffs, and (3) establishment or firm shutdowns. Their analysis shows that, beginning in late March, the reduction in total hours was primarily driven by layoffs and establishment shutdowns. That is, the observed reduction in hours has not been driven by cutting hours among workers, but by reduced employment and temporary furloughs. Relatedly, worker recall is where much of the gain in hours has come since the April nadir. Cajner et al. (2020) find that the reopening businesses, especially small firms like those observed in the Homebase data, were major contributors to post-April employment gains.
Fact 5: The number of labor force participants not at work quadrupled from January to April.
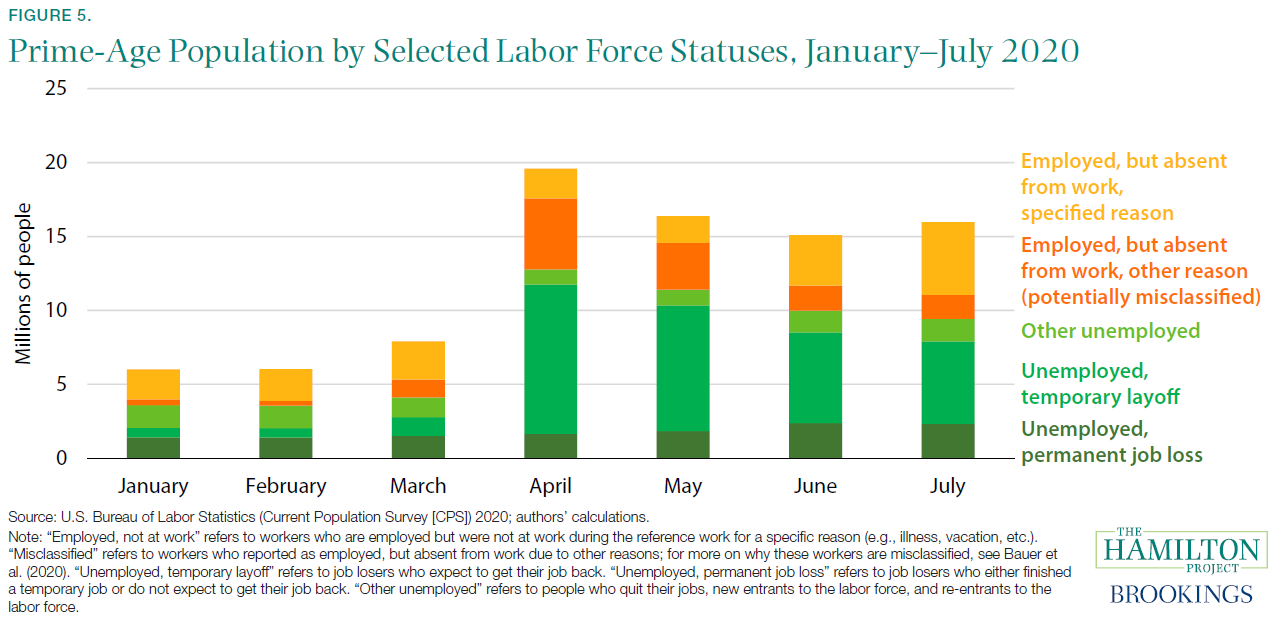
During economic contractions, the share of the population that is employed declines. Figure 5 shows the number of workers in selected labor force statuses from January to July. From March to April, the number of prime-age people participating in the labor force but not working (i.e., either unemployed or employed but not at work) rose from 7.9 million to 19.6 million. That increase was largely driven by a 10.3 percentage point rise in the unemployment rate (FRED 2020d).
As shown in figure 5, an unusual phenomenon in April and May was the surge in labor force participants that were counted as employed but not at work. These workers were either absent from work for a reason (e.g., vacation, child care) or absent from work for “other” reasons; recent research has suggested that this latter group largely misclassified themselves as being employed, suggesting an even higher share of the population was out of work (Bauer et al. 2020).
Early in the recession, the majority of those who were not at work—either those who were unemployed or those employed but not at work—described their circumstances as temporary. Temporary layoffs are less damaging then permanent layoffs because they represent a much higher chance of reemployment since the employer–employee relationship is maintained (Fujita and Moscarini 2017; Nunn and Parsons 2020). In April, 10.1 million were unemployed on temporary layoff, 4.8 million were potentially misclassified as employed but absent from work for “other” reason, and 2.0 million were employed and absent from work for a specific reason. Altogether, these people represented 86.3 percent of prime-age labor force participants not at work in April.
In May, June, and July, these three categories accounted for a smaller share of labor force participants who were not at work. Instead, a rising number of people not at work have classified themselves as being on permanent layoff. In April, the number who were unemployed due to a permanent job loss was 1.6 million, up only modestly from the number prior to the recession and representing 6.5 percent of those unemployed or employed but not at work. In July, 2.3 million were unemployed due to permanent layoff, which was 11.8 percent of those either unemployed or employed and not at work.
More permanent layoffs suggest more people being unemployed for longer periods. Chodorow-Reich and Coglianese (2020) project that, by February 2021, 4.5 million individuals will have been unemployed for more than 26 weeks, and almost 2 million individuals will have been unemployed for more than 46 weeks. Long-term unemployment can lead to lower future earnings and reduced rates of homeownership (Cooper 2013).
Fact 6: The number of people not in the labor force who want a job spiked by 4.5 million in April and has remained elevated.
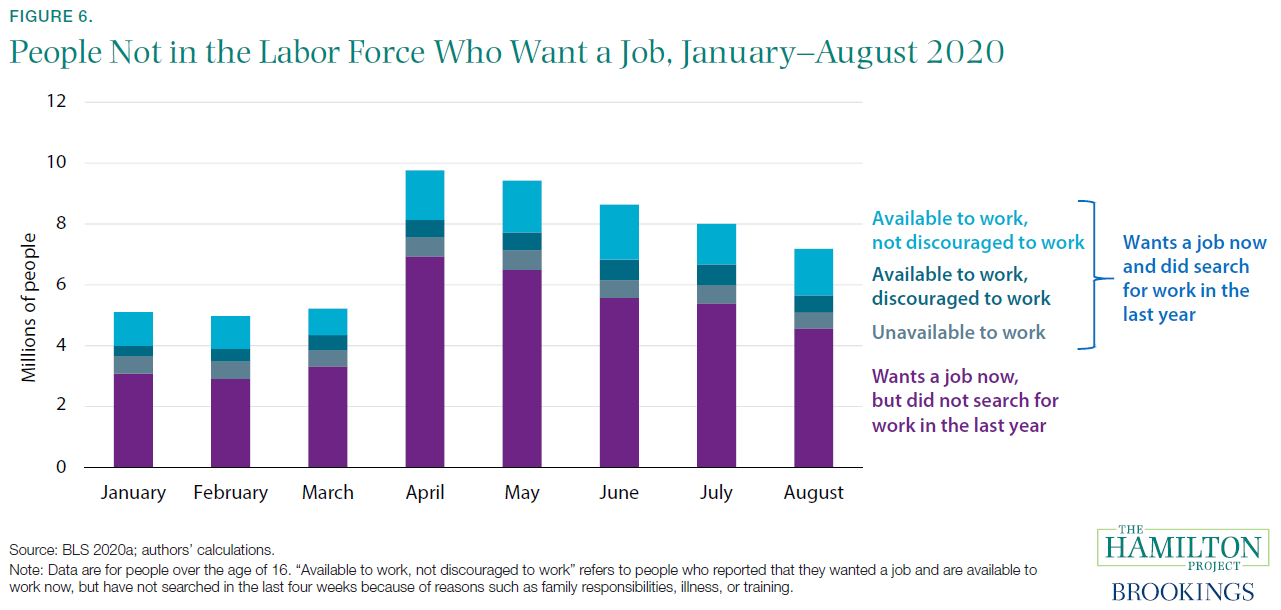
While many of the millions of people who are no longer employed are counted as unemployed (as highlighted in fact 5), a significant portion have dropped out of the labor force altogether. Figure 6 shows the number of persons not in the labor force but who say they want a job. The size of that group grew by 4.5 million in April, as the group includes those who lost their jobs in March and did not look for work in April (and thus were classified as not in the labor force). Within the group of people out of the labor force but who want a job, 6.0 percent reported being discouraged by their labor market prospects and 16.7 percent reported having another reason for not looking for work. The increase between March and April in those not in the labor force but who want a job was particularly large among adults of prime working age (25-54): 2.5 million (BLS 2020a; authors’ calculations). These numbers have remained elevated since April. To put this into context, the unemployment rate in August was 8.4 percent; however, using an alternative measure of unemployment that also includes people not in the labor force who want a job and are available to work—both discouraged and not discouraged workers (i.e., U-5)—the rate was 9.6 percent in August.
Many of those reporting being out of the labor force but wanting a job have not been looking for work because of reasons that include child-care responsibilities, issues with transportation, or illness. The size of that group has risen steadily, from 867,000 in March to 1.8 million in June, but then fell slightly to 1.5 million in August. As highlighted in Stevenson (2020), disruptions in child care have led many working parents to drop out the labor force, a development that (without significant policy intervention) could have long-lasting negative effects on labor market outcomes for years to come.
As was true before the pandemic, the majority of those not in the labor force do not want a job; not shown in figure 6 are the roughly 90 million Americans who said they did not want a job (BLS 2020a). This group, which consists largely of students, family caretakers, retirees, and people with illnesses, became larger in April and May, with some evidence suggesting that the pandemic pushed workers over the age of 54 into retirement. For example, among people who were employed in January but out of the labor force in April, 28 percent who offered a reason why they had left the labor force said they were retired (Coiboin, Gorodnichenko, Weber 2020).
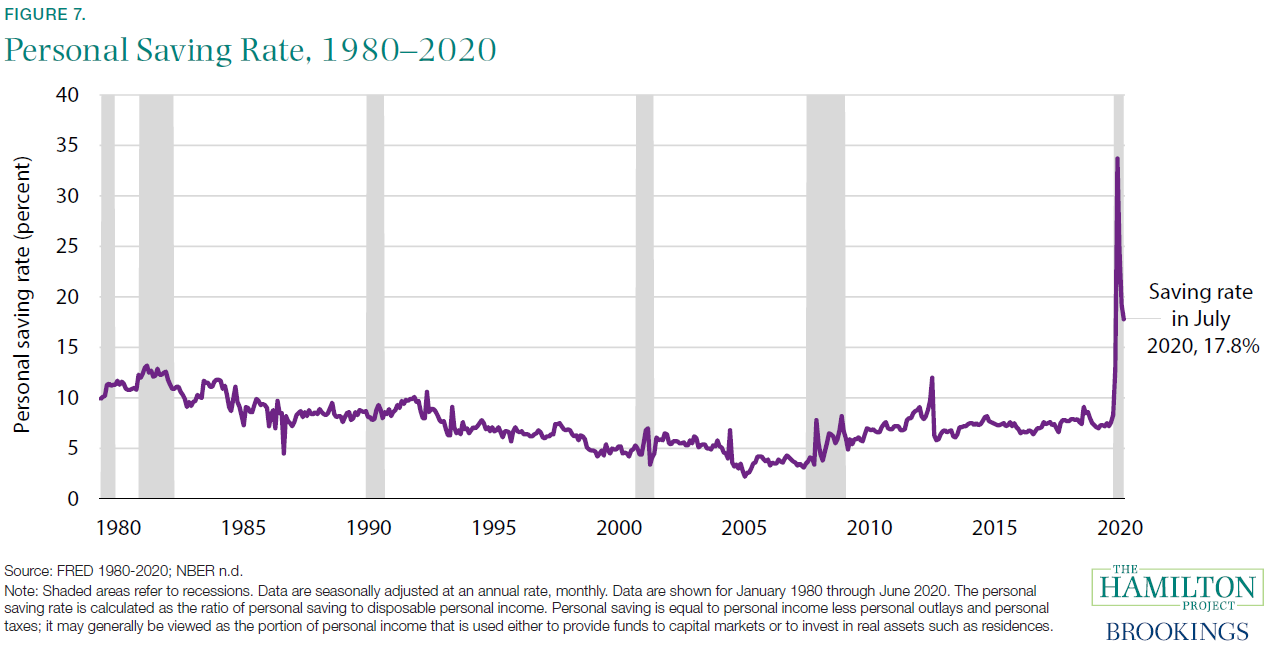
Fact 7: In April 2020 the U.S. personal savings rate reached its highest recorded level.
One of the immediate effects of the COVID-19 pandemic was a sharp decline in aggregate spending and a sharp increase in savings. Figure 7 shows the personal saving rate, which is the ratio of personal saving to disposable personal income. The personal saving rate peaked at 34 percent in April, its highest level in recorded history. It has decreased since then but remains significantly elevated. That increase has been the result of both lower spending and greater federal transfer payments.
Just as it did across the world (Andersen et al. 2020; Bounie, Camara, and Galbraith 2020; Carvalho et al. 2020), spending in the United States dropped following COVID-19–related shutdowns (Coiboin, Gorodnichenko, Weber 2020). Spending on many types of goods and services fell immediately as the pandemic emerged. Nevertheless, some categories of goods spending saw initial increases and most categories of goods spending have rebounded since March; for example, spending on groceries was strong early in the pandemic, with women, households with children, and older households stockpiling more supplies (Baker al. 2020). Although goods spending has recovered to pre-pandemic levels, spending on services remains sharply down through July (BEA 2020c).
Through July, the saving rate was also boosted by stimulus payments to households, including unemployment insurance benefits and other federal transfers to households. As a result of those payments, even as millions of workers have lost their jobs, disposable personal income from March to July exceeded pre-pandemic levels (FRED 2020b). Although evidence suggests that many low-income households spent their stimulus checks immediately, other income groups said they planned to save the money (Baker et al. 2020; Chetty et al. 2020;), and low-income households were more likely to save their overall monthly income relative to prior periods (Bachas et al. 2020; Coibion, Gorodnichenko, and Weber 2020). Furthermore, Bachas et al. (2020) find evidence of sizeable growth in liquid asset balances for many households whom the federal support reached, suggesting the importance of the initial stimulus and insurance programs in limiting the effects of labor market disruptions on households’ financial positions. For low-income households whom the federal support has not reached, financial circumstances have been dire.
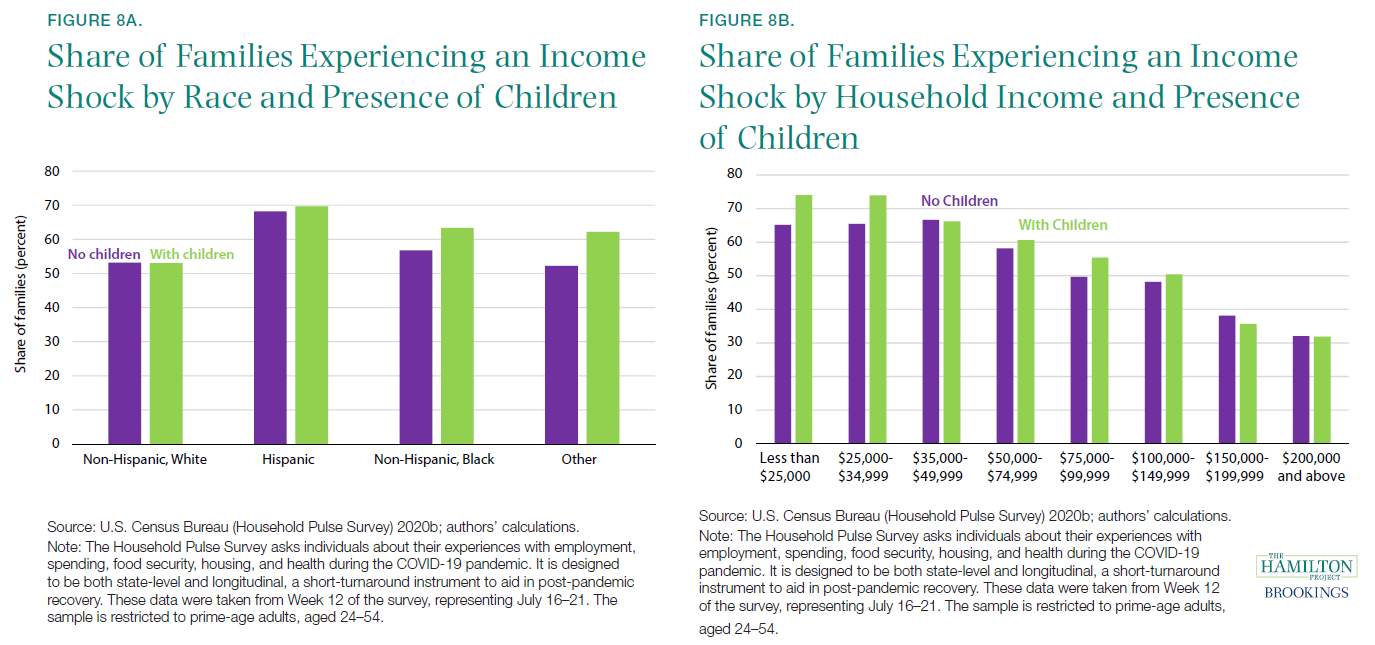
Fact 8: Low-income families with children were most likely to experience an income shock.
During the COVID-19 recession, job loss and labor income loss have not been experienced equally. Since March, low3-income households, non-white households, and households with children were most likely to experience an income shock (Monte 2020). Figures 8a and 8b shows these patterns in late July.
About half of Black and Hispanic households experienced an income shock recently (see figure 8a). Hispanic families with and without children are most likely to experience an income shock. Lopez, Rainie, and Budimen (2020) found that 61 percent of Hispanic adults said in April that they or someone in their house had experienced a job or wage loss. Ganong et al. (2020) examine the racial gaps in consumption smoothing following an income shock, and find that the welfare cost of income volatility (i.e., how much a household cuts consumption following an income shock) is 50 percent higher for Black households and 20 percent higher for Hispanic households than it is for white households.
More than three out of five low-income households with children reported that they had experienced an income shock due to COVID-19 (figure 8b; authors’ calculations). Income losses related to COVID-19 are associated with a host of material hardships, including food insecurity and difficulty paying bills (Despard et al. 2020). Families with children are also vulnerable to falling behind on obligations: each additional child in a household increases the likelihood of a serious delinquency (being at least two months behind on a current loan obligation) by 17 percent (Ricketts and Boshara 2020).
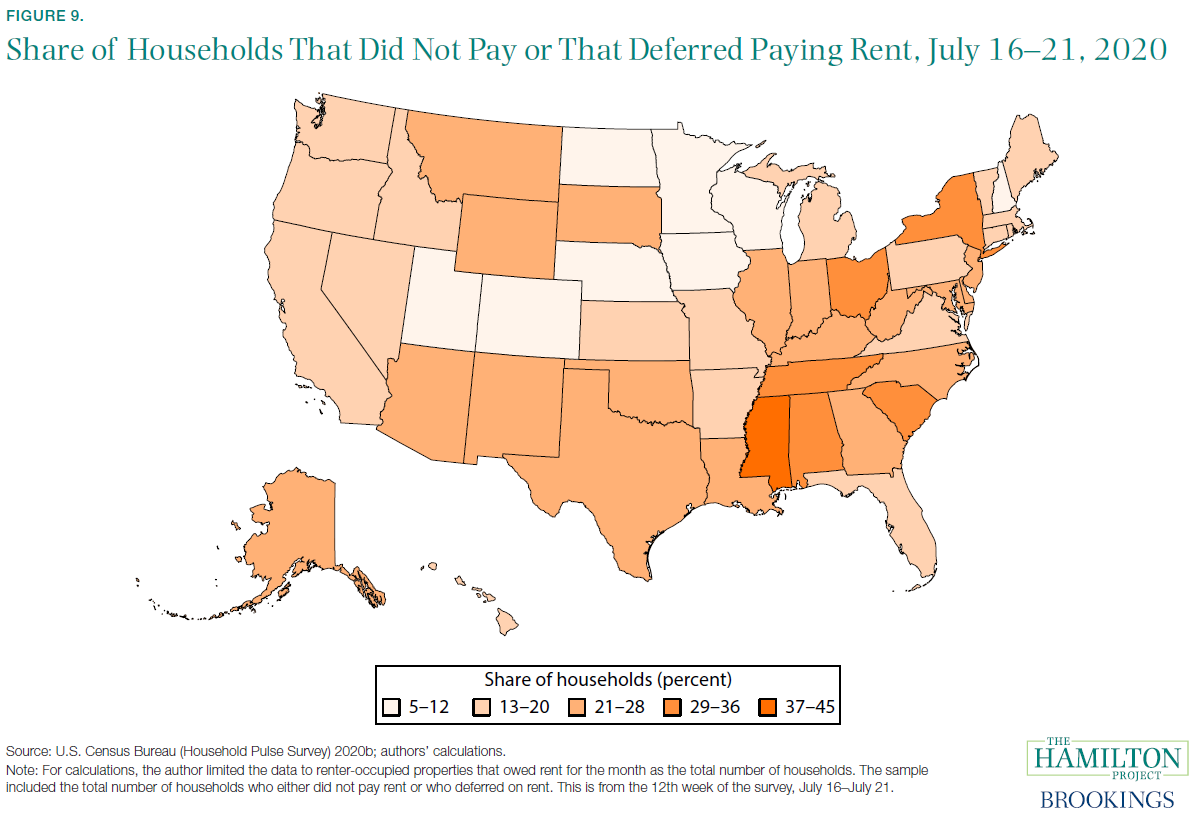
Fact 9: In 26 states, more than one in five households was behind on rent in July.
Although the increase in federal payments to households and unemployed workers has been relatively generous, it has not been able to cover all expenses for struggling households. Focusing on renters surveyed in late July, figure 9 shows that in 26 states more than one-fifth of renting households had not yet paid their rent for June, and that in five of those states (including New York) one-third of households had not yet paid their rent.
According to a survey by Apartment List, missed payments were concentrated among young and low-income households as well as residents of densely populated urban areas. With late fees added on, households who miss a rent payment in a given month may be more likely to be unable to afford their next housing payment, creating a vicious circle of delinquency and putting households at risk for eviction (Adamcyk 2020). In addition, renters (as compared to home owners) are less likely to receive federal support for housing costs (Amherst Market Commentary 2020).
For many households, unemployment coincided with having less than two month’s income in liquid assets and having high debt-to-income ratios (Kolomatsky 2020). In an April 2020 survey conducted by the Pew Research Center, 73 percent of Black adults and 70 percent of Hispanic adults indicated that they did not have emergency funds to cover three months of expenses, compared to 47 percent of white adults (Lopez, Rainie, and Budimen 2020). Furthermore, Black and Hispanic respondents also said they would not be able to cover these expenses by borrowing money, using savings, or selling assets (Lopez, Rainie, and Budimen 2020).
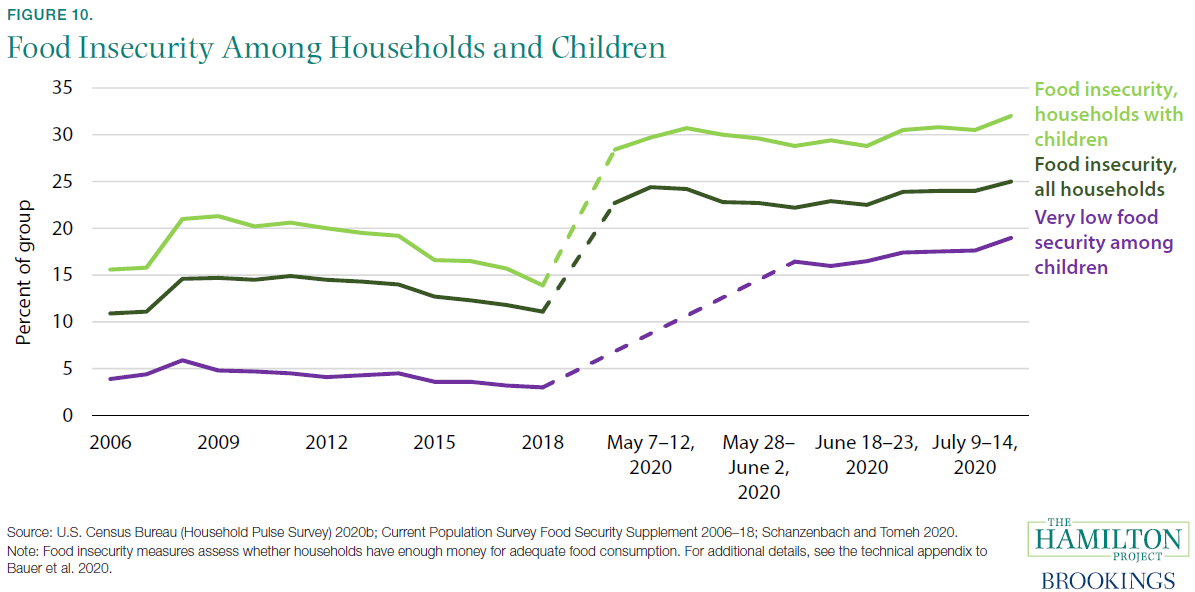
Fact 10: From 2018 to mid-2020, the rate of food insecurity doubled for households with children.
During the COVID-19 pandemic, rates of food insecurity and of very low food security among households with children have increased (see figure 10). Food insecurity occurs when a household does not have sufficient food for its members to maintain healthy and active lives and lacks the resources to obtain more food. Very low food security is akin to hunger and captures whether there is a significant or consistent disruption in food consumption. Notably, the current levels of food insecurity are above their Great Recession peaks.
Food insecurity is particularly high among households with children. In fact, it has doubled since before the pandemic, growing from roughly 14 percent in 2018 to about 32 percent of households in July 2020 (see figure 10). These rates are even higher for Black and Hispanic households (Schanzenbach and Pitts 2020), and Black and Hispanic households with children (Bauer 2020).
Typically, families experiencing food insecurity are able to nonetheless maintain food security for their children; but this does not seem to be the case today (Coleman-Jenson et al. 2020). In June and July, rates of very low food security among children worsened, increasing from 16.4 percent in the first week in June to 19.0 percent by the third week of July.
Several policy responses to the COVID-19 pandemic have supported households’ food security. Pandemic EBT, a disaster response program that provided the value of lost school meals to eligible households as a grocery voucher, reduced very low food security among children by 30 percent (Bauer et al. 2020). Unemployment Insurance receipt and SNAP emergency allotments also reduced food insecurity (Bitler, Hoynes, and Schanzenbach 2020; Raifman, Bor, and Venkataramani 2020).
Discussion
We conclude this set of economic facts with a discussion of the federal policy response to COVID-19. The fiscal policy response to the pandemic has taken two primary tacks: (1) aid to business, and (2) aid to households and unemployed workers. A series of laws—notably The Families First Act and The Coronavirus Aid, Relief, and Economic Security Act (CARES) Act—authorized hundreds of billions of dollars in direct support to firms and to families.
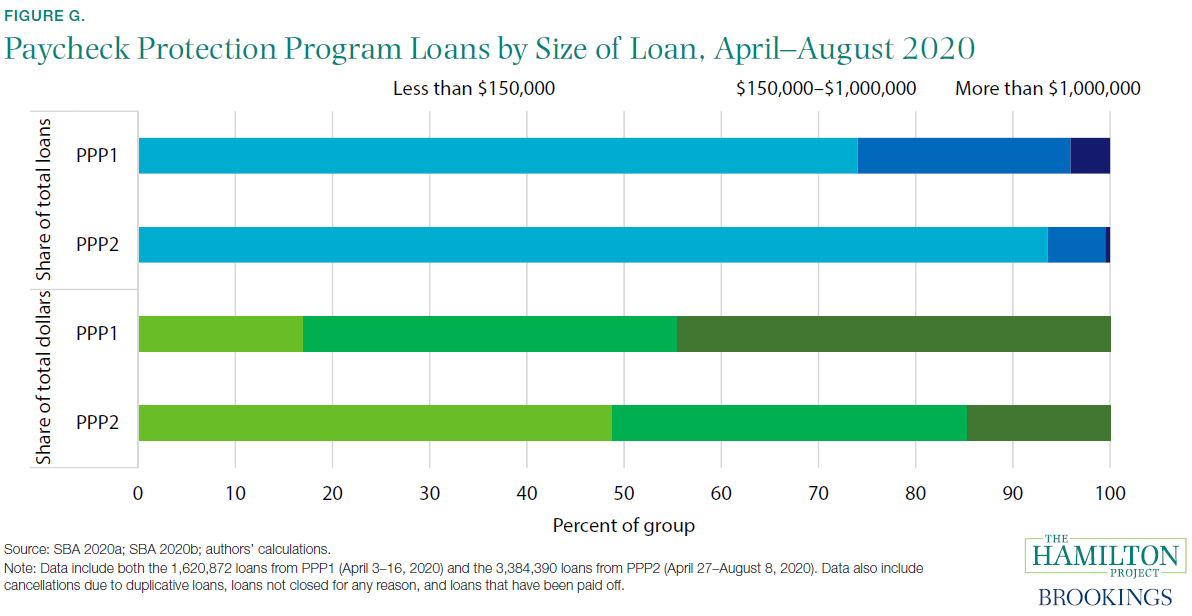
The major program in the CARES Act providing relief to small businesses is the Paycheck Protection Program (PPP). According to the Small Business Pulse Survey, 73.5 percent of small businesses surveyed requested financial assistance from the PPP; 25.6 percent requested economic injury disaster loans; and 13 percent requested small business administration loan forgiveness between March 13 and September 5. As described in Hamilton (2020), the PPP was initially allocated $349 billion to offer loans to small businesses, with such loans being forgiven if businesses retained workers and maintained payroll. The program was significantly oversubscribed at first, and larger businesses—who requested larger loans—disproportionately received funding. In particular, although loans for over $1 million only represented 4 percent of all loans processed in the first round of PPP, they represented 45 percent of all dollars disbursed (figure G). As a result, an additional $310 billion was allocated to the PPP, nearly half of which had been disbursed by early August; this second round resulted in a greater number of smaller loans to smaller businesses: as shown in figure G, in the second round of PPP loans under $150,000 accounted for 94 percent of all loans processed and 49 percent of all dollars disbursed.
Empirical evidence on the effect of the PPP in maintaining employment has been mixed, although the range of results generally show a positive effect. For example, about 50 percent of recipients reported retaining between one and five jobs as a result of the program, whereas about 10 percent reported retaining no jobs (SBA 2020; authors’ calculations). One study examining a broad range of firms estimated that the PPP led to 2.3 million jobs being maintained through early June, or for about eight weeks (Autor et al. 2020). Another study examining firms with relatively low wages found no employment effect (Chetty et al. 2020), and attributed the lack of effect to the fact that firms that offer professional, scientific, and technical services received a greater share of loans than firms providing food services.
PPP loans increased business’s expected survival probability by between 14 and 30 percentage points (Bartik, Bertrand, Cullen, et al. 2020). While administering the loans via private banks allowed for rapid disbursement of funds, it meant that businesses with pre-existing connections with banks were more likely to benefit from the program (Bartik, Bertrand, Cullen, et al. 2020). Humphries, Neilson, and Ulyssea (2020) found that of businesses that applied for the PPP, smaller businesses applied later, faced longer processing times, and were less likely to have their applications approved. Relatedly, Granja et al. (2020) found that PPP funds went disproportionately to areas less affected by the pandemic: 15 percent of establishments in the most-affected areas received loans while 30 percent of those in the least-affected areas received them. These issues together with PPP’s “firstcome, first-served” design disadvantaged small businesses.
As Hamilton (2020) makes clear, while the PPP supported many small businesses in the spring and early summer, the support was temporary. It was not sufficient to keep small businesses viable through the pandemic. Small businesses are now in dire straits and in need of further assistance.
Initially, there was an unprecedented level of federal resources provided to households, largely through one-time stimulus payments and expanded unemployment insurance (UI) payments. As a result of those payments, disposable personal income was nearly 10 percent higher in the second quarter of 2020 relative to the first quarter, even though employee compensation fell almost 7 percent (BEA 2020b).
The Families First Act and CARES Act included stimulus payments for households based on income, expanded UI eligibility, an increase of $600 in UI payments to recipients, increases in SNAP benefits to those households not receiving the maximum benefit, and direct payments to families with children eligible for free or reduced-price school meals to make up for missed school meals.
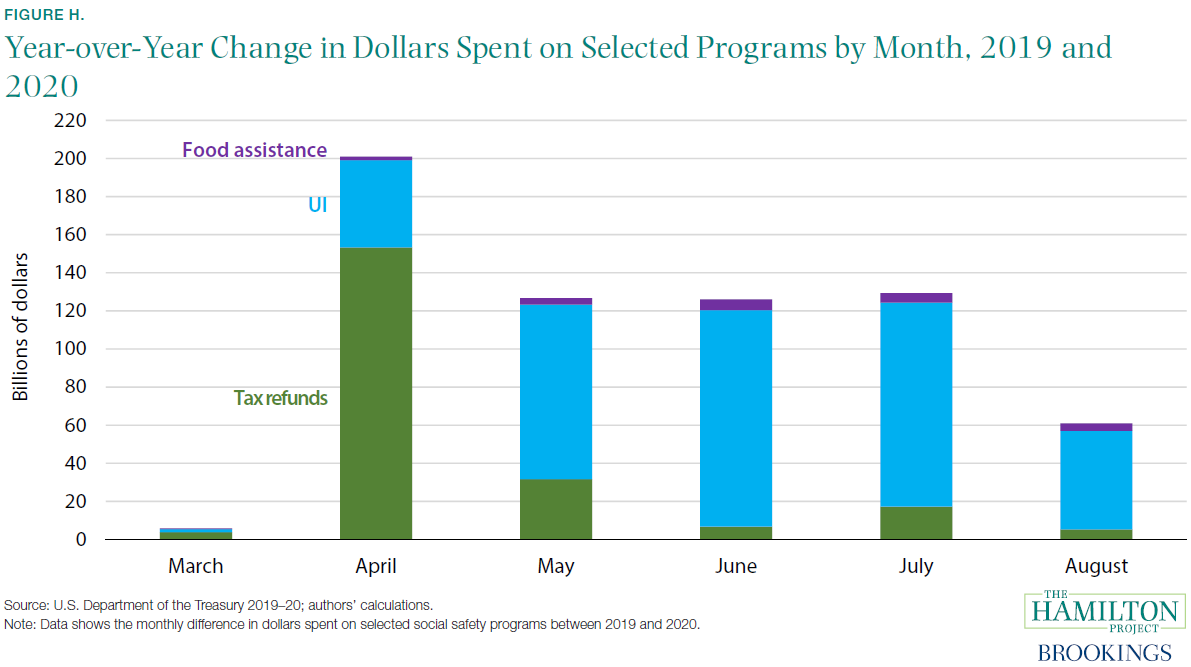
Figure H highlights the increase in new federal outlays from these three sets of disbursements to households by month from March to August by subtracting 2019 outlays for these categories from 2020. As shown in figure H, there was an increase in tax refunds and other IRS payments to households of more than $140 billion in April, with additional increases in later months for households whose stimulus payments were delayed. (It is also likely that the increase in July reflects the delay in the tax filing date.) In addition, UI payments totaled nearly $46 billion in April, and then averaged $104 billion from May through July. In August, UI payments fell sharply, to $52 billion, as the additional $600 weekly payment to recipients expired. The combination of higher SNAP participation, SNAP emergency allotments, and PandemicEBT resulted in total spending on food assistance averaging around $3.4 billion per month. Other temporary measures in the CARES Act that supported households included student loan forbearance and prohibitions on most foreclosures and evictions.
Mounting empirical evidence shows that the extraordinary support for households and unemployed people supported spending and economic growth in recent months (Casado et al. 2020). According to an economic analysis by the Washington Center for Equitable Growth, for every dollar of stimulus, households increased spending by 25–35 cents (Robbins 2020).
Going forward, the expiration of the $600 weekly payment to UI recipients will be a drag on consumer spending (even as some recipients became eligible for a temporary increase in payments of $300 a week). In addition, recent evidence suggests the generous UI benefits through July did not constrain the supply of labor and so the expiration of those benefits did not provide a boost to labor supply and employment (Altonji et al. 2020; Marinescu, Skandalis, and Zhao 2020). With wages and salaries down 5 percent from February to July, households continue to need substantial federal support (Bitler, Hoynes, and Schanzenbach 2020).
Indeed, the abrupt lapse in support for firms, households, the unemployed, and families with children threatens a nascent and fragile economic recovery and stands to do long-term and permanent damage. The greater the economic damage during the pandemic, the more protracted the recovery will be once the pandemic is over. Given the cost to life and livelihood of a weak economy and labor market, policymakers must continue to use the fiscal, monetary, and public health tools at their disposal to end the COVID-19 pandemic and hasten a self-sustaining economic recovery.
Fiscal support to firms and families flowed promptly, with notable exceptions. Black applicants faced significant delays in receiving UI, and the smallest businesses without preexisting relationships with banks struggled to receive PPP (Schanzenbach et al. 2016; Grooms, Ortega, and Rubalcaba 2020). And while existing automatic stabilizers have sprung into action given the speed of the economic collapse, much more could be done to extend augmented countercyclical fiscal policy forward in time to help sustain the recovery (Boushey, Nunn, and Shambaugh 2019). The federal government’s failure to act since March—to suppress the spread of COVID-19, to improve automatic stabilizers, to extend fiscal relief—is to our collective detriment. The Hamilton Project’s mission is to provide evidence and policy proposals based on the judgment that long-term prosperity is best achieved by fostering economic growth and broad participation in that growth. Federal fiscal policy can and should do more—urgently—to support those goals.
Endnotes
1. While many courts reopened in May, they began to cancel jury trials and in-person proceedings again in June as cases surged (United States Courts 2020).
2. Bartik, Bertrand, Lin, et al. (2020), who also rely on Homebase data, show that, despite Homebase’s concentrated clientele, the data are broadly representative of the sectors most acutely affected by the pandemic (i.e., industries that rely on in-person interaction and cannot easily transition to remote work).
Authors


The Brookings Institution is committed to quality, independence, and impact.
We are supported by a diverse array of funders. In line with our values and policies, each Brookings publication represents the sole views of its author(s).