


The Hamilton Project offers six economic facts that highlight continuing challenges and complexities in health care and health insurance markets on which the policy debate should focus.
Read the full introduction »
Through reforms to cost-containment and expanded access to health insurance plans, the Patient Protection and Affordable Care Act of 2010 (ACA) has begun to shape the delivery and cost of health-care services to Americans. Many of these reforms are still taking hold, and it is too soon to completely know how they are affecting the health-care system. But looking beyond these considerations, it appears that many enduring economic challenges persist in the markets that provide health care and health insurance to consumers..
Indeed, many of these ongoing challenges center on three areas:
- Accessing care. Recent estimates show that in 2014, the first year of the ACA’s open enrollment, the number of Americans lacking health insurance dropped to 33 million, or to 10.4 percent of the population (Smith and Medalia 2015). This latest read of the uninsured rate is the lowest it has been in the years for which there are data (Centers for Disease Control and Prevention 2009; Smith and Medalia 2015). The ACA’s mandate and corresponding subsidies for individuals to purchase health insurance on the federal or state exchanges explain some of the decline, but other economic forces, such as an improving labor market, may also be a factor. Nevertheless, with an estimated 35 million Americans still uninsured and many more underinsured, important gaps in the health-care safety net remain. Notably, individuals, particularly those with limited resources, do not necessarily have the ability to avoid severe financial burdens when they become sick, suggesting that the health-care safety net could be further strengthened.
- Delivering high-quality care without waste. Experts agree that addressing important inefficiencies in the health-care sector would help reduce spending, improve the quality of care, or both. These concerns motivated the payment reforms of the ACA, which reinforced ongoing trends favoring value-based payments, whereby providers are compensated based on the outcomes for patients rather than on the number of services, patient visits, or treatments they provide. But beyond these payment reforms, another important source of inefficiency occurs when Americans pay too much for insurance coverage they do not value, or pay too little and receive inadequate coverage that leaves them at risk of facing large health expenditures. With more Americans being offered a choice of which health plan to select through their employer, Medicare Advantage, or the federal and state exchanges, aligning consumers with the plan that best fits their preferences and needs presents an opportunity to lower costs for consumers and the public sector without sacrificing the quality of care.
- Managing new technology. In many cases advances in medical technology have provided health benefits that far exceed their costs (Cutler and McClellan 2001; Cutler, Rosen, and Vijan 2006). But experts also believe that the U.S. health-care system often pays for new and more expensive therapies that might not be any more effective than existing ones (Chandra and Skinner 2012). Moreover, excessive spending on ineffective technology can divert resources away from other health-improving investments, such as education or preventive care. Achieving the best pace and composition of innovation for the health-care system will require balancing considerations of health benefits, direct costs, and opportunity costs.
In the years to come, confronting these enduring challenges will be critical to helping Americans achieve long-term prosperity. A fundamental tenet of The Hamilton Project’s economic strategy is that long-term prosperity is best achieved by policies that foster sustainable economic growth and that enhance individual economic security. Improving access to health care, reducing waste in the delivery of high-quality care, and effectively directing technological innovation toward productive medical treatments would work toward achieving these goals.
In this spirit, The Hamilton Project offers six economic facts that highlight continuing challenges and complexities in health care and health insurance markets on which the policy debate should focus. Chapter 1 reviews health-care spending in the United States, focusing on the differences in spending across regions and recent trends in spending. Chapter 2 describes consumers’ health-care spending and highlights their financial vulnerability when selecting an insurance plan. Chapter 3 examines the choices consumers make with employer-sponsored insurance plans—an important source of access to health insurance in the United States.
Chapter 1. Health-Care Spending in the United States
Health-care spending varies widely across the country and has grown steadily over the past five decades. Americans now spend nearly one in five dollars on health care. However, the pace of growth in health-care spending has been falling, on balance, since the 1980s due to changes in insurance plans, provider payment methods, and public sector programs.
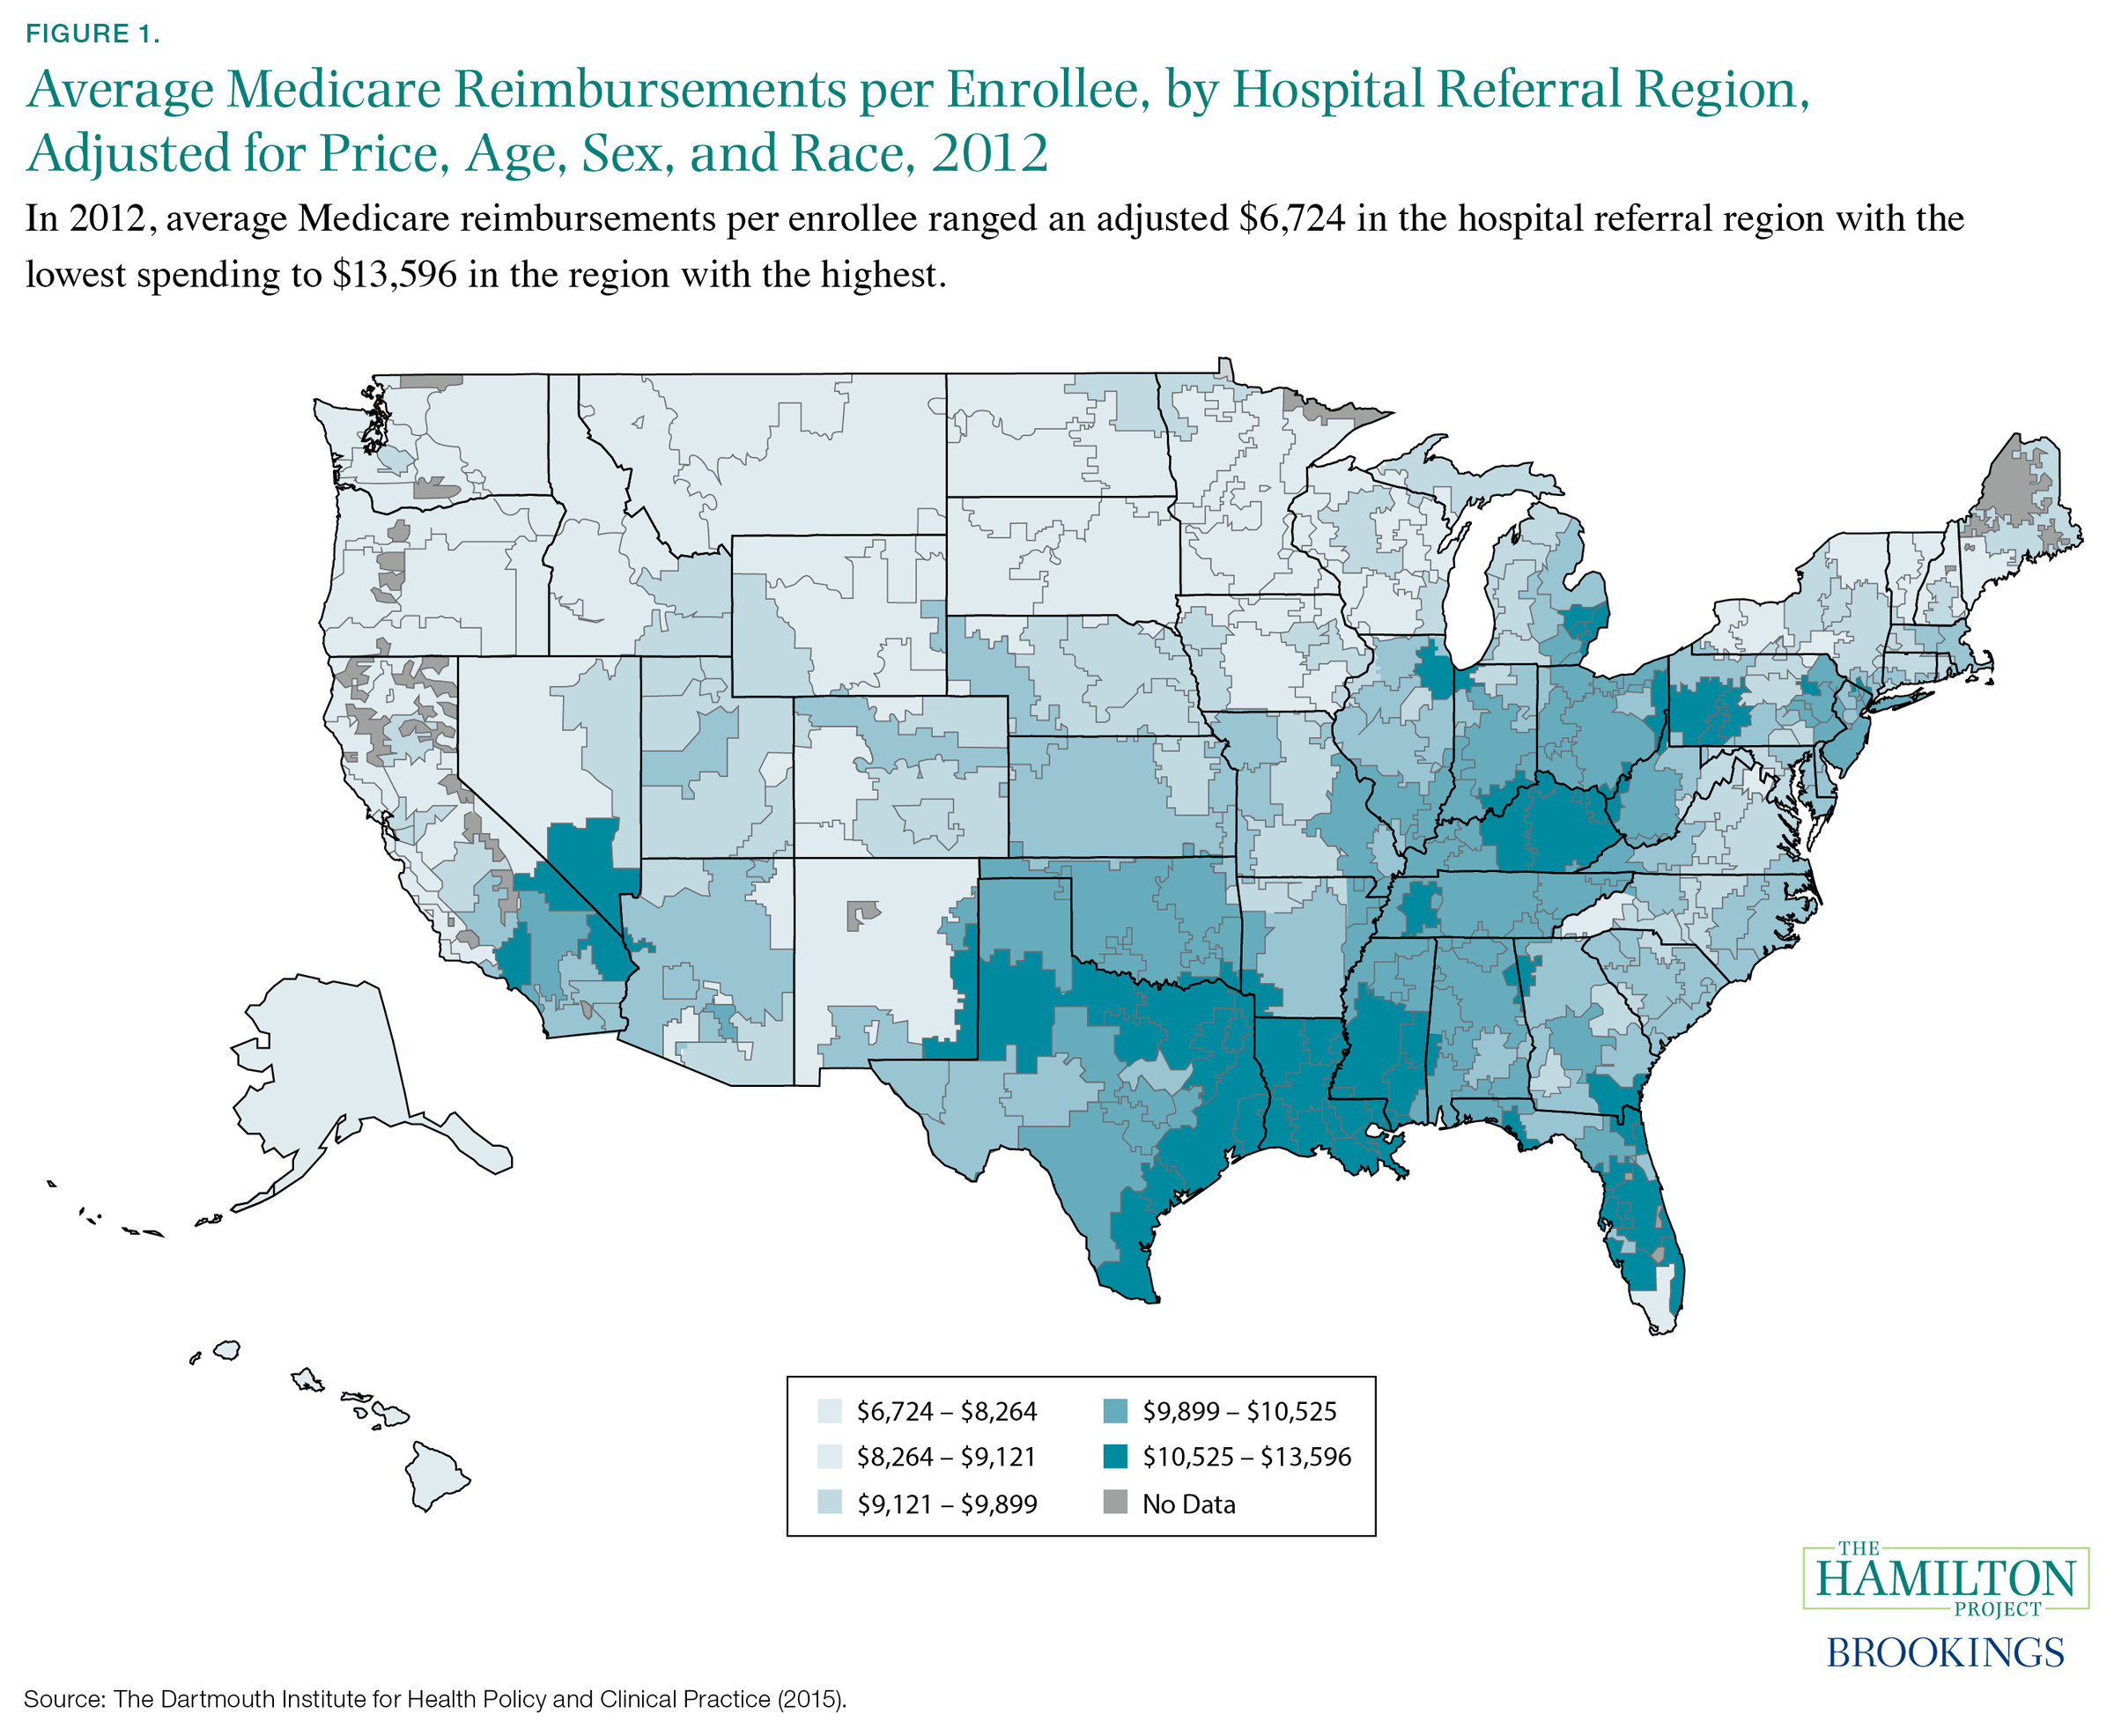
Fact 1. Spending on health-care resources varies widely across the country: spending for the average Medicare enrollee in Miami is nearly 70 percent greater than in Minneapolis.
Spending on health care varies dramatically across the United States. For example, figure 1 shows Medicare spending for the average enrollee in the program after adjusting for prices and demographics for each hospital referral region—areas where people tend to receive medical care from similar providers (Dartmouth Institute for Health Policy and Clinical Practice 2015). Darker regions correspond to higher levels of per enrollee Medicare spending, which is a proxy for other types of health-care spending. Importantly, because these estimates already reflect adjustments for the age, sex, and race characteristics of the regions, as well as cost-of-living differences that contribute to variation in the cost of health care, the regional differences in spending seen in the figure also reflect differences in the use of healthcare services. In 2012 spending for the price- and characteristic-adjusted average Medicare enrollee in Miami (the region with the highest spending) was $13,596, whereas spending for an enrollee in Minneapolis (one of the regions with the lowest spending) was $7,998—a difference of 70 percent.
Figure 1.
Health-care experts debate why regional differences in utilization and spending arise, even after adjusting for the prices and demographics of hospital referral regions (Skinner 2011). One explanation is that areas that tend to have patients with poorer health may use more, or more-costly, care (Chandra and Staiger 2007; Sheiner 2014). Higher spending might also arise in places where patients have stronger preferences for more-expensive treatments. However, it may also be that regional variation in spending arises from differences in the way medicine is practiced, reflecting the incentives that doctors face and the market structure of hospitals (e.g., Cutler et al. 2013; Sutherland, Fisher, and Skinner 2009). In one study, Finkelstein, Gentzkow, and Williams (2014) find roles for both patient and provider explanations, with practice styles and other location-specific factors accounting for roughly half of the regional differences in utilization.
Because there are many reasons why health-care spending and utilization differ across the United States—some of which remain unresolved—policy solutions to address high levels of spending must balance a number of considerations. If patient characteristics were to account for all of the observed variation, changes to practice styles would do little to alter health-care spending. However, if they do not account for all of the observed variation, there may be room to reduce spending by increasing the health benefits produced by a given level of inputs, including medical equipment, hospital beds, physicians, and nurses. By the same token, increasing the productivity of health-care inputs will not equalize health-care spending across the United States due to the variation in patient health and preferences, which suggests that policy interventions to achieve such equalization would be misguided.
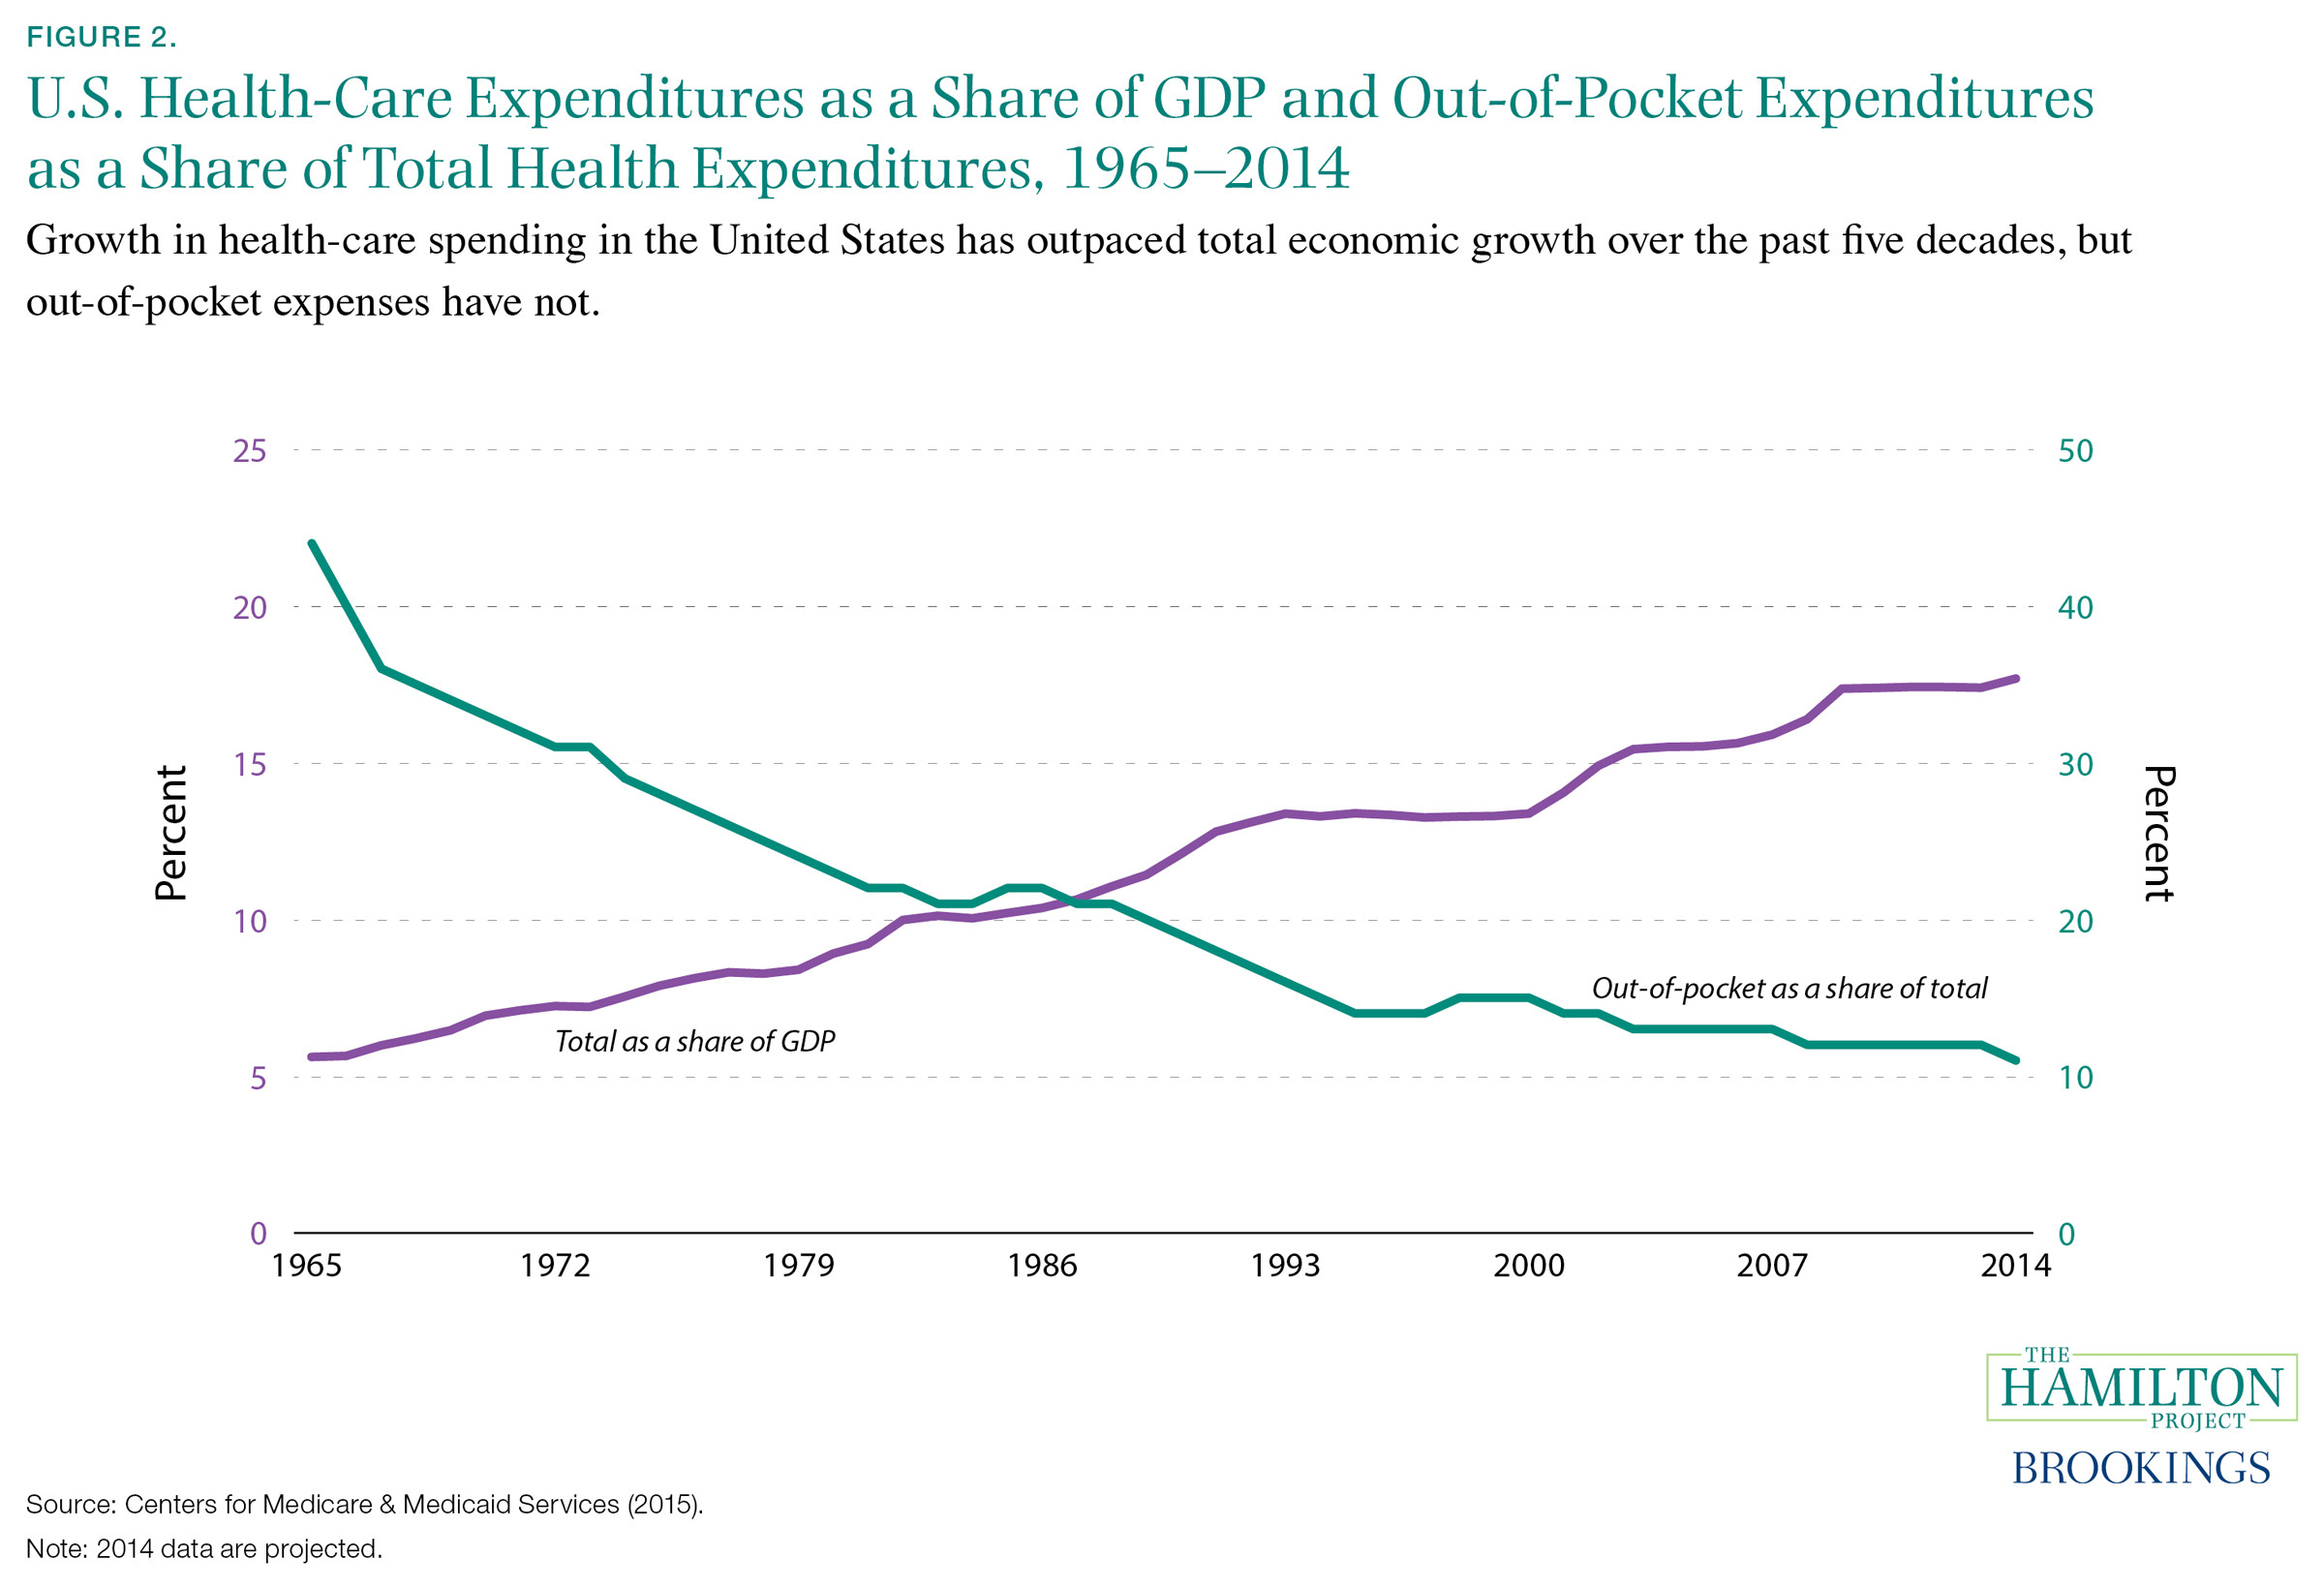
Fact 2. In the United States, health-care spending has nearly doubled as a share of GDP since the 1980’s, but not due to consumers’ out-of-pocket expenses.
For much of the past five decades, growth in spending on health care has been faster than economic growth in the economy as a whole. As shown by the purple line in figure 2, healthcare expenditures in 2014 accounted for an estimated 18 percent of GDP—a marked increase from 6 percent of GDP in 1965 (Centers for Medicare & Medicaid Services [CMS] 2015). However, from 2009 to 2014 total health-care expenditures as a share of GDP have been virtually constant.
The increase in nominal health spending has not been uniform across payers. The public sector’s health expenditures have grown more quickly, mainly through Medicare, the federal government’s health insurance program for individuals over age sixty-five and younger individuals with disabilities; and Medicaid, the public sector’s health insurance program for families with low income and resources. The share of spending by these two programs (not shown) increased from 7 percent of total health spending in 1966 to 36 percent in 2014 (CMS 2015). Patients’ direct payments to health-care providers, also known as out-of-pocket spending, have grown less quickly. As shown by the light green line, out-of-pocket spending (which includes outlays for deductibles, copayments, and coinsurance) as a share of health spending has been trending down, on balance, from 44 percent in 1965 to 11 percent in 2014 (CMS 2015).
Several factors account for the growth in health-care expenditures and the tilt in spending toward Medicare and Medicaid. First, the growing share of Americans over the age of sixty-five has increased enrollment in Medicare and has helped push up health spending because per capita medical costs are higher for those sixty-five and older than they are for younger individuals. Meanwhile, the aging of the population as well as coverage expansions in Medicare and Medicaid have led public sector enrollments to increase at a faster clip than enrollments for private insurance. Second, rising incomes over the past half-century have also led to higher per capita health spending (Smith, Newhouse, and Freeland 2009). Third, despite gradual changes in the way public and private insurers reimburse providers (i.e., physicians, hospitals, and drug companies), the prevalence of the fee-for-service payment model—where insurers reimburse providers based on the number and type of treatments—continues to drive spending growth by rewarding the quantity, but not necessarily the quality, of care provided.
Finally, and most importantly, experts point to the adoption of ever-more-sophisticated—and often very expensive—medical technologies as an important source of growth in health-care spending (Chandra and Skinner 2012). Generally speaking, technological advances have led to productivity gains and improvements in quality in the health-care sector, which have contributed to better health and well-being (Cutler 2004). However, among the many challenges with health-care technology, unlike in other sectors, the users of new treatments (e.g., patients, physicians, and hospitals) face just a fraction of the new treatments’ costs while private insurance companies and taxpayers supporting Medicare and Medicaid—who do not directly use the technology—pay the remaining costs. As a result, the U.S. health-care system often pays for new, more expensive therapies that might not be any more effective than those already in use (Chandra and Skinner 2012). Indeed, private insurers rarely make an explicit comparison between the costs and expected health benefits of new procedures and devices (Skinner 2013), and instead cover treatments that are termed “medically necessary,” where such a designation is determined in part through judicial adjudication.
Figure 2.
Chapter 2. Health-Care spending Among Consumers
Even with insurance, many households still remain vulnerable to depleting their savings in the event that they experience a major illness or injury. Exacerbating this vulnerability, much evidence shows that Americans often choose plans for themselves that lead them to pay more for prescription drug coverage or health insurance than they otherwise need to.
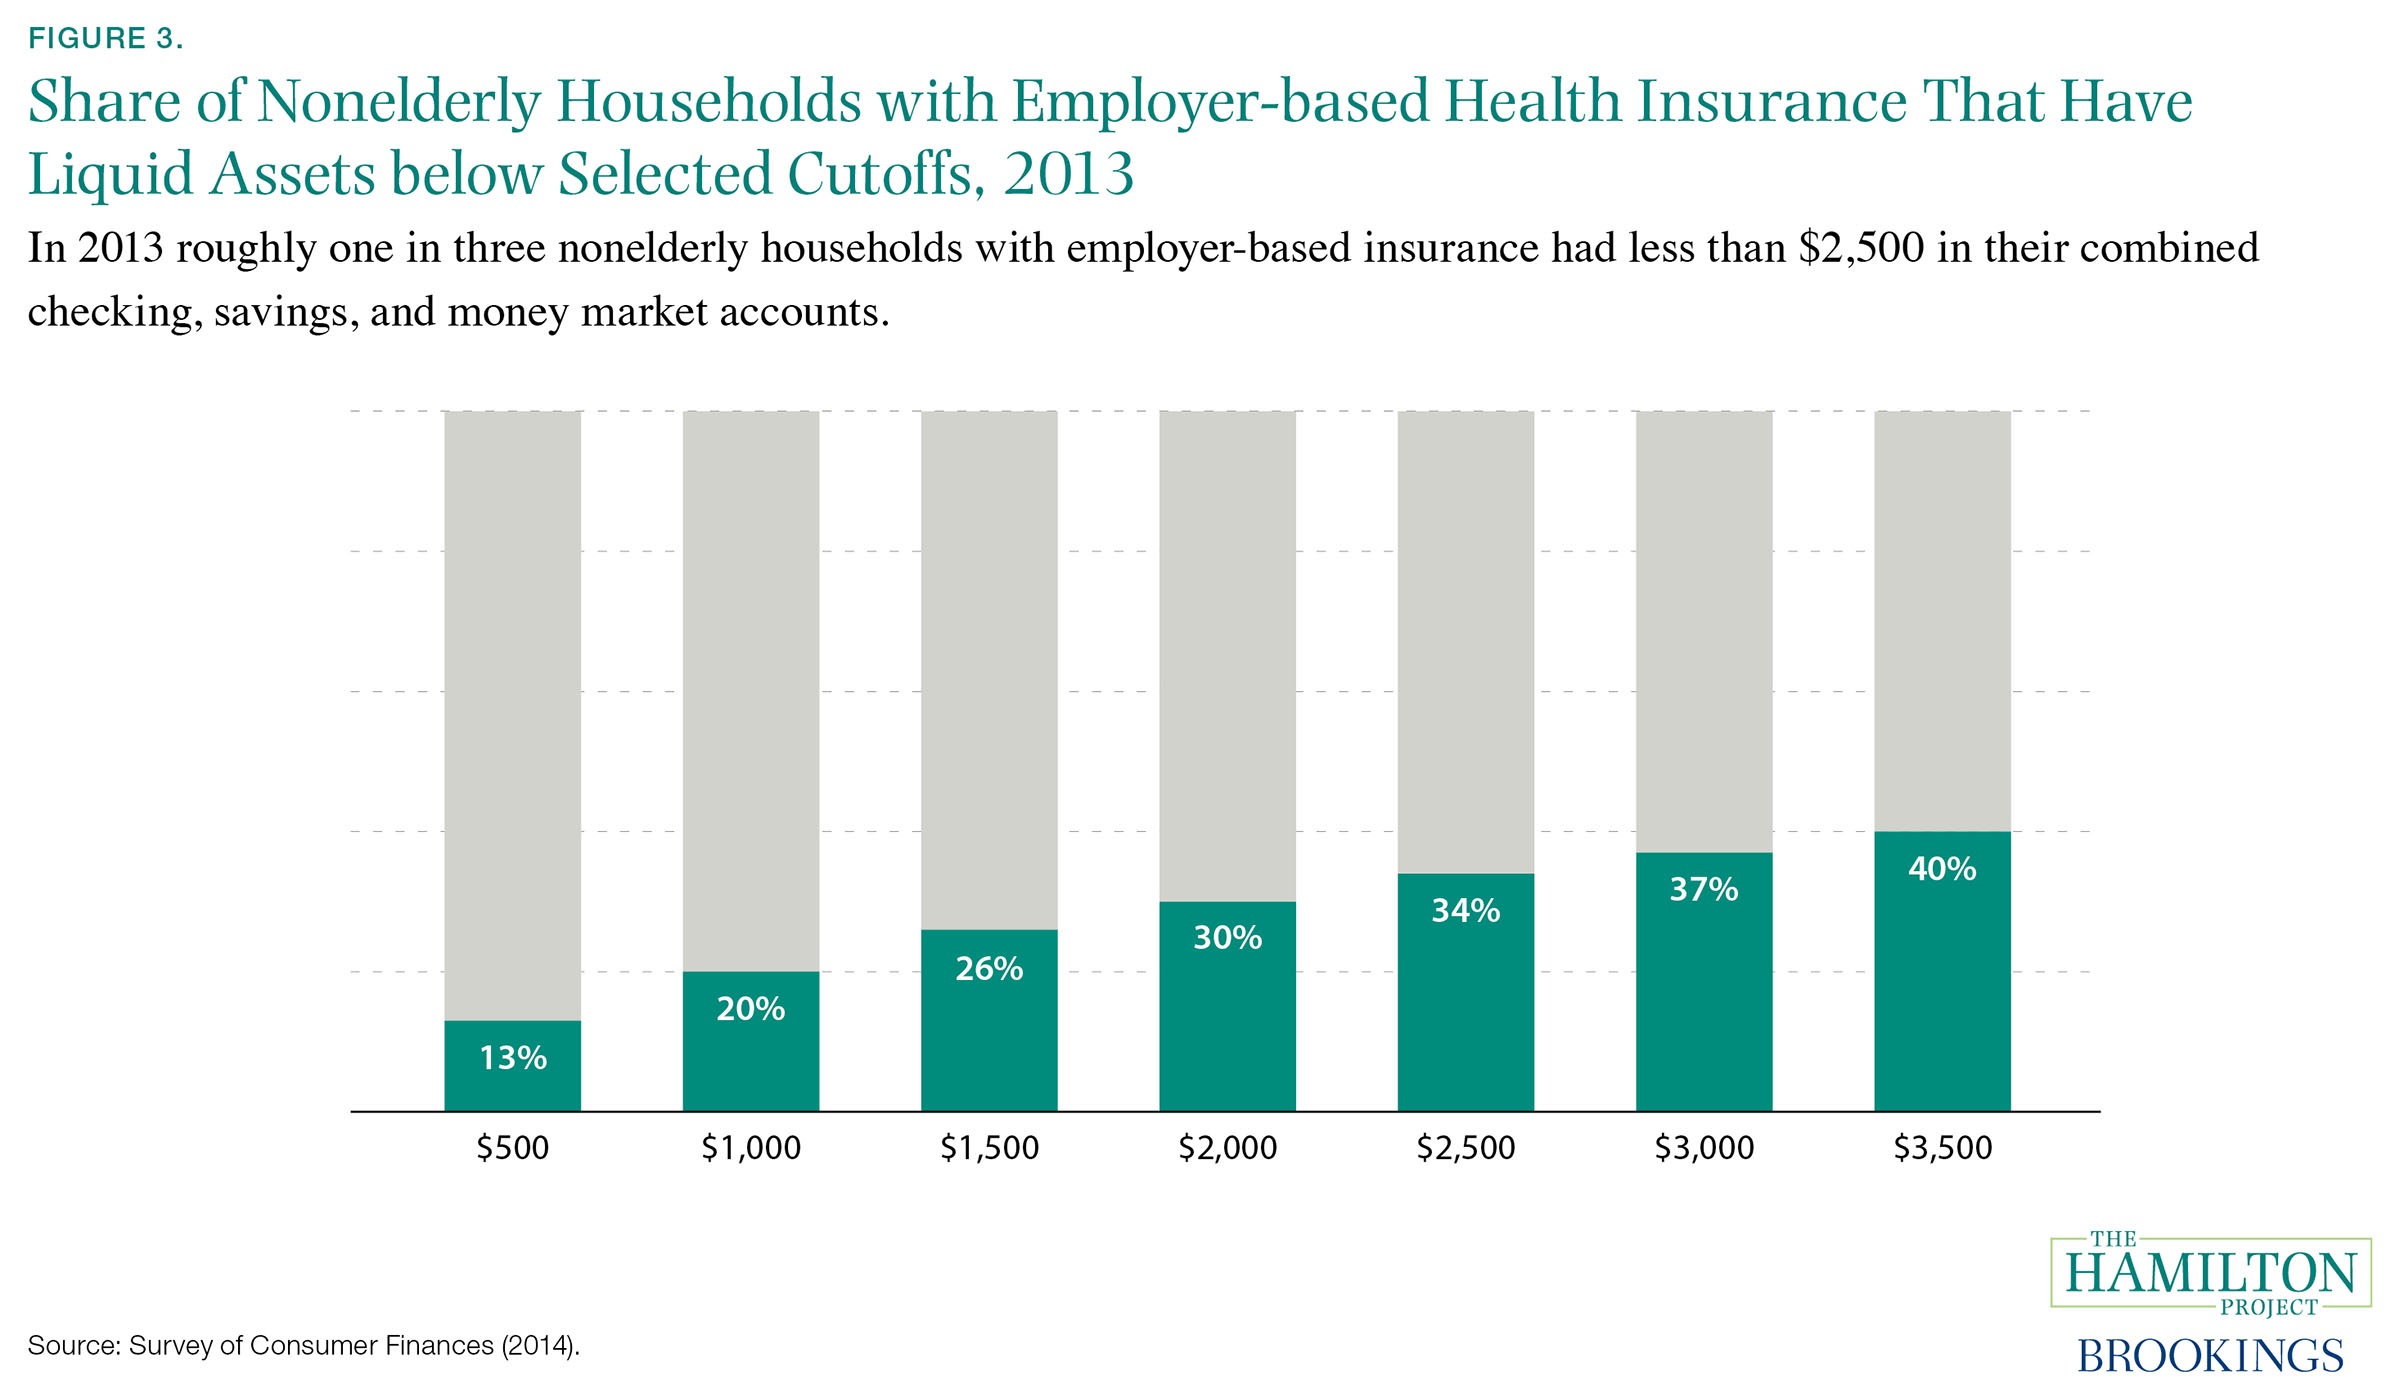
Fact 3. Millions of households with health insurance do not have enough cash on hand to pay out-of-pocket medical expenses in the event of a major health shock.
In 2013 approximately 80 percent of households with health insurance through an employer faced an average annual (family) deductible of roughly $2,500 for nonpreventive care (U.S. Department of Health and Human Services [DHHS] 2014b, 2014c). In the event of a large medical expense, the average household would have had to pay this deductible before plan coverage began. As seen in figure 3, more than one in three nonelderly households with employer-sponsored insurance did not have enough liquid assets—funds in checking, savings, or money market accounts—to meet this average deductible. One in five did not have enough cash on hand to pay a smaller deductible of $1,000. Furthermore, 25 percent of families reported in 2012 that medical care imposed a financial burden (Cohen and Kirzinger 2014).
Extremely large medical expenses are rare for the typical household, but households that do face these costs without sufficient cash must turn to other means: reducing their spending on other goods and services, drawing down a retirement account, or borrowing. In some cases, the least-poor choice may be to forgo needed medical care; but in other cases patients in insured households, along with those without insurance, may have to rely on uncompensated care from hospitals. Annual outlays on uncompensated care are large: in 2012 nonprofit and for-profit hospitals provided nearly $46 billion in uncompensated care to households without the means to pay (Garthwaite, Gross, and Notowidigdo 2015). Nevertheless, many low-income individuals are still susceptible to large medical debts, suggesting that the health-care safety net could be further strengthened (Dranove, Garthwaite, and Ody 2015).
Figure 3.
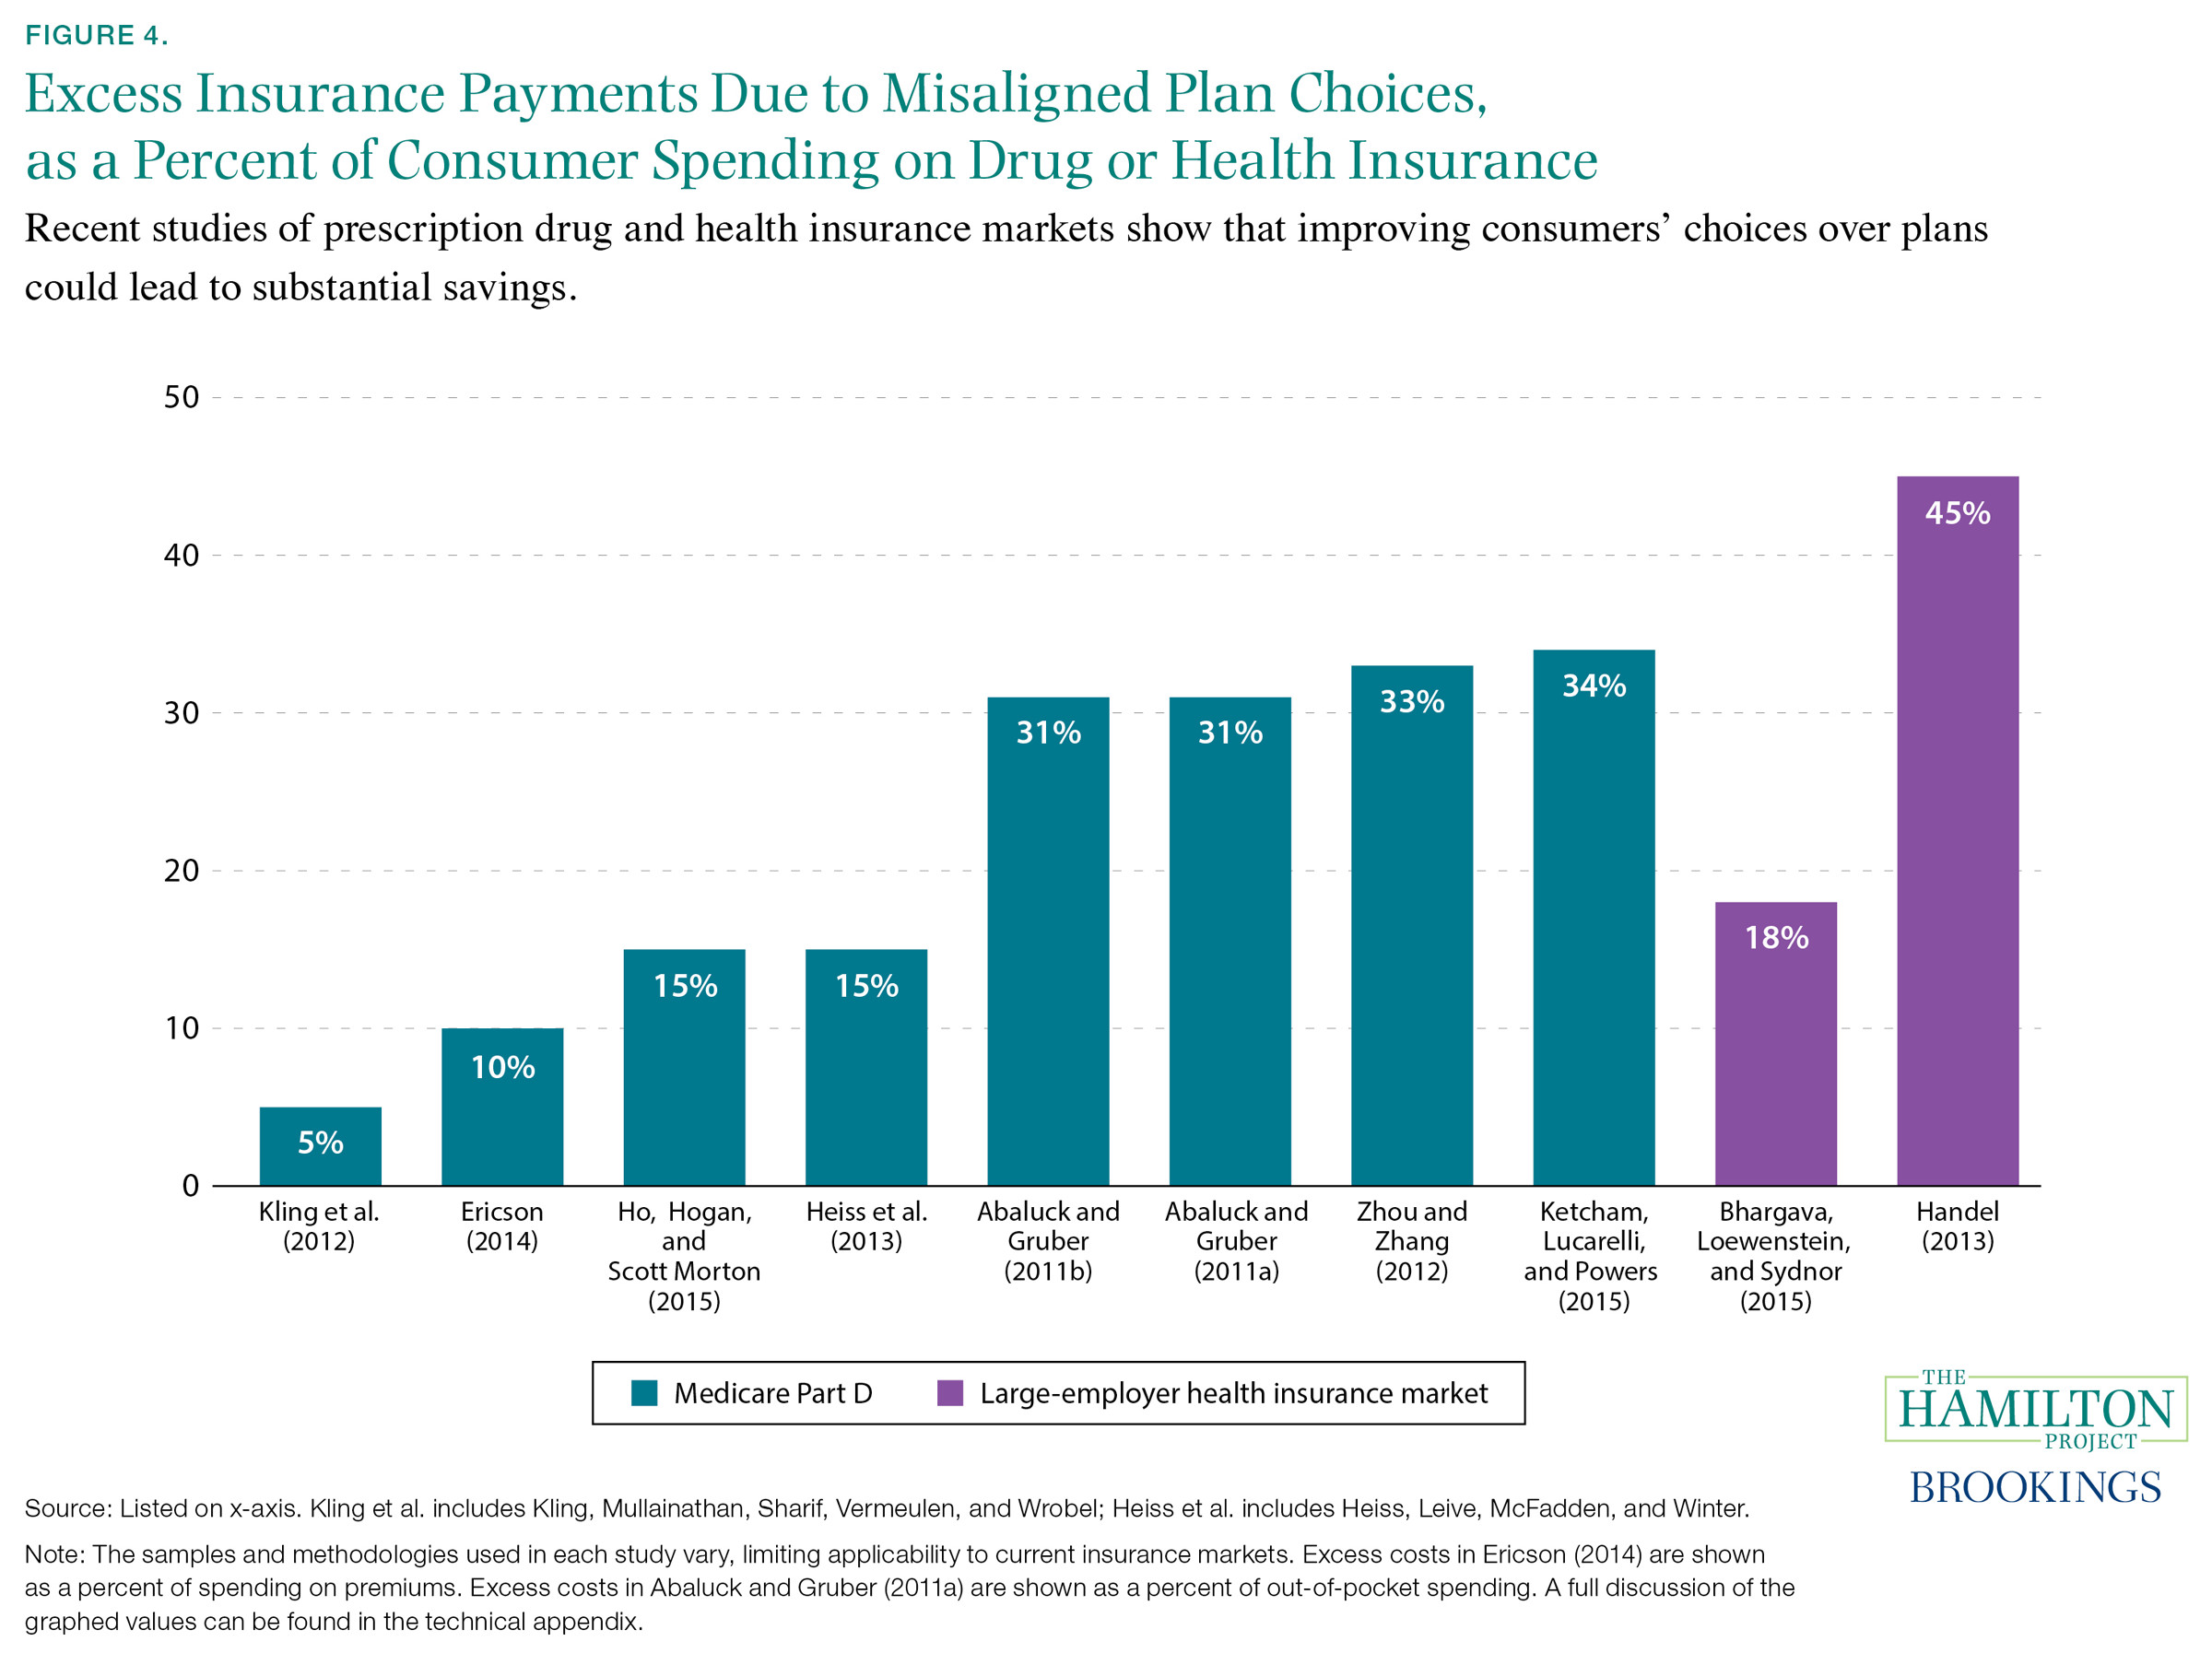
Fact 4. On average, America’s seniors are paying up to 34 percent more than necessary for prescription drug coverage by choosing plans misaligned with their needs.
Several studies find that consumers spend more on health insurance and prescription drug plans than they need to by choosing a plan that is not well-aligned with their needs. As seen in figure 4, among elderly consumers choosing from Medicare Part D prescription plans through private insurers (shown in blue), the average enrollee’s annual spending on premiums and out-of-pocket costs is 5 to 34 percent higher than if she were to choose a lower-cost option providing the same level of coverage. For those choosing from health insurance plans offered by large employers (shown in purple), the excess amount paid by consumers for premiums and out-of-pocket costs is similarly large, ranging between 18 and 45 percent of the total cost of insurance.
This excess spending arises because, for a given level of healthcare utilization, plans differ in how much they charge in upfront premiums and in out-of-pocket costs, and consumers must choose a plan before they precisely know which (and how many) health services they will use. Research finds that many consumers do not understand the components of their plan, including what out-of-pocket costs they will face when receiving care, what medical services and prescription drugs will be covered, and which hospitals and doctors they can use (Loewenstein et al. 2013). In addition, consumers need to make a short-term forecast about the amount and type of health-care services they are likely to need, which then determines their estimated costs given their plan’s deductibles and coinsurance payments. In predicting these costs as they choose among plans, consumers can easily miscalculate their health and financial risks.
Figure 4.
The implied costs can be substantial but experts debate why. In studies of large employer-based plans, Bhargava, Loewenstein, and Sydnor (2015) find that consumers could have saved $353 dollars each year with better-informed plan selection. Handel and Kolstad (2015) find similar evidence on the costs consumers are likely to incur from lacking information about plans’ coverage of providers and treatments. They find that the least-informed consumers pay in excess of $2,000 when choosing a plan relative to the most-informed consumers. In the Medicare Part D prescription drug market, Abaluck and Gruber (2011b) observe that consumers pay too much attention to monthly premiums compared to out-of-pocket costs, and as a result fail to match their individualized needs with the right prescription drug plan—Abaluck and Gruber (2011a) estimate that consumers incur $237 to $296 in excess annual out-of-pocket spending. By contrast, Zhou and Zhang (2012) observe that consumers pay too much attention to out-of-pocket costs and too little attention to monthly premiums when they make their plan choices in Medicare Part D.
Moreover, studies find that consumers exhibit inertia and are slow to switch plans even when it would be financially beneficial for them to do so. In other words, once a consumer has chosen a health plan, she is not likely to switch out of it, even if her needs change over time. The reasons for this inertia range from consumers having incorrect beliefs about the potential gains from switching plans; to consumer inattention, procrastination, and the burden of learning about alternative options (see Handel 2013 for a discussion). Studying enrollment decisions among workers from one large employer, Handel (2013) estimates that inertia leads consumers to incur about $2,000 more in out-of-pocket costs than if they had switched to a plan that was better suited to their needs. Researchers find that participants choosing among Medicare Part D plans have similarly incurred excess expenses and, looking across studies, consumers could save between 5 and 34 percent of their health-care spending dollars, or $50 to roughly $500 annually (Ericson 2014; Ho, Hogan, and Scott Morton 2015; Ketcham, Lucarelli, and Powers 2015; Kling et al. 2012).
The complexity of health insurance decisions—with the need to predict likely use of health care and to understand the cumulative costs for both premiums and out-of-pocket costs—means that consumers are prone to paying more for health insurance than they need to. As a result, and as described in Fact 6, some scholars have discussed the possibility of limiting consumer choice in the selection of health insurance (refer to Fact 6; also see Frank and Lamiraud 2009; Leibman and Zeckhauser 2008; Sinaiko and Hirth 2011). However, as discussed in Gaynor, Ho, and Town (2015), sometimes consumers are able to improve upon past decisions. For example, Ketcham, Lucarelli, and Powers (2015) note that Medicare Part D plan holders incurring the largest excess health insurance expenses after selecting a plan in 2006 were more likely to switch to less-expensive plans the following year. After five years of enrollment, annual out-of-pocket costs declined notably but were still about 21 percent more for these consumers than if they had instead selected the minimum-cost plan available in that year.
Chapter 3. Choosing Among Employer-Sponsored Plans
Through employers, private insurers offer Americans numerous health insurance options that vary in coverage and cost. Choosing the right plan entails navigating many complex dimensions of insurance plans and weighing them against the risk of needing care.
Fact 5. Over the past three decades the percent of American workers enrolled in conventional health insurance plans has declined from 73 percent to less than 1 percent.
During the past twenty-five years, the types of employer-based health insurance plans covering workers have changed dramatically. Conventional plans, shown in light green (figure 5), were formerly the dominant type and covered all services and providers in exchange for a monthly premium. Today, the preferred provider organization (PPO) health insurance plan, shown in light blue, is the most commonly purchased option, covering 58 percent of eligible employees. PPO plans provide access to similar insurance coverage for services as a conventional plan but, typically, for a lower premium. In exchange, PPO plans charge beneficiaries a higher rate for services obtained from providers outside a network of preferred providers.
While PPO plans are the dominant plan today, some workers are choosing other insurance options, such as health maintenance organization (HMO) plans. These plans also feature low premiums but have more-restrictive provider networks than PPOs and account for a dwindling share of covered workers. Point-of-service (POS) plans, covering 8 percent of workers in 2014, allow patients to venture outside of the network at a higher cost, similar to a PPO. However, POS plans feature generally lower copayments, and in exchange patients must pay an annual deductible out-of-pocket before receiving coverage. High-deductible health plans with savings options (HDHP/SOs) are the newest type of plan, enrolling one in five workers in 2014. HDHP/SOs are similar to the POS model but feature even lower premiums and higher annual deductibles, often in the $2,000 to $3,000 range for single coverage (Claxton et al. 2014). In order to help consumers to pay these deductibles, HDHP/SOs are generally coupled with tax-preferred health savings options.
Figure 5.
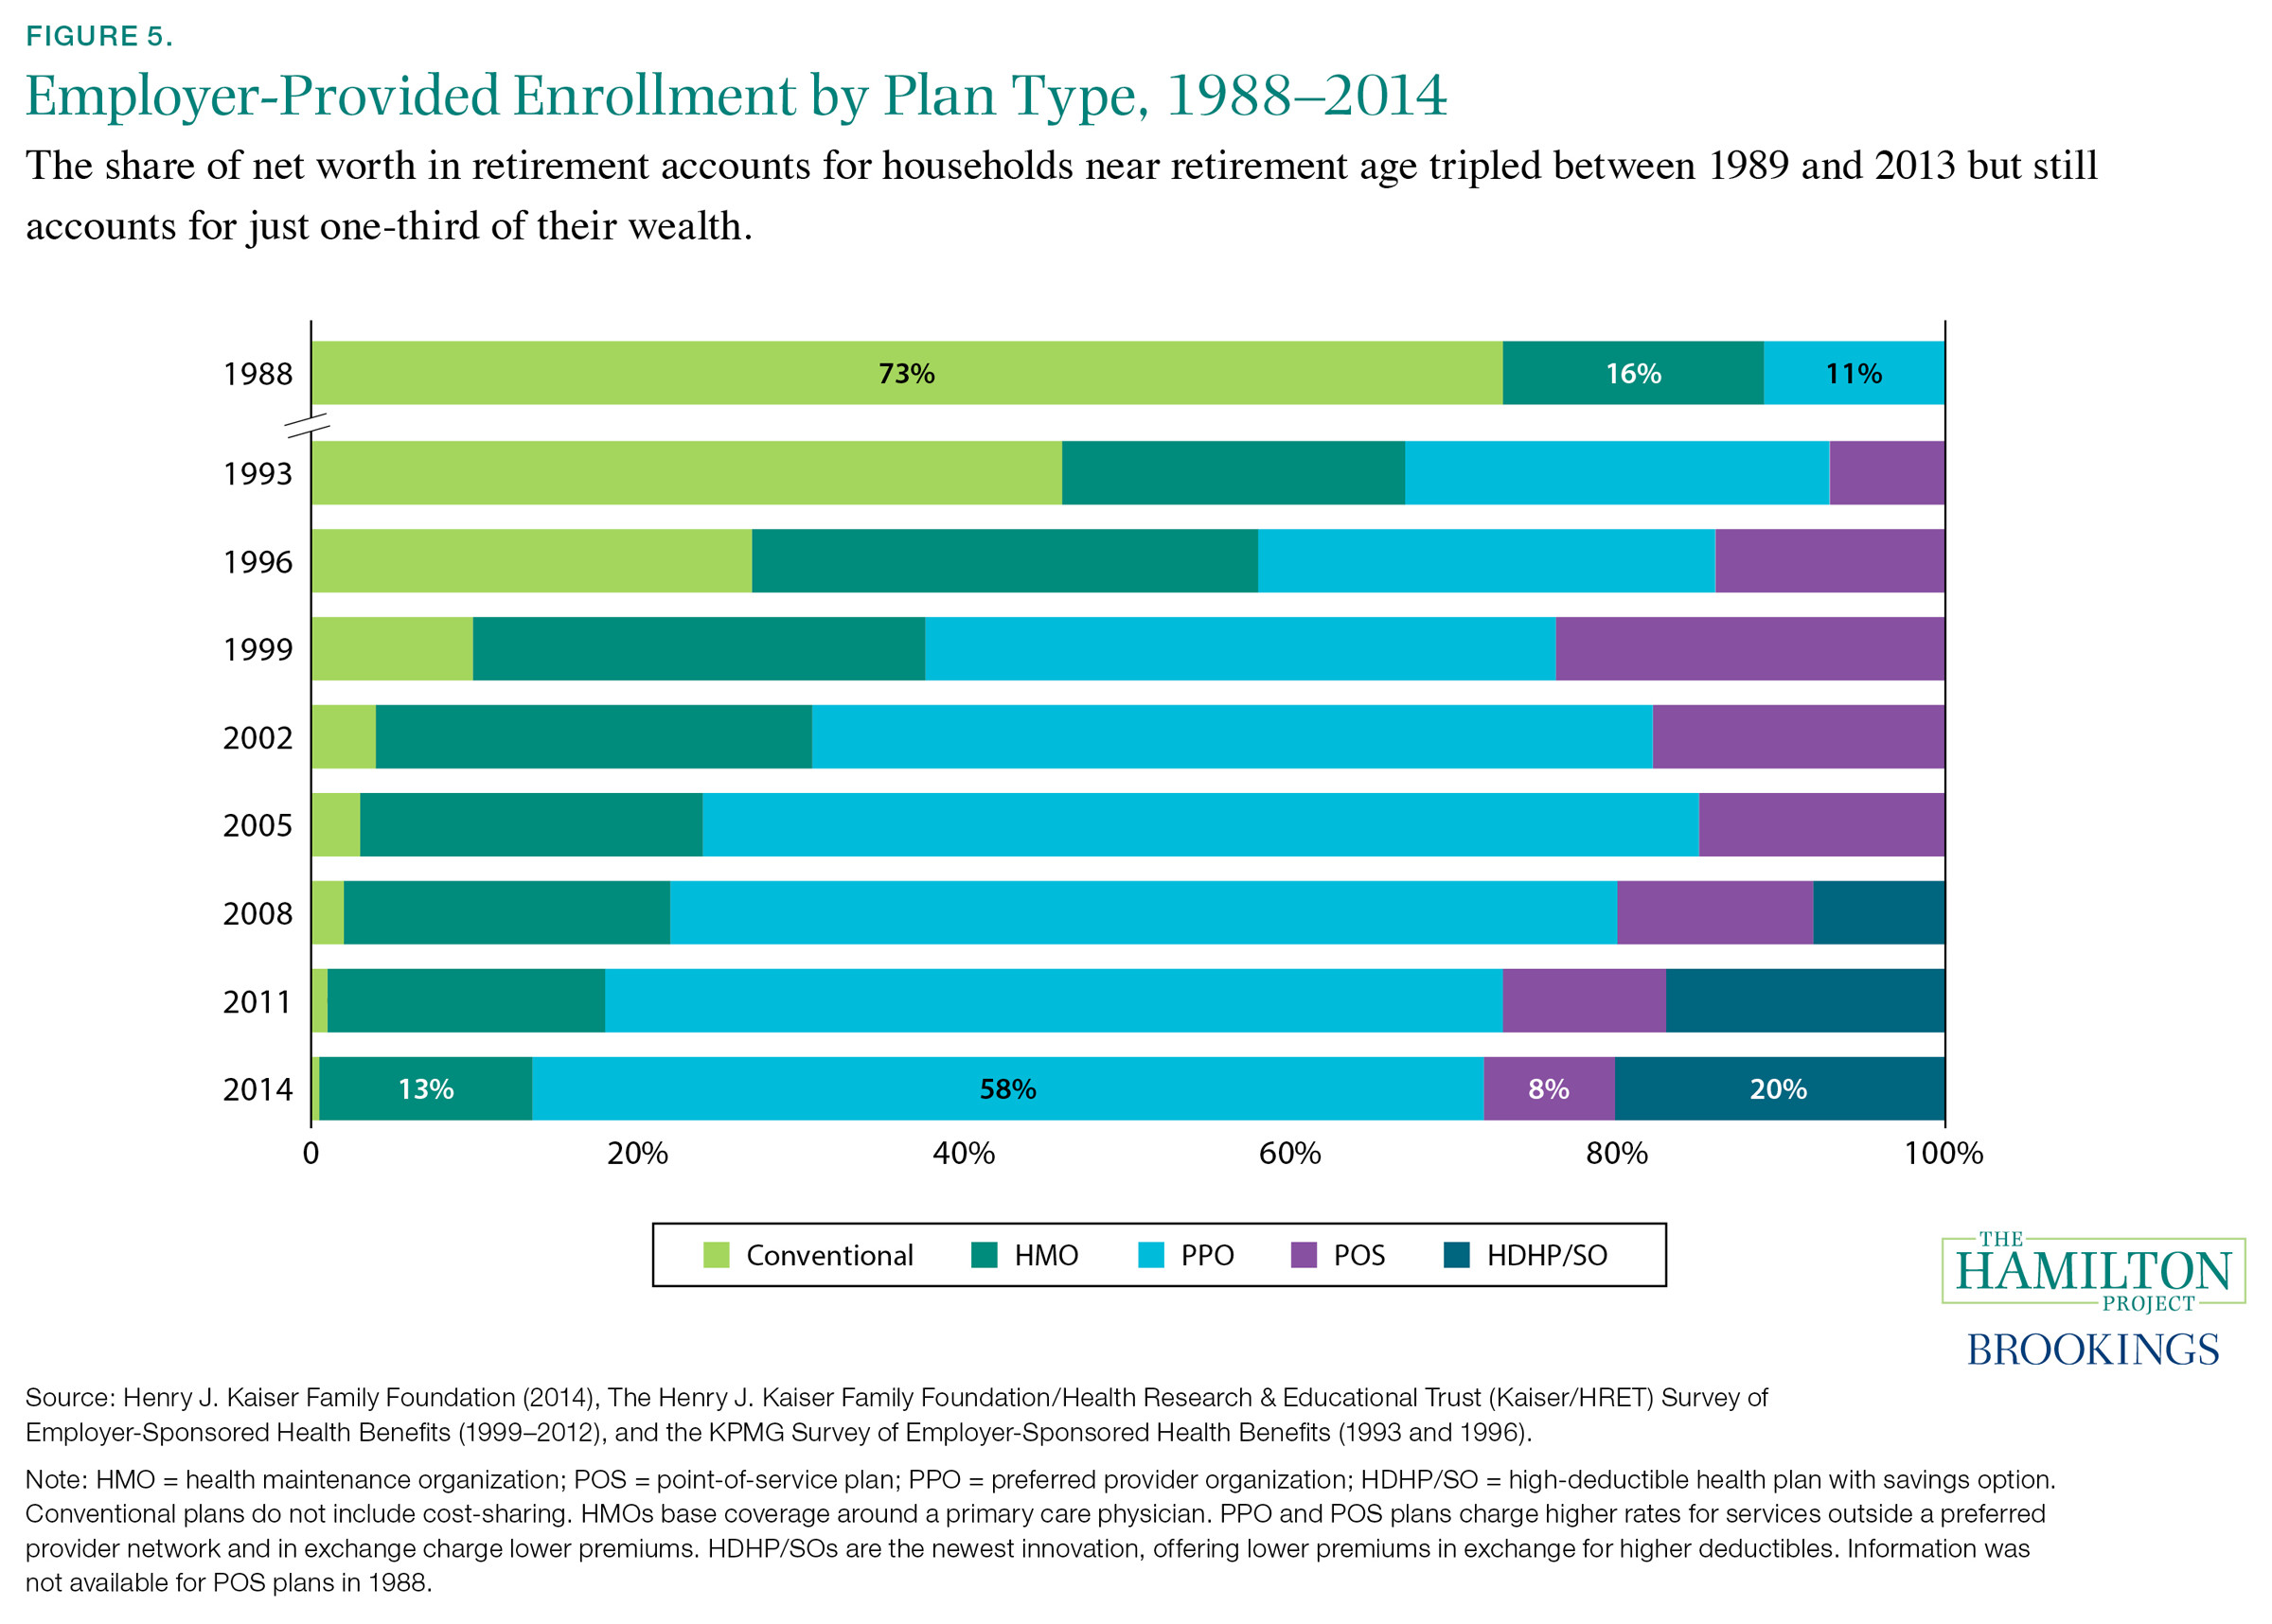
These changes reflect a shift in the health insurance industry toward greater cost-sharing, where patients pay for a portion of their medical bills, and a narrowing of provider networks that have led to lower negotiated provider prices. In conventional plans that were previously dominant, patients did not face any financial costs when obtaining additional treatments because their insurance provider fully covered their health services (Feldstein and Gruber 1994). To curb potentially unnecessary spending, insurance companies introduced cost-sharing mechanisms like copayments and deductibles to make beneficiaries more responsive to the price of their care. Evidence suggests that utilization of these types of consumer incentives has helped slow the growth rate of health expenditures, as discussed in Fact 2 (Chandra, Holmes, and Skinner 2013).
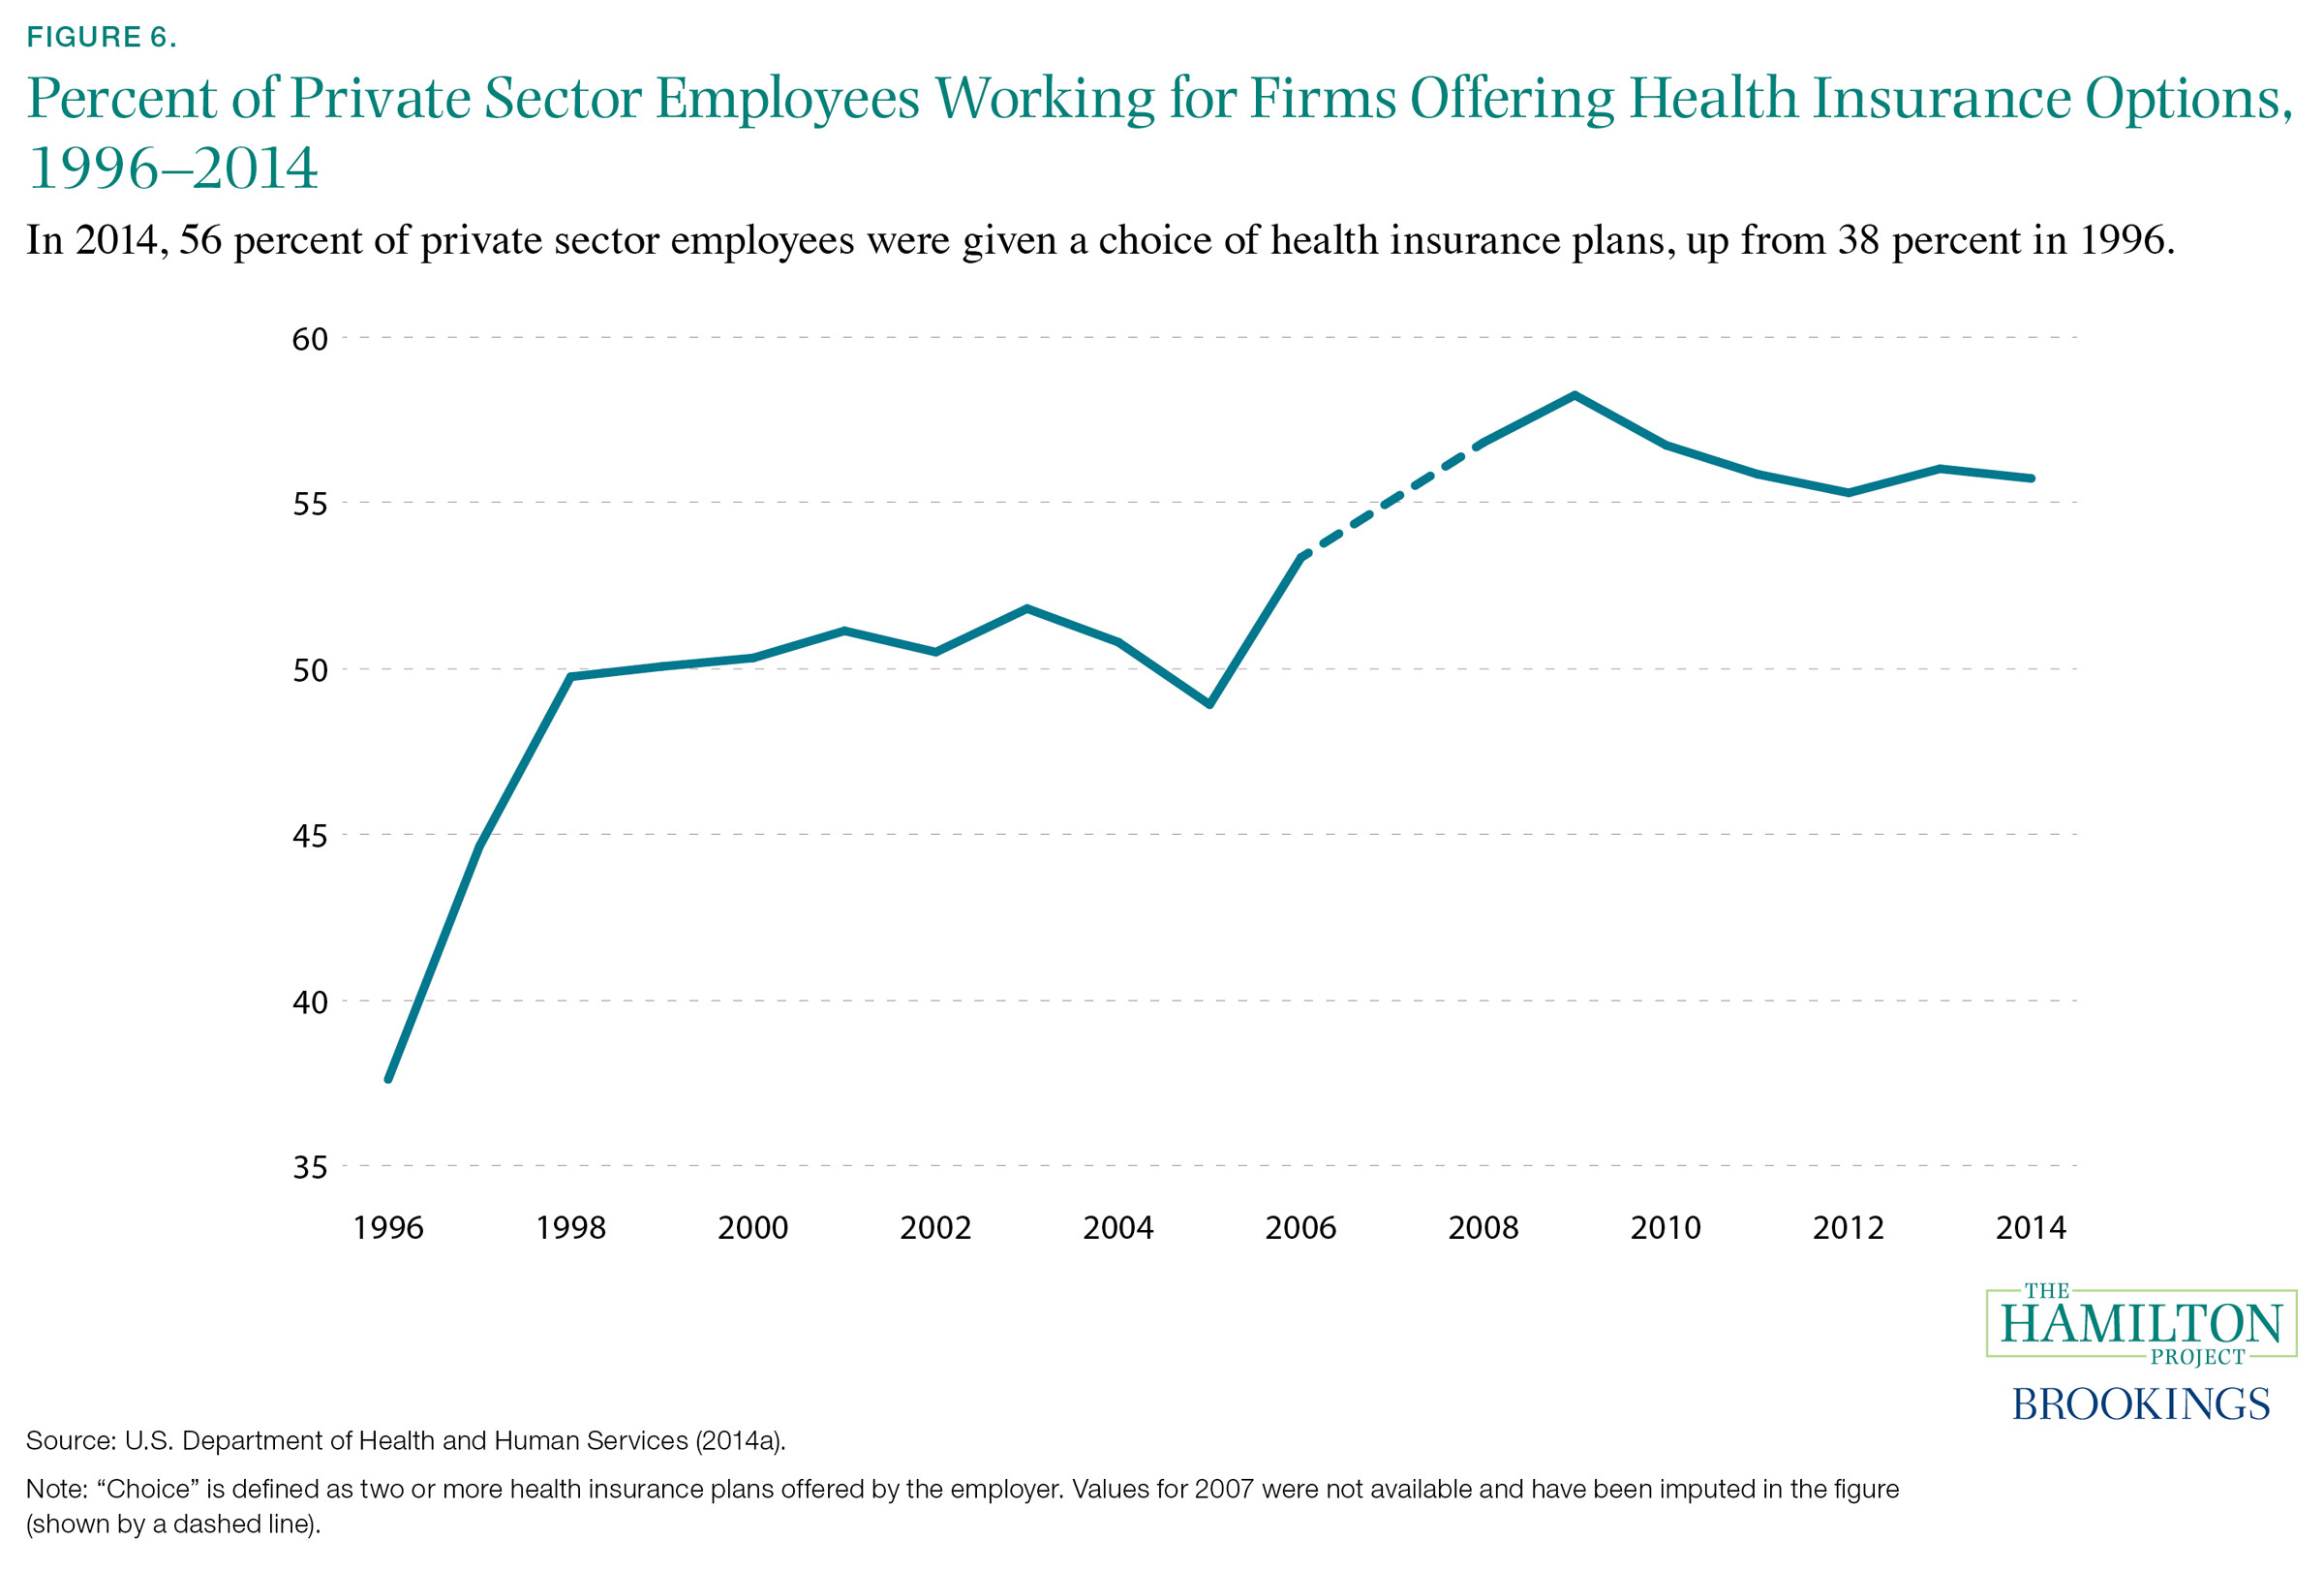
Fact 6.Over the past two decades, there has been a nearly 50 percent increase in the share of private sector workers who are offered a choice of health insurance plans.
Of the roughly 116 million Americans working in the private sector in 2014 (DHHS 2014b), 56 percent were able to choose their health insurance plan from more than one employer-sponsored option, up from 38 percent in 1996 (DHHS 2014a). This rising trend reflects, in part, employers voluntarily offering more options and insurance companies creating more plan options.
Consumer choice in selecting health insurance plans also extends to Americans who obtain insurance outside of the employer-sponsored system. For instance, part-time workers and contractors may purchase health insurance through the federal or state health insurance marketplaces where they may choose among four tiers of plans from numerous issuers (Burke, Misra, and Sheingold 2014). Also, those receiving Medicare—the federal health insurance program for people aged sixty-five or older and younger individuals with disabilities—must choose between traditional Medicare or one of numerous Medicare-approved plans from private insurers (also known as Medicare Advantage). Medicare Part D, the prescription drug plan for elderly households, offers thirty different plans, on average, with no fewer than twenty four plans available in each state (Hoadley et al. 2014).
Choosing a health insurance plan can be complicated. Typically, enrollees are asked to consider at least four dimensions in selecting coverage: (1) premiums and expected out-of-pocket expenses, (2) coverage and benefit levels, (3) access to doctors and hospitals, and (4) the availability of health and wellness resources to help them stay healthy (United Healthcare n.d.a). For enrollees, calculating the cost they will likely face for a health plan is further complicated by the ways different plans treat premiums (monthly coverage payments), deductibles (the amount enrollees must pay before health-care providers cover the remaining costs), copayments and coinsurance (what enrollees pay every time they use a service, as a set fee or as a percent of the bill, respectively), out-of-pocket maximums, and health savings accounts (Claxton, Cox, and Rae 2015). In assessing the expected costs and benefits of each available plan, enrollees must project what their risk is of requiring medical treatment, and for families buying insurance, enrollees must undertake these complex calculations for each member (United Healthcare n.d.b).
Figure 6.
Given the complexity of the choices, it is not surprising that many studies find consumers select plans that are not well aligned to their expected needs and preferences (Frank and Lamiraud 2009; Leibman and Zeckhauser 2008; Sinaiko and Hirth 2011; also see figure 4). For instance, individuals who are healthier or more willing to take risks sometimes choose plans with high premiums and coverage levels, when they could choose lower-premium- and less-extensive-plans that more closely align to their risk tolerance and expected medical needs. Studies have also shown that facing too many choices can be overwhelming for consumers, reducing their ability to discern among options and causing them to make worse decisions for themselves (Cronqvist and Thaler 2004; Iyengar and Lepper 2000). Moreover, enrollees in health insurance do not change insurance plans frequently, so even if their current plan is not well-aligned with their preferences or if their expected coverage needs—and optimal insurance coverage—change, they tend not to switch. As discussed more fully in Fact 4, the cost of making these mistakes can be quite high, pointing to a role for policy interventions to aid consumer decision-making.
However, even if consumers were to choose insurance policies that are more closely aligned with their risk tolerance and expected medical needs, it might not necessarily make them better off, due to offsetting factors at work in the health insurance market, which in turn presents challenges and trade-offs for those offering and designing health insurance plans. More specifically, in health insurance markets, when consumers choose plans in their best interest, healthier individuals will opt to purchase cheaper options with less coverage while less-healthy individuals buy more comprehensive and more-expensive plans (McGuire 2012; Rothschild and Stiglitz 1976). If this segmentation is severe enough, then adverse selection in the insurance market can lead insurers to offer only more-comprehensive plans—at higher prices—to the small group of individuals requiring more-expensive treatments, thus deterring both healthy and unhealthy individuals from purchasing insurance (Cutler and Reber 1998). Indeed, Handel (2013) provides an example of how consumers making better choices for themselves can lead to lower overall welfare due to these off-setting factors.
Technical Appendix
Fact 1: Spending on health-care resources varies widely across the country: spending for the average Medicare enrollee in Miami is nearly 70 percent greater than in Minneapolis.
Figure 1. Average Medicare Reimbursements per Enrollee, by Hospital Referral Region, Adjusted for Price, Age, Sex, and Race, 2012
Source: The Dartmouth Institute for Health Policy and Clinical Practice (2015).
Note: Hospital referral regions are defined by assigning hospital service areas to the region where the greatest proportion of major cardiovascular procedures are performed, with minor modifications to achieve geographic contiguity, a minimum population size of 120,000, and a high localization index. A hospital service area is a collection of zip codes whose residents receive most of their hospitalizations from the hospitals in that area. Medicare reimbursements shown in the figure correspond to a random sample of enrollees belonging to both the Medicare A (inpatient) and B (physician services) programs.
Fact 2: In the United States, health-care spending has nearly doubled as a share of GDP since the 1980s, but not due to consumers’ out-of-pocket expenses.
Figure 2: U.S. Health Care Expenditures as a Share of GDP and Out-of-Pocket Expenditures as a Share of Total Health Expenditures, 1965–2014
Source: Centers for Medicare & Medicaid Services (2015).
Note: Data are from the Centers for Medicare & Medicaid Services’ (2015) National Health Expenditure Accounts. “Out-of-pocket as a share of total” is calculated by dividing, for each year shown, nominal out-of-pocket health-care spending by total nominal health-care spending. “Total as a share of GDP” is calculated by dividing, for each year shown, total nominal health-care spending by nominal GDP.
Fact 3: Millions of households with health insurance do not have enough cash on hand to pay out-of-pocket medical expenses in the event of a major health shock.
Figure 3: Share of Nonelderly Households with Employer-based Health Insurance that have Liquid Assets below Selected Cutoffs, 2013
Source: Survey of Consumer Finances (2014).
Note: Estimates are from the 2013 Survey of Consumer Finances (2014) based on a sample of households whose net worth is below the 90th percentile, whose head is younger than 65, and who have health insurance other than Medicaid. In the figure, each bar is calculated by dividing the number of these households that have liquid assets below the shown cutoff by the total number of households in the sample. All estimates are weighted to account for the over-sampling of high-net-worth households.
Fact 4: On average, America’s seniors are paying up to 34 percent more than necessary for prescription drug coverage by choosing plans misaligned with their needs.
Figure 4: Excess Insurance Payments due to Misaligned Plan Choices
Note: The following presents a short summary of the studies cited in the graph. As noted, in a few of the cited studies the denominator is not total consumer costs, but rather out-of-pocket costs or premiums. In some of the studies, the share of total consumer costs was not drawn from direct estimates in the study but was instead calculated using the study’s separate estimates for excess consumer costs and total consumer costs.
In Kling et al. (2012), recipients of a letter detailing personalized cost information were more likely to switch to lower-cost Medicare Part D prescription drug plans(28 percent versus 17 percent among the control group), and savings for the entire intervention group—not just those who switched plans—were about $100, or 5 percent of the average predicted cost of the control group. Ericson (2014) examines Medicare Part D plan data and shows that insurance providers engage in an “invest then harvest” strategy, setting premiums lower initially to attract consumers and relying on their inertia once they have settled into a plan to retain them while raising prices. Ericson finds that plans in their fifth year price premiums 10 percent higher, or about $50 more, per year, than equivalent plans that were newly introduced.
Ho, Hogan, and Scott Morton (2015) use detailed data on Medicare Part D enrollees from New Jersey to simulate a model of consumer plan choice with inattentive consumers and a model of firm pricing to determine how premiums and out-of-pocket consumer spending changes when consumer inattention is removed and premiums adjust accordingly. The authors find per person spending over the three-year period 2007–2009 would fall from $3,809.90 to $3,246.50, resulting in savings of $563.40, or 14.8 percent of baseline costs. Heiss et al. (2013) examine Medicare Part D enrollment choices using a large random sample from the Centers for Medicare and Medicaid Services and find that consumers have expected excess spending of about $300 per year, or 15 percent of total expected out-of-pocket costs and insurance coverage.
Abaluck and Gruber (2011b) estimate that Medicare Part D plan holders could save 30.9 percent of their total spending by choosing the lowest-cost plan. The authors employ a perfect foresight model of expectations using actual expenditures from 2006 to estimate cost savings from switching plans. Abaluck and Gruber (2011a) employ a unique prescription drug data set containing information about drug utilization and plan choice under Medicare Part D and determine that in 2005, only about 12 percent of patients chose cost-minimizing plans and that enrollees could save $296 dollars, or 31 percent of out-of-pocket costs, if they chose the cost-minimizing plan rather than the plan they actually selected (refer to table 1 of the authors’ paper).
In Zhou and Zhang (2012), the actual costs of drugs used in 2009 for a sample of Medicare Part D enrollees was calculated for each available plan, and then the lowest-cost plan was compared to the enrollees’ actual plan. Median overspending for prescription drug coverage was $331. The value shown in the graph (33.4 percent) is the median overspending divided by the median annual patient spending (out-of-pocket costs plus premiums) for 2009, estimated at $990.
Ketcham, Lucarelli, and Powers (2015) observe that in 2006 above-minimum spending among Medicare Part D enrollees was $514, or 33.8 percent of total spending (which includes out-of-pocket expenses and premiums). The sample only includes those consumers that were enrolled in a prescription drug plan from the beginning of 2006 to the end of 2010 and did not receive a low-income subsidy during this period. Bhargava, Loewenstein, and Sydnor (2015) employ plan enrollment data from a large firm in 2010–11 to examine workers’ health insurance choices. They find that employees enrolled in plans with deductibles less than $1,000 could have saved an average of $353 in after-tax dollars if they had instead selected the plan with the $1,000 deductible. To arrive at 18.1 percent—the share reported in figure 4—the amount that employees could save from switching to the plan with the $1,000 deductible is divided by total employee medical spending on premiums and out-of-pocket expenses (given as $1,947 in table 2 of the authors’ paper). The actual share of employee spending that could be saved from switching plans will vary to the extent that total medical spending for those changing plans differs from the mean value reported in table 2. In Handel (2013), health insurance choices of employees at a large firm are studied from 2004 to 2009. The share of excess costs due to consumer inertia is 45.2 percent, calculated as the amount forgone by the average employee ($2,032; see table 5 of the author’s paper) divided by the total spent annually on health insurance by the average employee’s family ($4,500).
Fact 5: Over the past three decades the percent of American workers enrolled in conventional health insurance plans has declined from 73 percent to less than 1 percent.
Figure 5: Employer-Provided Enrollment by Plan Type, 1988–2014
Source: Henry J. Kaiser Family Foundation (2014), The Henry J. Kaiser Family Foundation/Health Research & Educational Trust (Kaiser/HRET) Survey of Employer-Sponsored Health Benefits (1999–2012), and the KPMG Survey of Employer-Sponsored Health Benefits (1993 and 1996).
Note: Estimates are from the Henry J. Kaiser Family Foundation (2014), which combined the results of their annual Survey of Employer-Sponsored Health Benefits with the results from the 1993 and 1996 KPMG Survey of Employer-Sponsored Health Benefits. A portion of the change in plan type enrollment for 2005 is likely attributable to incorporating more-recent U.S. Census Bureau estimates of the number of state and local government workers, and to removing federal workers from the weights. See the Survey Design and Methods section from the 2014 Employer Health Benefits Survey for additional information.
Fact 6: Over the past two decades there has been a nearly 50 percent increase in the share of private sector workers who are offered a choice of health insurance plans.
Figure 6: Percent of Private-Sector Employees Working for Firms Offering Health Insurance Options, 1996–2014
Source: U.S. Department of Health and Human Services (2014a).
Note: Estimates for this figure come from the Medical Expenditure Panel Survey (or MEPS) for the years 1996 to 2006 and 2008 to 2014. (As noted in the figure, MEPS data for this panel were not available for 2007; this is due to the transition from retrospective to current data collection.) To calculate the percent of private sector employees working for firms offering health insurance choices, annual values for the percent of private sector employees working in establishments that offer two or more health insurance plans among firms offering health insurance (DHHS 2014a, Table I.B.2.c) were multiplied by the corresponding annual values for the percent of private-sector employees in establishments that offer health insurance (DHHS 2014a, Table I.B.2). For additional information regarding how this information was collected, refer to the MEPS. Private sector employees are defined as full- or part-time workers; this category excludes contract laborers.
References
Abaluck, Jason, and Jonathan Gruber. 2011a. “Heterogeneity in Choice Inconsistencies among the Elderly: Evidence from Prescription Drug Plan Choice.” American Economic Review 101 (3): 377–81.
2011b. “Choice Inconsistencies among the Elderly: Evidence from Plan Choice in the Medicare Part D Program.” American Economic Review (June): 1180–1210.
Bhargava, Saurabh, George Loewenstein, and Justin Sydnor. 2015, May. “Do Individuals Make Sensible Health Insurance Decisions? Evidence from a Menu with Dominated Options.” Working Paper 21160, National Bureau of Economic Research, Cambridge, MA.
Burke, Amy, Arpit Misra, and Steven Sheingold. 2014, June 18. “Premium Affordability, Competition, and Choice in the Health Insurance Marketplace, 2014.” ASPE Research Brief, Office of the Assistant Secretary for Planning and Evaluation, U.S. Department of Health and Human Services, Washington, DC.
Centers for Medicare & Medicaid Services (CMS). 2015. “National Health Expenditure Data.” Research, Statistics, Data and Systems, U.S. Department of Health and Human Services, Washington, DC. https://www.cms.gov/Research-Statistics-Data-and-systems/Statistics-Trends-and-reports/NationalHealthExpendData/index.html.
Chandra, Amitabh, Jonathan Holmes, and Jonathan Skinner. 2013, Fall. “Is This Time Different? The Slowdown in Health Care Spending.” Brookings Papers on Economic Activity, Brookings Institution, Washington, DC.
Chandra, Amitabh, and Jonathan Skinner. 2012. “Technology Growth and Expenditure Growth in Health Care.” Journal of Economic Literature 50 (3): 645–80.
Chandra, Amitabh, and Douglas O. Staiger. 2007. “Productivity Spillovers in Health Care: Evidence from the Treatment of Heart Attacks.” Journal of Political Economy 115 (1): 103–40.
Claxton, Gary, Cynthia Cox, and Matthew Rae. 2015, February 11. “The Cost of Care with Marketplace Coverage.” The Henry J. Kaiser Family Foundation, Menlo Park, CA.
Claxton, Gary, Matthew Rae, Nirmita Panchal, Heidi Whitmore, Anthony Damico, and Kevin Kenward. 2014. “Health Benefits in 2014: Stability in Premiums and Coverage for Employer-Sponsored Plans.” Health Affairs 33 (10): 1–10.
Cohen, Robin A. and Whitney K. Kirzinger. 2014. “Financial Burden of Medical Care: A Family Perspective.” Data Brief 142, National Center for Health Statistics, Centers for Disease Control and Prevention, U.S. Department of Health and Human Services, Washington, DC.
Cronqvist, Henrik, and Richard H. Thaler. 2004. “Design Choices in Privatized Social Security Systems: Learning from the Swedish Experience.” American Economic Review 94 (2): 424–28.
Cutler, David M. 2004. “Are the Benefits of Medicine Worth What We Pay for It?” Working Paper 16, Maxwell School of Citizenship and Public Affairs, Center for Policy Research, Syracuse University, Syracuse, NY.
Cutler, David M., and Mark McClellan. 2001. “Is Technological Change in Medicine Worth It?” Health Affairs 20 (5): 11–29.
Cutler, David M., and Sarah Reber. 1998, May. “Paying for Health Insurance: The Trade-Off between Competition and Adverse Selection.” Quarterly Journal of Economics113 (2): 433–66.
Cutler, David M., Allison B. Rosen, and Sandeep Vijan. 2006. “The Value of Medical Spending in the United States, 1960–2000.” New England Journal of Medicine 355: 920–27.
Cutler, David, Jonathan Skinner, Ariel Dora Stern, and David Wennberg. 2013. “Physician Beliefs and Patient Preferences: A New Look at Regional Variation in Health Care Spending.” Working Paper 19320, National Bureau of Economic Research, Cambridge, MA. Dartmouth Institute for Health Policy and Clinical Practice. 2015.
Total Medicare Reimbursements per Enrollee, By Adjustment Type.” Dartmouth College, Hanover, NH. http://www.dartmouthatlas.org/data/topic/topic.aspx?cat=21.
Dranove, David, Craig Garthwaite, and Christopher Ody. 2015. “A Floor and Trade Proposal to Improve the Delivery of Charity Care Services by U.S. Nonprofit Hospitals.” Discussion Paper 2015–07, The Hamilton Project, The Brookings Institution, Washington, DC.
Ericson, Keith M. Marzilli. 2014. “Consumer Inertia and Firm Pricing in the Medicare Part D Prescription Drug Insurance Exchange.” American Economic Journal: Economic Policy 6 (1): 38–64.
Feldstein, Martin, and Jonathan Gruber. 1994. “A Major Risk Approach to Health Insurance Reform.” Working Paper 4852, National Bureau of Economic Research, Cambridge, MA.
Finkelstein, Amy, Matthew Gentzkow, and Heidi Williams. 2014. “Sources of Geographic Variation in Health Care: Evidence from Patient Migration.” Working Paper 20789, National Bureau of Economic Research, Cambridge, MA.
Frank, Richard, and Karine Lamiraud. 2009. “Choice, Price Competition and Complexity in Markets for Health Insurance.” Journal of Economic Behavior and Organization 71 (2): 550–62.
Garthwaite, Craig, Tal Gross, and Matthew J. Notowidigdo. 2015. “Hospitals as Insurers of Last Resort.” Working Paper 21290, National Bureau of Economic Research, Cambridge, MA.
Gaynor, Martin, Kate Ho, and Robert J. Town. 2015. “The Industrial Organization of Health-Care Markets.” Journal of Economic Literature 53 (2): 235–84.
Handel, Benjamin R. 2013. “Adverse Selection and Inertia in Health Insurance Markets: When Nudging Hurts.” American Economic Review 103 (7): 2643–82.
Handel, Benjamin R., and Jonathan T. Kolstad. 2015. “Health Insurance for ‘Humans’: Information Frictions, Plan Choice, and Consumer Welfare.” American Economic Review 105 (8): 2449–500.
Heiss, Florian, Adam Leive, Daniel McFadden, and Joachim Winter. 2013. “Plan Selection in Medicare Part D: Evidence from Administrative Data.” Journal of Health Economics 32 (6): 1325–44.
Ho, Kate, Joseph Hogan, and Fiona Scott Morton. 2015, March. “The Impact of Consumer Inattention on Insurer Pricing in the Medicare Part D Program.” Working Paper 21028, National Bureau of Economic Research, Cambridge, MA.
Hoadley, Jack, Juliette Cubanski, Elizabeth Hargrave, and Laura Summer. 2014, October. “Medicare Part D: A First Look at Plan Offerings in 2015.” The Henry J. Kaiser Family Foundation, Menlo Park, CA.
Iyengar, Sheena S., and Mark R. Lepper. 2000. “When Choice is Demotivating: Can One Desire Too Much of a Good Thing?” Journal of Personality and Social Psychology 79 (6): 995–1006.
The Henry J. Kaiser Family Foundation. 2014. “2014 Employer Health Benefits Survey.” Henry J. Kaiser Family Foundation, Menlo Park, CA.
The Henry J. Kaiser Family Foundation/Health Research & Educational Trust (Kaiser/HRET) Survey of Employer-Sponsored Health Benefits. 1999–2012. The Henry J. Kaiser Family Foundation, Menlo Park, CA.
Ketcham, Jonathan D., Claudio Lucarelli, and Christopher A.Powers. 2015. “Paying Attention or Paying Too Much in Medicare Part D.” American Economic Review 105 (1): 204–33.
Kling, Jeffrey, Sendhil Mullainathan, Eldar Shafir, Lee Vermeulen, and Marian Wrobel. 2012. “Comparison Friction: Experimental Evidence from Medicare Drug Plans.” Quarterly Journal of Economics 127 (1): 199–235.
KPMG Survey of Employer-Sponsored Health Benefits. 1993 and 1996. KPMG, Irvine, CA.
Leibman, Jeffrey, and Richard Zeckhauser. 2008. “Simple Humans, Complex Insurance, Subtle Subsidies.” Working Paper 14330, National Bureau of Economic Research, Cambridge, MA.
Loewenstein, George, Joelle Y. Friedman, Barbara McGill, Sarah Ahmad, Suzanne Linck, Stacey Sinkula, John Beshears, James J. Choi, Jonathan Kolstad, David Laibson, Brigitte C. Madrian, John A. List, and Kevin G. Volpp. 2013. “Consumers’ Misunderstanding of Health Insurance.” Journal of Health Insurance 32: 850–62.
McGuire, Thomas G. 2012. “Demand for Health Insurance.” In Handbook of Health Economics, edited by Anthony J. Culyer and Joseph P. Newhouse, chap. 5. Waltham, MA: Elsevier. Patient Protection and Affordable Care Act of 2010 (ACA), 42 U.S.C. § 18001 (2010).
Rothschild, Michael, and Joseph Stiglitz. 1976. “Equilibrium in Competitive Insurance Markets: An Essay on the Economics of Imperfect Information.” Quarterly Journal of Economics 90 (4): 629–49.
Sheiner, Louise. 2014, Fall. “Why the Geographic Variation in Health Care Spending Can’t Tell Us Much About the Efficiency or Quality of Our Health Care System.” Brookings Papers on Economic Activity, Brookings Institution, Washington, DC.
Sinaiko, Anna D., and Richard A. Hirth. 2011. “Consumers, Health Insurance, and Dominated Choices.” Journal of Health Economics 30 (2): 450–57.
Skinner, Jonathan. 2011. “Causes and Consequences of Regional Variations in Health Care.” Handbook of Health Economics 2: 45–93.
Skinner, Jonathan S. 2013, September 5. “The Costly Paradox of Health-Care Technology.” MIT Technology Review. Smith, Jessica C. and Carla Medalia. 2015, September. “Health Insurance Coverage in the United States: 2014.” Current Population Reports, U.S. Census Bureau, U.S. Department of Commerce, Washington, DC.
Smith, Sheila, Joseph P. Newhouse, and Mark S. Freeland. 2009. “Income, Insurance, and Technology: Why Does Health Spending Outpace Economic Growth?” Health Affairs (28) 5: 1276–84.
Survey of Consumer Finances. 2014. “2013 Survey of Consumer Finances.” U.S. Board of Governors of the Federal Reserve System, Washington, DC.
Sutherland, Jason M., Elliott S. Fisher, and Jonathan S. Skinner. 2009. “Getting Past Denial—The High Cost of Health Care in the United States.” New England Journal of Medicine 61: 1227–30.
U.S. Department of Health and Human Services (DHHS). 2014a. “Table I.B.2: Percent of Private Sector Employees in Establishments that Offer Health Insurance: United States, 1996–2006, 2008–2014” and “Table I.B.2.c: Percent Of Private Sector Employees Working In Establishments That Offer Two Or More Health Insurance Plans: United States, 1996–2006, 2008–2014.” Medical Expenditure Panel Survey, Agency for Healthcare Research and Quality, U.S. Department of Health and Human Services, Washington, DC.
———. 2014b. “Table I.F.1: Percent of private-sector employees enrolled in a health insurance plan that had a deductible: United States, 2013.” Medical Expenditure Panel Survey, Agency for Healthcare Research and Quality, U.S. Department of Health and Human Services, Washington, DC.
———. 2014c. “Table I.F.3: Average family deductible (in dollars) per employee enrolled with family coverage in a health insurance plan that had a deductible at private-sector establishments: United States, 2013.” Medical Expenditure Panel Survey, Agency for Healthcare Research and Quality, U.S. Department of Health and Human Services, Washington, DC. United Healthcare. n.d.a. “Choosing a Health Insurance Plan.” United Healthcare, Rockville, MD.
———. n.d.b. “Evaluate Plan Options.” United Healthcare, Rockville, MD.
Zhou, Chao, and Yuting Zhang. 2012, October. “The Vast Majority of Medicare Part D Beneficiaries Still Don’t Choose the Cheapest Plans that Meet Their Medication Needs.” Health Affairs 31 (10): 2259–65.
Related Content


Related Books


The Brookings Institution is committed to quality, independence, and impact.
We are supported by a diverse array of funders. In line with our values and policies, each Brookings publication represents the sole views of its author(s).