As the White House weighs its options over whether and how to implement policy changes related to immigration, more and more places around the country are encountering a growing foreign-born population.
The number of immigrants living in the United States increased by 523,000 between 2012 and 2013, according to recently released data from the U.S. Census Bureau’s American Community Survey. This represents an up-tick from the last two annual changes in which 422,000 and 447,000 immigrants were added to the population each year. There are now 41.3 million foreign-born residents in the United States and their share of the total U.S. population inched up from 13.0 percent to 13.1 percent. These small changes at the national level mask bigger changes in metro areas across the country.
Immigrants continue to be attracted to the nation’s largest metropolitan areas but are dispersing to more and smaller places across the country.
In 2000, the 10 metro areas with the largest number of immigrants (New York, Los Angeles, Miami, Chicago, Houston, San Francisco, Washington, Dallas, Riverside, and Boston) accounted for 56 percent of all the foreign born living in the U.S. By 2013, that share had dropped to just over half (51 percent). This is a continuation of a longer trend: 61 percent of immigrants lived in the top 10 metro areas in 1990. By comparison, 26 percent of the total U.S. population lived in the 10 metro areas with the largest immigrant populations in 2013.
This dispersion can be seen by looking at the increase in the foreign-born population at the metropolitan level. In 97 of the 100 most populous metro areas, there were more immigrants in 2013 than in 2000 (three metro areas in Ohio saw no statistically significant increase or decrease). But the size and pace of the growth varied considerably across the country. Atlanta and Seattle—neither of which rank among the top 10 largest immigrant destinations—each added more immigrants to their population between 2000 and 2013 than Chicago, San Francisco, Boston, or Los Angeles (all among the 10 largest in 2013). Over the 13-year period, fewer immigrants were added to Los Angeles, the second largest immigrant receiving metro area, than 24 other metro areas, including much smaller destinations such as Minneapolis, Baltimore, and Charlotte.
The New York metropolitan area (which includes the cities of New York, Newark, and Jersey City, and 25 counties in three states) saw the greatest increase in its foreign-born population between 2000 and 2013: almost 800,000.
Houston’s and Miami’s each increased by more than half a million. In all, 23 metro areas saw their immigrant population increase by at least 100,000, and the top 16 metro areas for numeric growth together accounted for half of national growth in the foreign-born population.
In 2013, in 87 of the 100 largest metro areas immigrants made up a larger share of the population in 2013 than they did in 2000.
Only two metro areas—Los Angeles and El Paso—saw a statistically significant decrease in the percent of their population that was foreign born over the same time period. In the remaining 11 metro areas, the percent foreign born held constant.
While large immigrant gateways saw the highest growth in their foreign-born populations over the 13-year period, smaller places experienced very rapid growth.
Nine metro areas—most in the Southeast— saw a doubling or more of their foreign-born population: Scranton, Cape Coral, Knoxville, Indianapolis, Nashville, Charlotte, Louisville, Charleston, and Raleigh.
As immigrants continued to disperse to more metro areas around the country, they also continued to move to the suburbs, following overall population settlement patterns.
In 2000, 56 percent of the immigrants living in the largest metro areas (the 97 for which intra-metropolitan data are available) lived in the suburbs. By 2013, that share had increased to 61 percent. Yet with 69 percent of all large metro residents living in the suburbs, immigrants are still under-represented there.
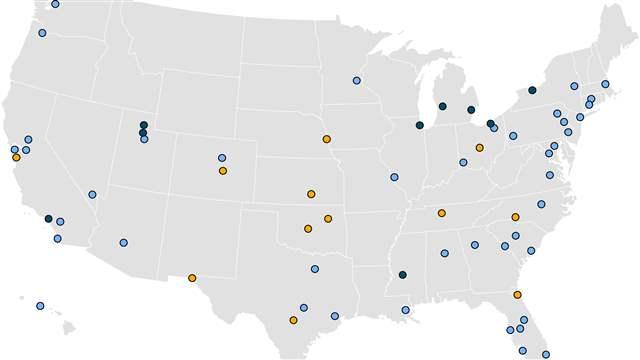
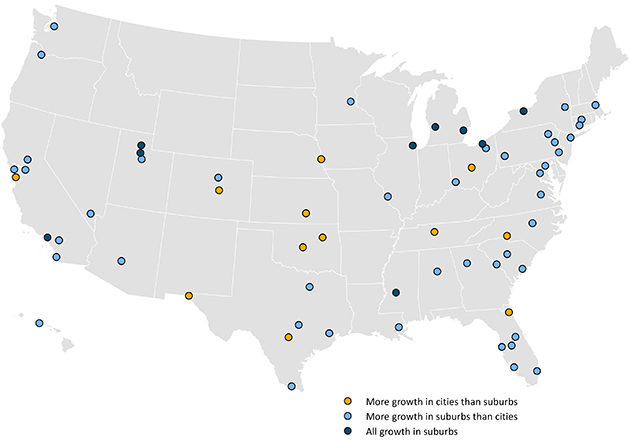
Overall, three quarters (76 percent) of the growth in the foreign-born population between 2000 and 2013 in the largest metro areas occurred in the suburbs. In 53 metro areas, the suburbs accounted for more than half of immigrant growth, including nine metros in which all of the growth occurred in the suburbs: Chicago, Cleveland, Detroit, Grand Rapids, Jackson, Los Angeles, Ogden, Rochester, and Salt Lake City. It is notable that two long-standing giants of immigrant settlement—Chicago and Los Angeles–had fewer immigrants living in their primary cities in 2013 than in 2000. If not for the growth in their suburbs, these major destinations would have lost foreign-born population. Conversely, in 12 metro areas, primary cities attracted more immigrants than their suburbs: Wichita, Colorado Springs, Columbus, El Paso, Oklahoma City, Jacksonville, San Antonio, San Jose, Omaha, Tulsa, Nashville, and Charlotte. (See Map.)
Foreign-Born Population Growth in Primary Cities and Suburbs, 2000-2013
No metro area saw its foreign-born population in the suburbs decrease between 2000 and 2013, and in 20 metros, the suburban immigrant population at least doubled.
In the suburbs of 78 of the 97 largest metro areas, the foreign-born population grew faster than the overall population, so that a higher share of the population was foreign born in 2013 than in 2000. Los Angeles was the only metro area whose suburbs had a lower concentration of immigrants in 2013 than in 2000.
The share of residents who are foreign born also went up in cities, but to lesser extent than in the suburbs. In the primary cities of 69 of the 97 largest metro areas, the share of the population that was foreign-born increased between 2000 and 2013. At the same time, the primary cities in three large metro areas—Los Angeles, Ogden, and Miami—experienced a decline in the foreign-born share of their population. In 25 metro areas, there was not a statistically significant change.
* * *
As the foreign-born population in the United States continues to spread out from the largest destinations to metro areas and suburbs across the country, any federal change to immigration policies will be felt throughout the nation.
A Note on Methods
With the release of 2013 American Community Survey data, the U.S. Census Bureau began using the recently released 2013 metropolitan area statistical definitions. Please see Elizabeth Kneebone and Natalie Holmes’ September 2014 report for a technical note on comparing these metropolitan areas with previously released data.
The Brookings Institution is committed to quality, independence, and impact.
We are supported by a diverse array of funders. In line with our values and policies, each Brookings publication represents the sole views of its author(s).