Contents:
As a new Congress and the 2020 presidential election cycle gear up, much of Washington is likely to focus on topics where political polarization is high. Yet there may be surprises.
Take climate change, a top priority for many Democrats.
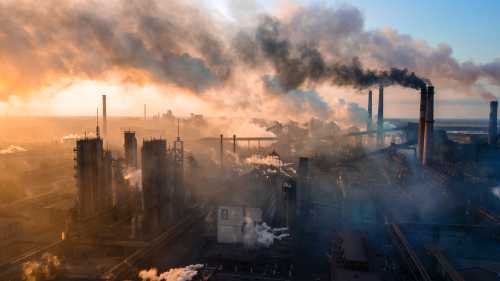
The standard story is that the high-tech “blue” states are pushing a green wave of massive investment to cut emissions of gases that cause climate change. Meanwhile, the GOP-leaning “red” states are assumed to be part of what Ron Brownstein calls a “brown blockade” of fossil-fuel producers that are drilling and burning and don’t want to stop. The upshot: Emissions divides appear to guarantee a future of climate policy gridlock, even as scientific consensus signals an emergency and new data shows the rate of planetary warming is accelerating.
And yet, what if we look at the geography of climate change from a different angle? Specifically, what if we flip the frame from emissions to impacts? From that perspective, the current gridlock might not be as permanent as it now seems, as many of the jurisdictions that have selected political leaders opposed to climate policy are the most exposed to the harms of climate change.
What the data show
To get this kind of granular look at the politics of climate impacts we turned to the county-based assessments emerging from the Climate Impact Lab. These quantifications offer the most detailed calculations available on the economic costs of future climate change through the end of the century in the United States. Behind the data lies a collaboration of more than 20 climate scientists, economists, computation experts, researchers, analysts, and students from several institutions, including the University of California at Berkeley, the University of Chicago, Rhodium Group, and Rutgers University.
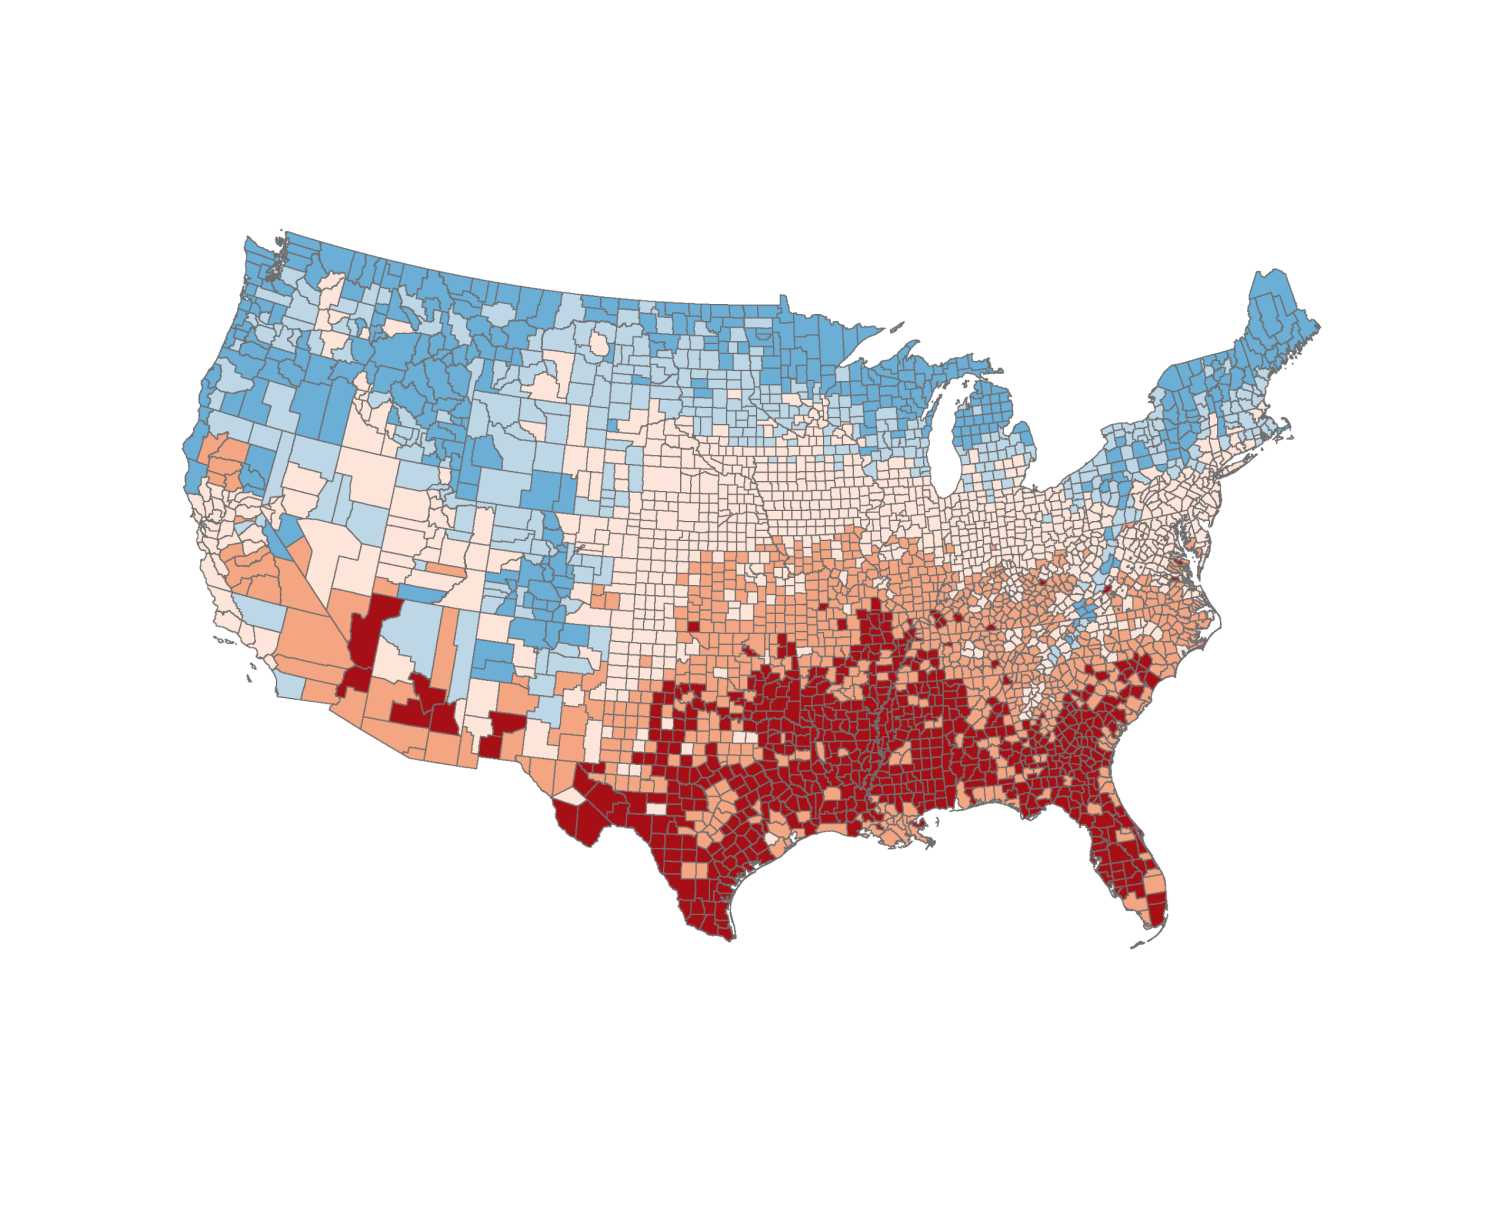
Map the Lab’s county-by-county statistics and it becomes possible to paint a unique overview of climate-change vulnerabilities, which adds up the distinct geographies of multiple types of climate-change impact (such as agricultural yields, mortality, coastal damage, and risk to labor) to produce a single national picture of how the future could look.
To be sure, these projections are less a forecast than a representation of a world where previously observed relationships continue to hold. As such, some of these impacts are quite familiar—rising seas will harm coastal areas, for example. Others, by contrast, are also important yet have figured less prominently in the national debate—outdoor workers, for example, are exposed to heat stroke and other measurable harms that undermine productivity in the labor supply and even kill people.
Here’s how some of these impacts look individually after projecting how climate may change by the end of the century:

And here’s how it all looks when the full array of impacts is assembled:

Scanning the maps, two patterns are clear. One is that climate change (and its economic impacts) are widespread. The other, which will be vital to understanding political geography, is that those impacts are highly uneven in their distribution. Most of that variation reflects variation in the single largest determinant of overall climate harm: mortality, which the Climate Impact Lab team quantifies using the Environmental Protection Agency’s standard “Value of a Statistical Life (VSL)” measure. When people die that harms the economy, and VSL is a statistical measure of that harm—not a number that declares the value of any particular life.
Other big sources of variation include agriculture where parts of the country see big harm from heat while others benefit from longer growing seasons, changes in rainfall and the fact that some plants actually grow faster when there is more carbon dioxide in the air. For coastal impacts, the biggest harm is to the southeast because the CIL study focused on what is plausibly the main source of damage: cyclones. Thus coastal damage, by this method, is a phenomenon of the Gulf of Mexico and the Atlantic. New research is under way to look systematically at coastal impacts in other parts of the country.
According to the map, climate change could actually bestow net economic benefits by the years 2080-2099 (as measured by county income change as a share of 2012 income) on the Pacific Northwest, parts of the Interior West, the upper Midwest, and New England, even as it creates stark losses in the Southwest, Southeast, and Florida. As the smaller maps suggest, while increases in agricultural yields will significantly benefit the nation’s Northwest, climate-caused deaths will hurt the Southwest as coastal storms and sea-level issues batter the Southeast, Florida, and the Gulf Coast. These patterns suggest that many red-voting states in the “brown barricade” are likely disproportionately exposed to climate change’s negative impacts.
Aggregating county patterns up into metropolitan areas underscores the impression from the perspective of America’s cities.

Southern metros will be hit hardest by climate change in the form of coastal property damage and higher mortality, with Florida metros like Lakeland, Tampa, Sarasota, and Orlando representing eight of the 10 most adversely affected large metros. Lakeland’s economy could contract by 17.5 percent by the end of the century from direct climate-change impacts, while Tampa’s could be 16.8 percent smaller.

By contrast, Northwestern and New England cities like Seattle and Spokane (Wash.), Wash., Portland, Ore., Seattle, and Buffalo, Syracuse, Rochester, and Albany, N.Y. actually stand to benefit from climate change through reduced mortality and lower energy expenditures. Spokane’s economy could grow 2.6 percent as a result of climate change, while larger metros like Portland and Seattle could see output increases of 2.0 percent and 1.7 percent, respectively. It sure seems like the geography of climate harm differs significantly from the geography of emissions.
The politics of climate harm
But now let’s look at the politics of climate harm. Drill down on the political geography of climate damage and it becomes clear that in much of the country Republicans are voting for people who are opposed to climate policy, even as they are most exposed to climate impacts.
Drill down on the political geography of climate damage and it becomes clear that in much of the country Republicans are voting for people who are opposed to climate policy, even as they are most exposed to climate impacts.
Beginning at the state level, the table below ranks states by the degree of economic harm they may experience from climate change and shows alongside that their political behavior on climate policy (as indicated by the state’s 2016 presidential vote).

Many of the states with the most to lose from climate change voted heavily for Donald Trump in 2016, thereby electing a president who has disavowed his own government’s National Climate Assessment—the most careful government evaluation of climate risks ever done—and has systematically moved to dismantle former-President Barack Obama’s foreign policy and regulatory initiatives to reduce carbon emissions.
The alignment is sharp: 9 of the 10 states contending with the highest losses of county income voted for President Trump in 2016, including, in order, Florida, Mississippi, Louisiana, Arkansas, and Alabama. Fifteen of the 16 highest-harm states were also red.
By contrast, the bottom portion of the chart shows the inverse. Hillary Clinton—who favored a continuation of President Obama’s emission limits and carbon diplomacy—carried 9 of the 17 states that actually stand to gain from climate change, despite her having promised to take action against it.
Along these lines, it is easy to perceive a kind of cognitive dissonance at work, similar to the paradoxical “government-citizen” disconnect that political scientist Suzanne Mettler has described in the realm of federal social programs: federal action to curb economically harmful climate change does not necessarily resonate in the places that need it most. In the case of climate change, people have a hard time thinking accurately about the link between their actions and the climate in part because politics and ideology color how they process information.
The disconnect between who is most exposed to climate harms and how they vote exists not only at the state level but also within Congressional districts as revealed in the 2018 election cycle. As shown in the table below Republican-voting counties and congressional districts—which are less affluent, less urban, and more likely located in hard-hit Florida and Texas—are more exposed to climate harms.

Along these lines, we estimate that counties that voted for President Trump in 2016 will experience on average a nearly 5-percent loss of GDP compared to the smaller 3.3 percent loss borne by counties that voted for Hillary Clinton. Similarly, congressional districts that in November voted Republican face a 4.4 percent GDP tax from climate change compared to the smaller 2.7 percent loss projected for districts that voted Democratic.
The political future
What does all of this say about the future prospects of U.S. policy on climate change? It could be that the harm data may break down the “brown blockade” as more people become aware that acute climate impacts are already happening.
Still, a poisonous cocktail of right-wing ideology, distrust of distant Washington, and fear of short-term job losses will continue to make it hard to implement any sort of federal legislation to tackle climate change. Yet with that said, some public opinion polls suggest that Republican attitudes on climate change are already softening—and with that, the prospects for bipartisan federal legislation may brighten as the damage from storms, drought, and fire accumulates.
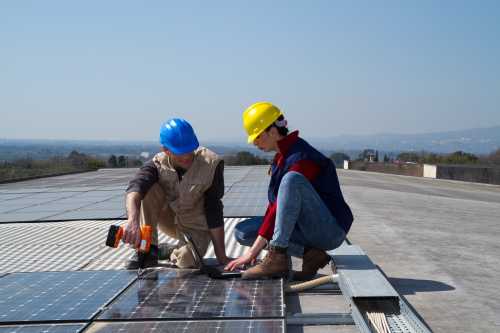
Holes in the “brown blockade” are already appearing. For one, the red states aren’t all brown. Earlier research at Brookings Metro has shown that the energy system really is in transition, with many “red” states seeing sizable emissions decline as coal plants are shut down and cheaper natural gas and renewables take market share.
Looking to the future, the cumulative impact of climate harm may shift geographical value northward and westward—a shift that will add more stress to today’s “red” America. By the late 21st century Republican-voting counties are projected to experience damages ranging as high as 28 percent of their income under business-as-usual pathways. For example, Texas, the Gulf Coast, and the southern Atlantic seaboard are all deeply red and deeply vulnerable to future climate change impacts. Some of the new swing states, like Arizona, are also highly exposed.
Activists who want to change the political equation can derive a clear strategy from the harm data: Work in the reddish swing states by focusing spotlights and cost accounting on the severe economic effect wrought by climate change. Party attitudes on climate change could shift quickly there as people are confronted with climate reality. That’s exactly what happened in other areas—for example, gays serving in the military or state-sanctioned gay marriage—when political attitudes were forced to confront new realities around the Thanksgiving dinner table and on television.
For decades, environmentalists have focused on the abstract opportunities of a green economy—more renewables and efficiency, for example—as the route to political change. A harder charging, grittier and more palpable campaign focused on climate impacts in “red” America could prove a lot more effective. And the data now exist to make that happen.
Related Content


Authors


The Brookings Institution is committed to quality, independence, and impact.
We are supported by a diverse array of funders. In line with our values and policies, each Brookings publication represents the sole views of its author(s).