
More than half the world’s population now lives in urban areas, and the 300 largest metropolitan economies in the world account for nearly half of all global output. The concentration of economic growth and prosperity in large metro areas defines the modern global economy, creating both opportunities and challenges in an era in which national political, economic, and societal trends are increasingly influenced by subnational dynamics. Understanding these large metro areas’ economic trajectory, which we measure through employment and GDP per capita measures, offers additional insights into the sources of growth that national or regional assessments tend to obscure.
Note: This analysis does not attempt to measure which metro areas are most competitive, wealthy, or livable, as incredible differences in wealth and prosperity exist within the sample. Rather, it aims to capture how large metro areas are responding to continued changes in the world economy and, amid concerns about rising place-based disparities, how large metro areas are growing relative to their surrounding nations and regions.
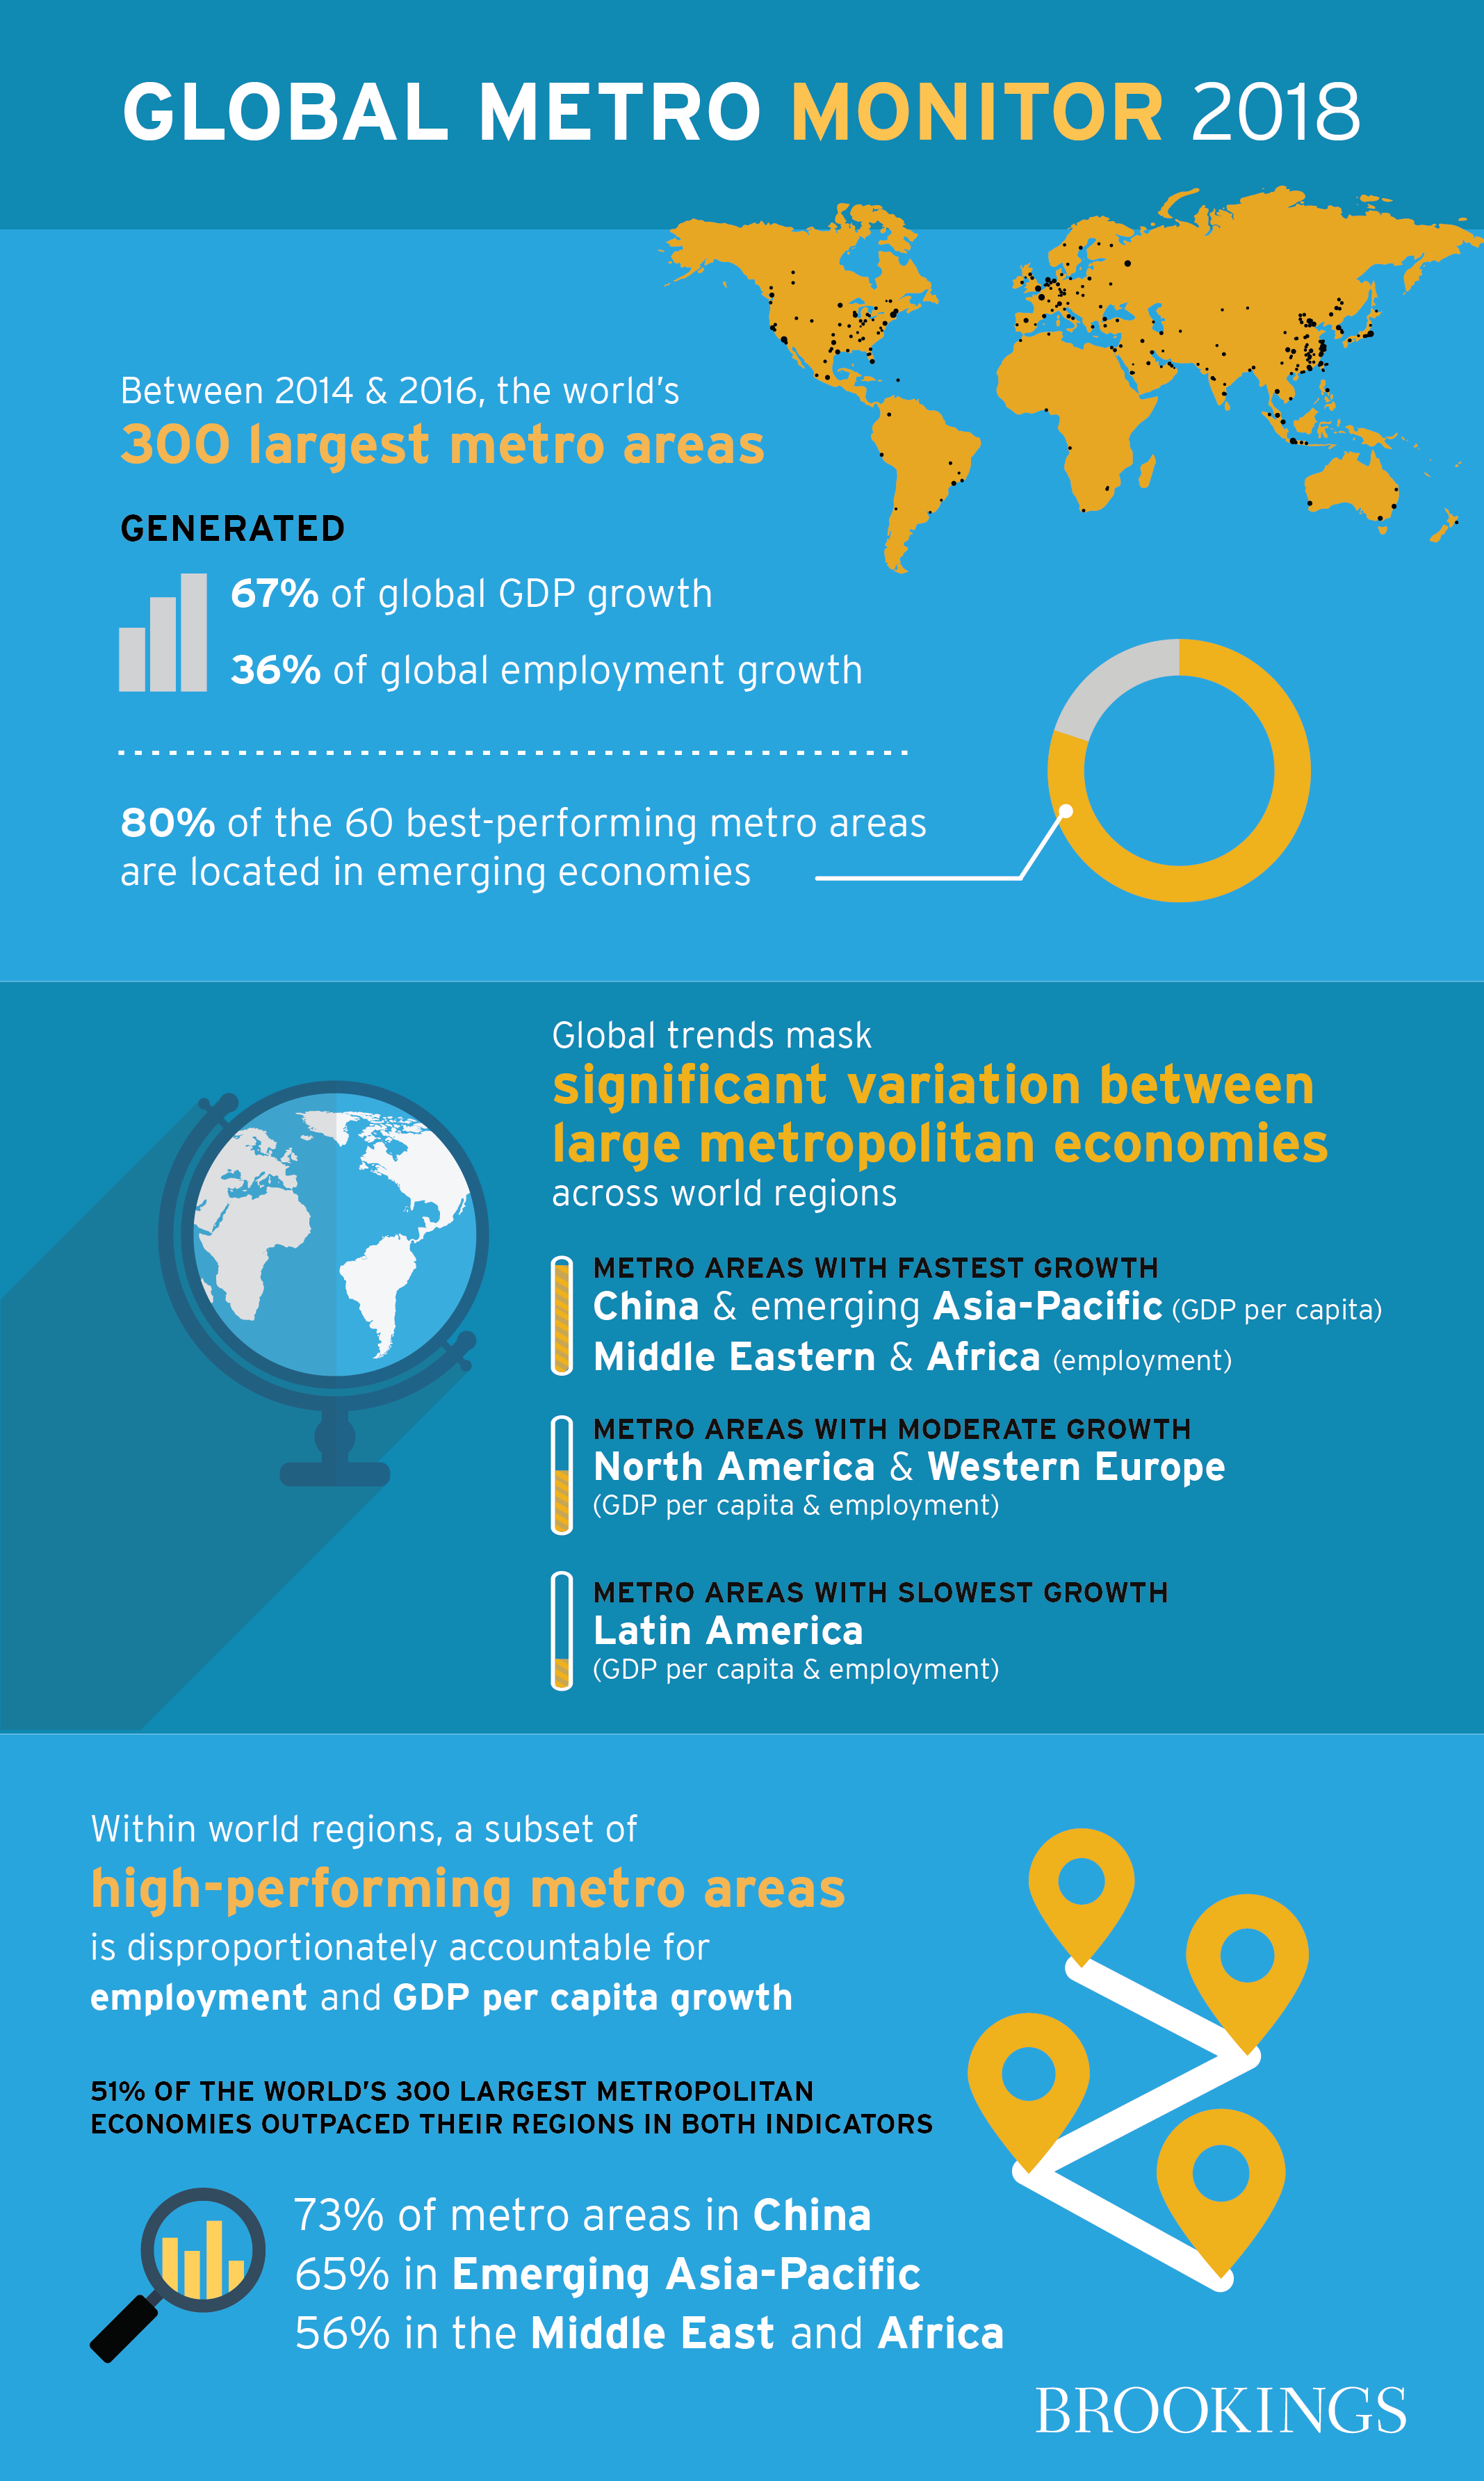
1Large metropolitan economies concentrated and accelerated global economic growth between 2014 and 2016.
The 300 largest metros accounted for 36 percent of global employment growth and 67 percent of global GDP growth. Emerging economy metro areas continued to disproportionately drive growth, accounting for 80 percent of the 60 best-performing metropolitan areas.
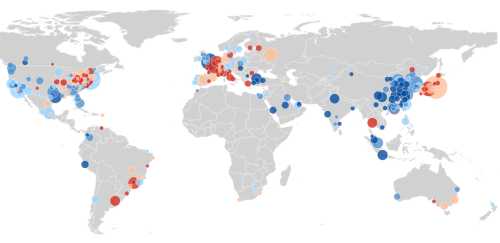
While large metro areas expanded at a faster pace than the global economy, there is much regional variation in performance. China and Emerging Asia-Pacific overwhelmingly dominate the upper ranks of performance, whereas those that exhibited slower growth included many Latin American metro areas, especially Brazil’s large cities.
Large metro areas are powering disproportionate amounts of economic growth
300 largest metropolitan areas’ share of world total, 2014-2016
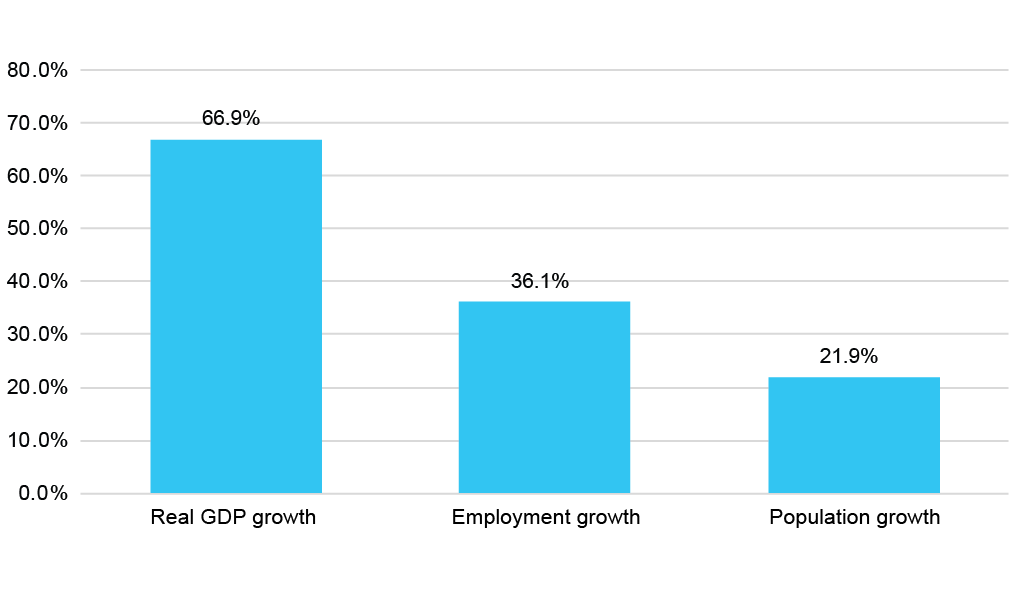
Source: Brookings analysis of Oxford Economics data
Large metro areas in emerging economies outperformed those in advanced economies
Distribution by economic performance quintiles, 2014–2016
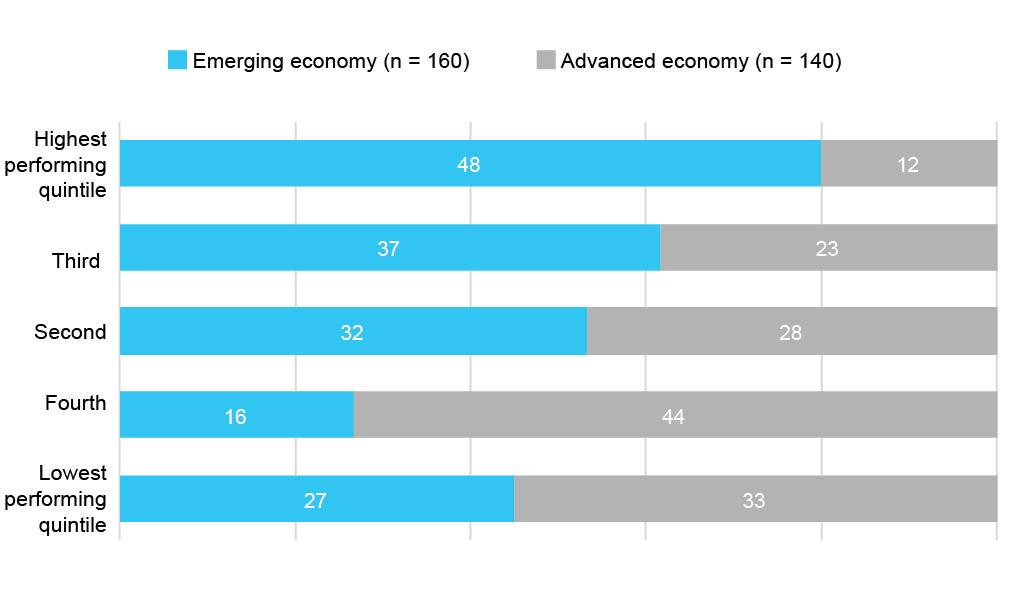
Source: Brookings analysis of Oxford Economics data
2Global trends mask notable variation in the performance of large metropolitan economies across world regions between 2014 and 2016.
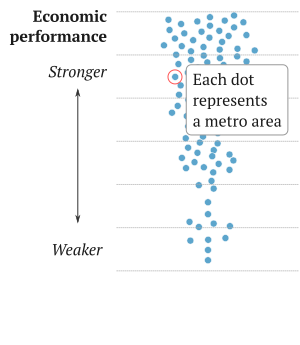
Reading the charts below
Metro areas in China and Emerging Asia-Pacific experienced the fastest GDP per capita growth while Middle Eastern and African metro areas exhibited the fastest employment growth. By contrast, Latin American metro areas experienced the slowest GDP per capita and employment growth.
…
In Eastern Europe and Central Asia, large metro areas expanded employment even as the rest of the region stagnated. North America and Western Europe experienced moderate growth between 2014 and 2016.
…
To measure overall economic performance, this report presents an economic performance index based on four economic indicators depicted above: absolute and percent change in jobs and GDP per capita. There is much regional variation in the performance index. China and Emerging Asia-Pacific overwhelmingly dominate the upper ranks of performance, although North American tech hubs such as San Jose and San Francisco also demonstrated significant growth. Meanwhile, those that exhibited slower growth included many Latin American metro areas, especially Brazil’s large cities, and metro areas in Western Europe and the Advanced Asia-Pacific region.
…
3Between 2014 and 2016, just over half of the world’s 300 largest metropolitan economies were considered “pockets of growth,” high-performing metro areas disproportionately accountable for employment and GDP per capita growth.
In the short term, between 2014 and 2016, 51 percent of the 300 largest metro areas registered higher growth rates than their region in both employment and GDP per capita. Over the longer term, between 2000 and 2016, slightly more metro areas (53 percent) were pockets of growth, driven by the better long-term performance of metro areas in Advanced Asia-Pacific, Western Europe, and China. Notably, in North America and the Middle East and Africa, large metro areas were much more likely to be pockets of growth in the short term than in the long term, whereas in Advanced Asia-Pacific and Western Europe the reverse pattern holds.
The majority of the large metro areas exceeded the growth rates of their region
Share of large metro areas that outperformed their region in both GDP per capita and employment growth
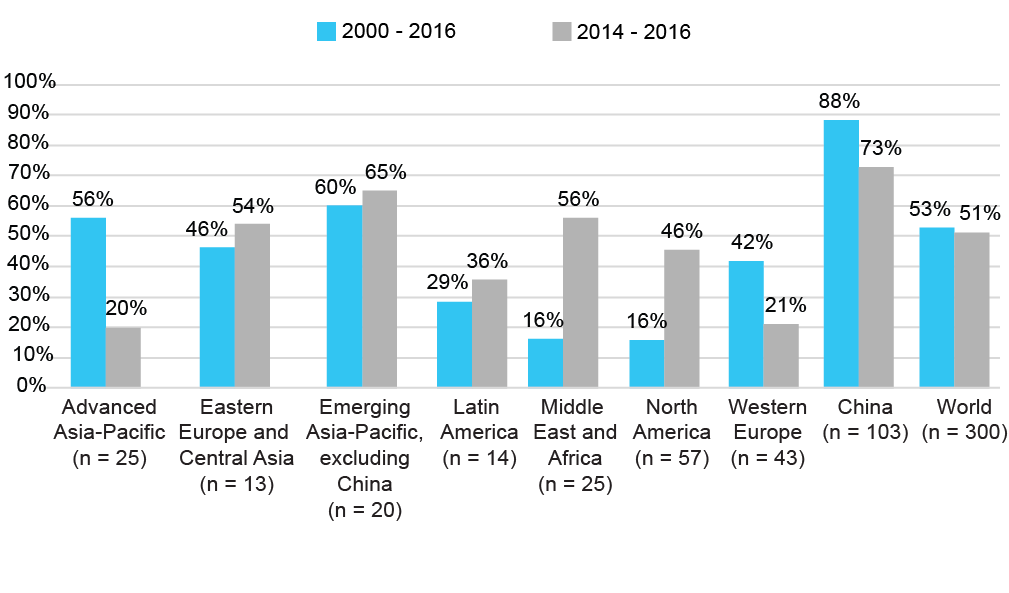
Source: Brookings analysis of Oxford Economics data
Reflecting its historic urban economic growth, China led this “pocket of growth” category between 2014 and 2016 with 75 metro areas, followed by North America (26) and the Middle East and Africa (14).
Read more on page 16 about specific examples of metro area performance within each region.»
Data visualization produced by Alec Friedhoff.
Related Content


Authors


The Brookings Institution is committed to quality, independence, and impact.
We are supported by a diverse array of funders. In line with our values and policies, each Brookings publication represents the sole views of its author(s).


