

Amidst a rising number of extreme weather events, service fluctuations, and other investment concerns, America’s water infrastructure is at a crossroads. Frequently overlooked and taken for granted, water is not just vital for life, but also provides an economic foundation for millions of businesses, farms, power plants, manufacturers, and households that depend on a reliable supply each day in the United States.
Despite seeing declining levels of water use in recent years, the U.S. still depends on nearly 355 billion gallons each day, an enormous total speaking to the breadth of uses nationally. Water use remains high in many cases, but it is also falling across the board as new conservation measures and technologies have been introduced. Utilities must confront several competing needs as a result: fixing aging, brittle infrastructure systems in service of a productive economy while generating less predictable revenues from lower levels of water use. Rising water bills, in turn, are helping to cover these costs and are often hitting lower-income households and other vulnerable users the hardest.
To provide reliable, cost-effective service, utilities—alongside local planners, economic development officials, and other leaders—need more detailed metrics and a better understanding of how regional water needs are shifting. By providing a comprehensive comparison of metropolitan and non-metropolitan water use, this report helps to meet this need. It not only highlights the scale and complexity of how users in different areas depend on water, but it also points to difficulties these users—and providers—face managing this scarce resource in an economically efficient and equitable way.
Explore data on water withdrawals by metropolitan area
Withdrawals are defined as water removed from the ground or diverted from a surface-water source for use, ranging across several key categories (public supply, thermoelectric power, irrigation, industrial, and other miscellaneous uses). They can involve deliveries to the end user or be self-supplied. Withdrawals are measured in the number of gallons used each day. Please download the full report for a complete discussion of the methodology. For additional state-level data, jump to the other map below ».
Major findings
The report analyzes water use data from the U.S. Geological Survey over a period of more than 50 years to find that:
The need for more efficient water use depends on metro areas, where more than 221 billion gallons of water use takes place each day, accounting for 63 percent of the U.S. total.
In short, metro areas are central to managing the country’s water resources since they contain many of its biggest water users. As the centers of U.S. population and economic output, most water use occurs in metro areas, including 80 percent of industrial use and 83 percent of public supply use. Just 25 of these metros, including New York, Chicago, and Washington, use 90 billion gallons of water each day, a quarter of the U.S. total. Nonetheless, users in these metros are much more efficient in their total water use (840 gallons per capita each day) compared to nonmetros (2,810 gallons per capita each day).
Metropolitan versus non-metropolitan shares of U.S. water withdrawals by category of use, 2010
Metro areas are already leading the charge to more efficient water use—driving almost 90 percent of U.S. declines over the past three decades—but this also introduces greater economic risk.
From 1985 to 2010, water use in metro areas fell by 39 billion gallons each day, including a reduction of 30 billion gallons in the 100 largest metro areas alone. Nonmetro areas, on the other hand, only reduced their water use by about 3 percent. Most of these declines occurred from 2005 to 2010, speaking to the importance of new technologies and other steps toward greater conservation. However, while nearly all major categories of water use reduced aggregate use, public supply did not. Increasing public demand in many metro areas is challenging utilities to provide reliable, affordable water to a growing customer base.
Metropolitan versus non-metropolitan percent change in water withdrawals by category of use, 1985 to 2010
Several factors—including higher levels of energy and agricultural production, shares of developed land, and population densities—have a significant effect on water use within metro areas and nonmetro areas, revealing certain policy levers that might be available to drive additional water efficiencies.
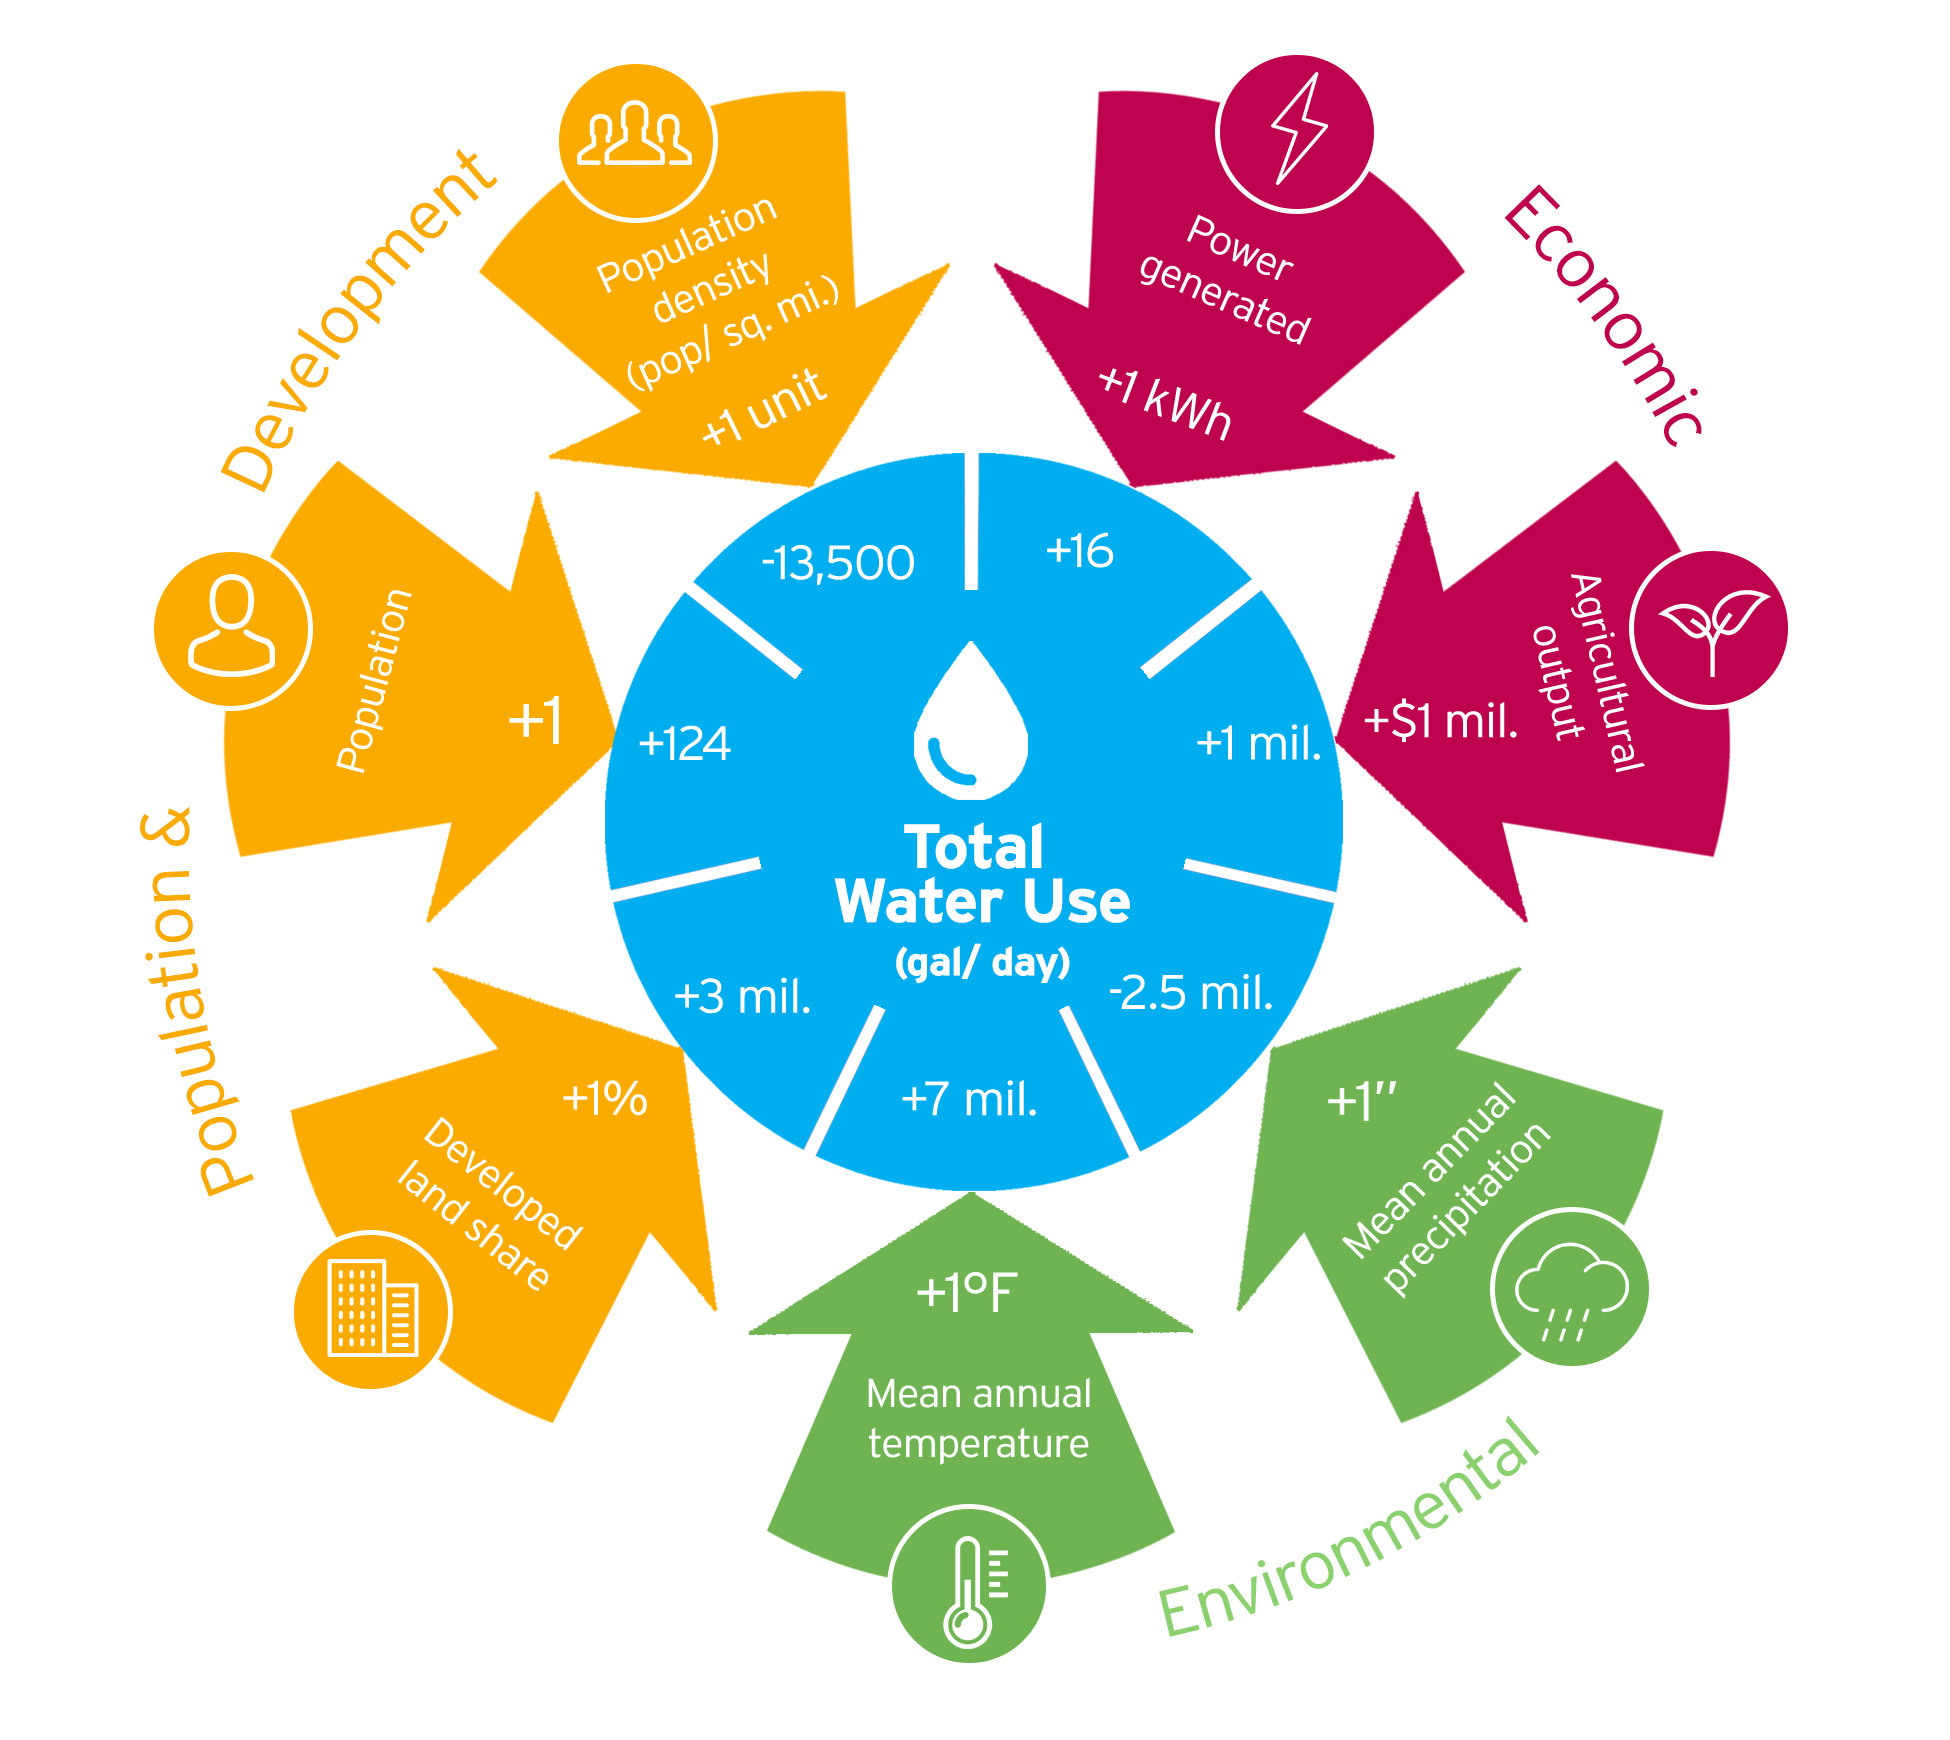
Understanding why users in some places—including particular cities and neighborhoods—depend on more water than others has attracted considerable attention from academics and practitioners. In line with previous studies, the report finds that certain types of industrial activity—namely energy and agricultural production—have a positive effect on total water use, in addition to higher temperatures and lower levels of precipitation. Crucially, however, counties with a greater concentration of population and more compact development tend to use less water. For example, an increase in a county’s population density by one is associated with 13,500 fewer gallons of total water use each day. As a result, a smarter, compact mix of land uses is likely to require less water—and potentially result in greater efficiencies—than more sprawling development patterns.
Key factors affecting water use at the county level
As the diagram below illustrates, for every one additional kWh of power generated, total water use goes up 16 gallons per day in the average county, holding other factors constant. Meanwhile, an extra inch of annual precipitation reduces water use by 2.5 million gallons per day.
Implications and recommendations
Amidst increasingly unpredictable demands, traditional ways of managing scarce water resources are no longer sufficient to achieve long-term, dependable service and fiscal certainty. These trends reaffirm that there are no one-size-fits-all solutions to the country’s water infrastructure challenges. However, by having a more consistent barometer to compare different places and weigh different needs, federal, state, and local leaders can begin to quantify the risks at hand more clearly and develop a more coordinated approach to the country’s water infrastructure challenges.
Local strategies: Implementing new plans, financial tools, and technological Innovations
Leaders in metro and nonmetro areas—including utilities and other large water users—are well-positioned to tackle their water infrastructure challenges head-on. Since they are often directly involved in overseeing water use, they can more closely track resource limitations, operational demands, and other hurdles to water management. Furthermore, they can engage in peer-to-peer learning and share best practices. The bigger challenge, though, is uniting action among different local actors and creating more holistic management strategies, which not only respond to short-term maintenance needs, but also emphasize long-term fixes and economic priorities.1
State and federal strategies: Building financial capacity, boosting collaboration, and providing policy direction on innovation
Metro and nonmetro areas must contend with a highly fragmented set of water challenges and cannot address these issues alone; state and federal leaders should help utilities, industries, and households across the country achieve greater financial and technical capacity to unlock new solutions. At the same time, establishing a clearer policy framework to guide these efforts is essential, including steps toward greater technological innovation.
Water withdrawals data by state
Data visualization produced by Alec Friedhoff.
Related Content


Author
The Brookings Institution is committed to quality, independence, and impact.
We are supported by a diverse array of funders. In line with our values and policies, each Brookings publication represents the sole views of its author(s).