

Yesterday, President Obama announced an ambitious set of proposals to introduce some much-needed innovation into our nation’s higher education system. The plan, which is aimed at making college more affordable, includes a variety of ideas such as challenges to states and institutions to enact reforms and an increase in the generosity of loan-repayment programs. But the most exciting, and likely the most controversial, proposal involves a sea change in the way the federal government holds postsecondary institutions accountable for student performance.
The President’s plan, which he is touting on a two-day bus tour through New York and Pennsylvania, proposes that the Department of Education develop a new rating system that will judge colleges based on accessibility for low-income students, affordability, and outcomes, including employment and earnings. The ratings will be developed over the next year and will ultimately be made available to students shopping for college on the White House’s College Scorecard.
There is clearly a need for more and better information on college quality. The current lack of transparency has created a highly dysfunctional market for higher education in which students can choose from a wide variety of institutions but often have access to better information about the amenities colleges offer than the quality of their academic programs. Consequently, colleges compete on measures that factor into popular rankings such as average SAT scores and student-faculty ratios rather than quality and price.
Expanding the College Scorecard is a worthy strategy on its own, but President Obama has proposed to go a giant step further and eventually tie the availability of financial aid to the new ratings. Students attending highly rated institutions would receive larger Pell grants and more generous terms for federal student loans. Institutions would receive a bonus grant based on the number of Pell-eligible students they enroll and graduate. As a result, institutions would have an incentive to recruit and graduate more low-income students, and low-income students would have an incentive to attend higher quality institutions.
If the problem in the market for higher education is a lack of information, why does more information need to be accompanied by top-down accountability from Washington rather than the bottom-up, market-based accountability produced by the information itself? Congressional Republicans have reacted to the president’s plan with fears of “price controls” and “standards set by Washington bureaucrats.” But these objections miss an important point about higher education: because taxpayers are footing the bill for a significant fraction of the nation’s investment in higher education, we cannot rely entirely on consumers to incentivize institutions to operate efficiently, innovate, and generate good student outcomes.
But getting from a laudable set of principles to a workable set of policies is going to be hard work. The first task is for the Obama administration to develop a set of measures of college quality that will ultimately be accurate enough to use for accountability purposes. This is not possible with existing data, with notable shortcomings including the fact that graduation rates are only calculated for first-time, full-time freshmen (who comprise a small share of students at many institutions) and a federal law banning the government from connecting education and earnings data in order to examine graduates’ success in the labor market. These problems are fixable, but will take significant effort and, absent a back door to earnings data, Congressional action.
Once the needed raw data exist, policymakers will have to decide how to incorporate them into quality measures that do not create perverse incentives. For example, a poorly designed rating system focused on graduation rates might lead institutions to neglect to enroll low-income or first-generation college students who are least likely to graduate, or to lower academic standards in order to make it easier to graduate. One way to mitigate this problem is to use multiple measures of quality, such as graduation rates and success in the labor market, that are adjusted based on student characteristics.
Regression analysis is one method that can be used to identify which institutions are producing better (or worse) outcomes than would be expected based on the students they enroll. But decisions still have to be made as to which student characteristics to take into account. Demographic characteristics such as race and socioeconomic status are likely to be the most controversial. In elementary and secondary education, demographics are sometimes excluded from measures of school or teacher quality because of worries that including them implicitly sets different expectations for different groups of students.
The figures below shows how important it is to adjust outcomes to account for student characteristics, but that exactly how the adjustment is made may be less important. We use the most recent federal IPEDS database to calculate six-year graduation rates for all four-year public universities in the United States. We then calculate quality ratings which indicate how much better or worse the graduation rate was than would be expected based on the characteristics of the student body. We calculate two ratings: #1 only takes into account student academic ability (as measured by average SAT/ACT scores), whereas #2 also takes into account student race/ethnicity, gender, and Pell grant eligibility.
Figure 1 shows that colleges with similar graduation rates have widely varying quality ratings once average SAT/ACT scores are taken into account. For example, among colleges with six-year graduation rates of around 50 percent, performance relative to expectations from 20 percentages points worse than expected to 20 points better than expected. Figure 2 shows that the two ratings are highly correlated. There are some differences in ratings based on whether demographics are taken into account, but they are much smaller than the differences with the unadjusted graduation rates.
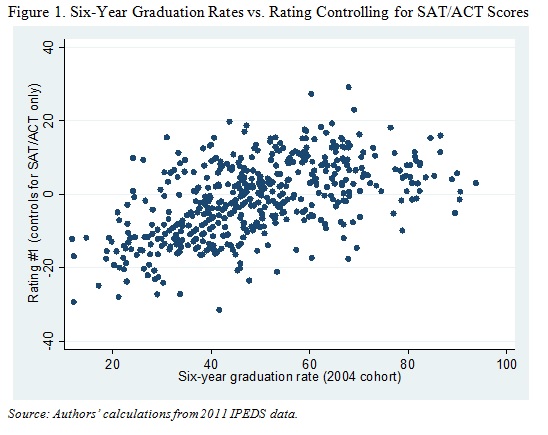
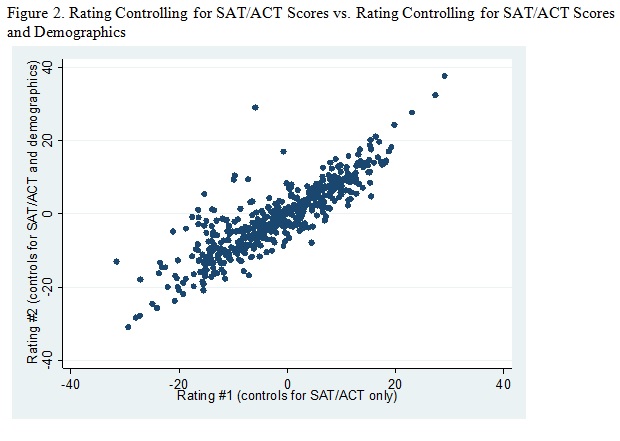
Source: Authors’ calculations from 2011 IPEDS data.
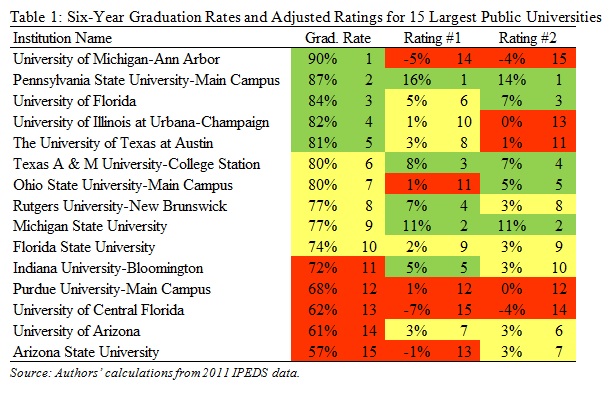
Some concrete examples help illustrate these points. Table 1 shows data for the 15 largest public universities in the country, which are ranked by their overall six-year graduation rate. The top five institutions are colored green, the middle five yellow, and the bottom five red. The regression-adjusted ratings suggest quite different information about quality than the unadjusted graduation rates. For example, the university with the highest graduation rate has one of the lowest ratings once student characteristics are taken into account. The University of Michigan has a graduation rate of 90 percent, but the high SAT/ACT scores of incoming freshmen predict a graduation rate of 95 percent. On the flip side, only 77 percent of Michigan State students graduate, but this figure is 11 percentage points higher than would be predicted based on the performance of similar students at other public universities.
The challenges facing the effort to accurately measure college quality cannot be overstated, and will surely be used as political fodder by those opposed to accountability in higher education. A failure to develop good measures will likely doom efforts to use the measures for accountability purposes, as it should. But this is all the more reason for the Obama administration to take full advantage of the extended timeline in the President’s plan—the first version of the ratings are slated for completion in 2015, and could be fine-tuned before being tied to financial aid allocations by 2018—to create a source of information that will finally mitigate the dysfunction that has plagued the higher education marketplace for far too long.
The Brookings Institution is committed to quality, independence, and impact.
We are supported by a diverse array of funders. In line with our values and policies, each Brookings publication represents the sole views of its author(s).