In less than one year, the 2020 census will record just how much more racially diverse the nation has become, continuing the “diversity explosion” that punctuated the results of the 2010 census. While less authoritative than the once-a-decade national headcount, recently released U.S. Census Bureau estimates for 2018 make plain that racial minority populations—especially Hispanic, Asian and black Americans—continue to expand, leaving fewer parts of the country untouched by diversity.
Where racial minority groups are highly represented
The new estimates indicate that, for the nation as a whole, Hispanic residents comprise 18.3% of the population. The shares for black and Asian residents are 12.5% and 5.9%, respectively.1 But these national numbers change dramatically when you look closer at the country’s 3,100-plus counties.
…
Map 1
…
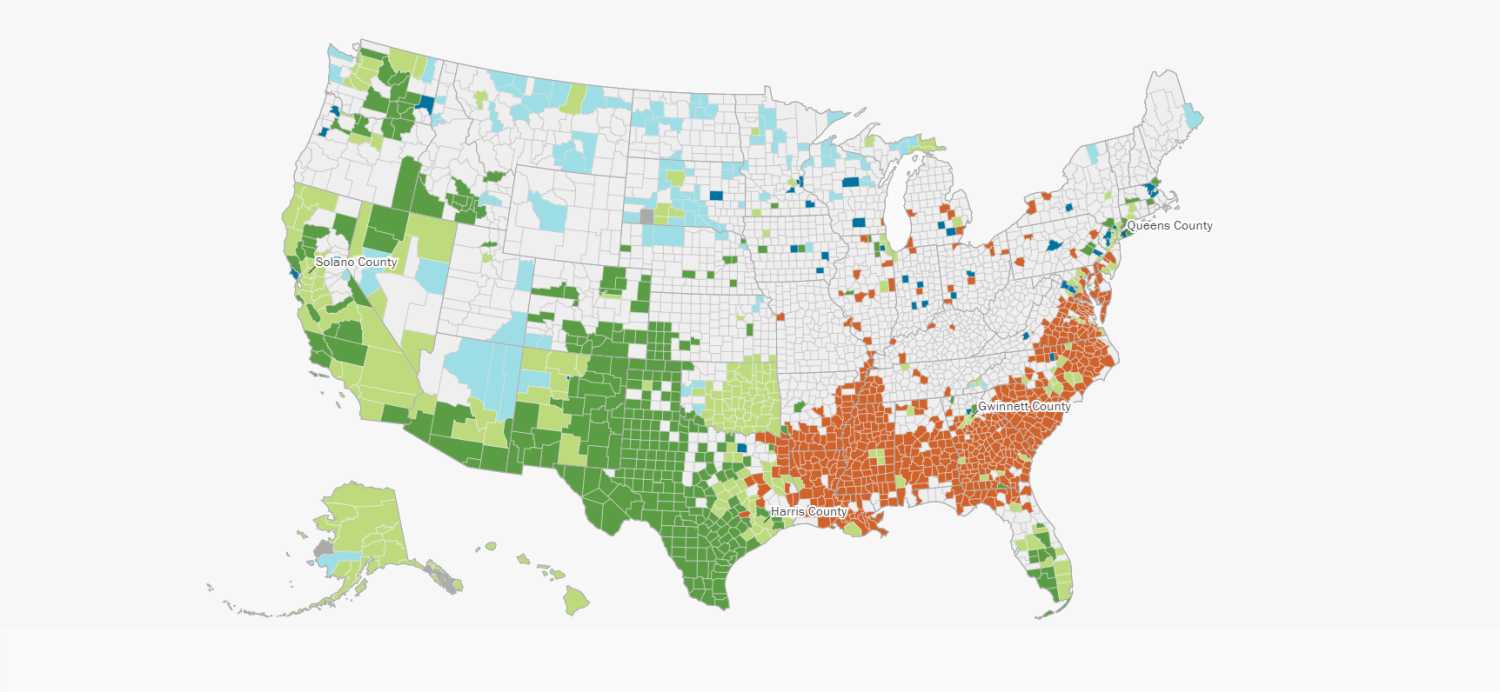
Where race-ethnic minority groups are highly represented, by county
Hover over counties to view statistics
…
Source: William H. Frey analysis of US Census population estimates, 2018
A group is highly represented if its share of the area population is larger than its share of the national population for Hispanics (18.3%), blacks (12.5%), and Asians, Native Hawaiians and Other Pacific Islanders (5.9%) and at least 4% for American Indians/Alaska Natives, or persons identifying as multiracial
*Non Hispanic members of group
**Two or more minority groups are highly represented or persons identified as multiracial are highly represented
Map 1 depicts counties where these groups—as well as American Indian or Alaska Natives—are highly represented, comprising a higher share of a county’s total population than for the nation as a whole.2 Also identified are counties where two or more minorities are highly represented.3 Examples of the latter are Queens County, N.Y., Harris County, Texas, Gwinnett County, Ga., and Solano County, Calif., where each of the three biggest minority groups are a larger portion of the local population than they are nationally. (The statistics for each U.S. county are available interactively by clicking areas on the map).
By this definition, Hispanic residents are highly represented in a swath of counties from California to Texas as well as parts of the Mountain West, the Southeast, urbanized parts of the North and many smaller places in the nation’s interior. Asian residents, often with other minority groups, are highly represented in California, Washington, Texas, portions of the Southeast, large metropolitan areas, and small towns in all parts of the country.
The highest concentration of black Americans remains in the South, which, as a region, houses 58% of the nation’s black population. These concentrations also appear in many northern urban areas, and together with other minorities in large parts of the West. And the much smaller American Indian or Alaska Native population is highly represented, frequently with other minority groups, in Oklahoma, Alaska, portions of the Mountain West, and the Upper Great Plains.
Related Books
While the map shows large swaths of “white counties”—where no racial minority is highly represented—many of these are small, less urban, and sparsely populated areas where the white population is stagnating. In fact, these counties—which span large sections of the middle of the country—are home to just 30% of the nation’s residents. In contrast, 35% of U.S. residents live in counties where two or more minorities are highly represented, with the remainder living in areas where one minority group is highly represented. Yet increasing diversity is prevalent everywhere—since 2010, 96% of all U.S. counties registered declines in their white population shares.
Large metro areas are especially diverse
Large metropolitan areas have historically been the nexus of minority settlement in the United States, serving as destinations for immigrants, black migration to urban areas, and, more recently, for Hispanic and Asian Americans.
Map 2 shows that in 28 of the nation’s 100 largest metro areas, two or more minority groups are highly represented. These include New York, Chicago, Houston, and Dallas, where each of the three largest minority groups are highly represented. San Francisco and Los Angeles are among several California metro areas where both Hispanics and Asians are highly represented. There are 22 other areas where two minorities are highly represented, exemplified by Miami for Hispanic and black populations, Washington, D.C. for black and Asian populations, and Albuquerque, N.M. for Hispanics and American Indian or Alaska Natives.
Map 2
…
Where race-ethnic minority groups are highly represented in the 100 largest metropolitan areas
Hover over areas to view statistics
…
Source: William H. Frey analysis of US Census population estimates, 2018
A group is highly represented if its share of the area population is larger than its share of the national population for Hispanics (18.3%), blacks (12.5%), and Asians, Native Hawaiians and Other Pacific Islanders (5.9%) and at least 4% for American Indians/Alaska Natives, or persons identifying as multiracial
*Non Hispanic members of group
**Two or more minority groups are highly represented or persons identified as multiracial are highly represented
Meanwhile, 29 metro areas, mostly in the South, show disproportionate shares of black residents, while 11 metro areas, largely in the West and Southwest, house large Hispanic populations. Three metro areas—Boston, Minneapolis-St. Paul, and Portland, Ore.)—show a high representation of Asians alone.
Among the 100 largest metro areas, only 29 do not contain a highly represented racial minority. These are mostly located in the middle of the country; Pittsburgh, Cincinnati, and Kansas City are the three largest, with Scranton, Pa. as the smallest. As a group, they are growing more slowly than those with a larger minority presence, but each one has become less white than was the case with the 2010 census.
New Hispanic and Asian destinations
Hispanics and Asian Americans are the fastest-growing racial minority groups nationally, increasing by 18.6% and 27.4%, respectively, from 2010 to 2018. There is also a growing dispersion of both groups to new destinations, which tend to lie further afield than the familiar large metro areas.
In 1990, 39% of all U.S. Hispanics resided in just four metro areas: Los Angeles, New York, Miami, and Chicago. In 2018, 39% of U.S. Hispanics resided in seven metro areas, with Houston, Riverside, Calif., and Dallas added to the list (and each eclipsing Chicago in size). And beyond these, Hispanic growth is high in areas with smaller Hispanic settlements in all parts of the country.
Map 3
…
Metros with largest 2018 Hispanic populations and highest 2010-2018 growth*
Hover over areas to view statistics
…
Source: William H. Frey analysis of US Census population estimates, 2010 and 2018
*For metropolitan areas with populations of greater than 5,000 Hispanics
**National Hispanic growth rate between 2010-2018 is 18.6%
Map 3 depicts metro areas that grew the fastest over the 2010-18 period regardless of the size of their Hispanic populations. There are 138 metro areas where Hispanic growth exceeded nationwide Hispanic growth by over 150%, and, in 54 of these, by over 200%. These areas are spread all over the country, especially in areas where the Hispanic population is gaining a new foothold—in the Midwest, Northeast, and Southeast, including several parts of Florida. Scranton, Pa. leads all others in Hispanic population growth.
Despite growing more rapidly than the Hispanic population, the Asian population in the U.S. has a smaller footprint in most metro areas. Like Hispanics, Asians have large concentrations in a few gateway areas, led by Los Angeles, New York, and San Francisco. Yet while these three metro areas combined house 30% of Asians in 2018, nearly four-fifths of 2010-18 Asian population growth took place elsewhere.
Map 4
…
Metros with largest 2018 Asian* populations and highest 2010-2018 growth**
Hover over areas to view statistics
…
Source: William H. Frey analysis of US Census population estimates, 2010 and 2018
*Non-Hispanic Asians, Native Hawaiians and Other Pacific Islanders
**For metropolitan areas with populations of greater than 5,000 Non-Hispanic Asians, Native Hawaiians, and Other Pacific Islanders
***National Asian growth rate between 2010-2018 is 27.4%
Metro areas with rapidly growing Asian populations are located in interior parts of the country, especially in the Midwest and Northeast. For example, Indianapolis increased its Asian population from 41,000 in 2010 to 70,000 in 2018. Asian growth has also expanded in university and high-tech towns like Raleigh, N.C., Columbus, Ohio and Madison, Wis. While most of these magnets house relatively small Asian populations, notable exceptions are Seattle, Dallas, and Houston, whose substantial Asian populations have grown markedly since 2010.
New destinations for black Americans
The most notable shift for black Americans in recent decades has been a reversal from the historical Great Migration to traditional northern and West Coast destination areas, to a return to the South.
In 1990, New York led all metro areas in black population size, followed by Chicago, Washington, D.C., Philadelphia, Los Angeles, and Detroit. But by 2018, Atlanta had catapulted to second place. Washington, D.C., and Miami also rose in rank, while Houston and Dallas leapt ahead of Detroit and Los Angeles.
Map 5
…
Metros with largest black Populations, 2018*
Hover over areas to view statistics
…
Source: William H. Frey analysis of US Census population estimates, 2010 and 2018
*Non-Hispanic Black populations exceeding 150,000
The results of these shifts are depicted in Map 5, which displays the metropolitan areas with the largest black populations along with levels of 2010-18 growth. Atlanta is one of the top metro areas for black population growth, along with its southern counterparts San Antonio, Dallas, Austin, Orlando, Fla., and Charlotte, N.C. Yet these gains are not confined exclusively to the South: western metro areas such as Phoenix, Las Vegas, and Seattle show substantial growth in their black populations, as does Minneapolis. At the same time, many former destinations for black migrants—including Chicago, Detroit, Cleveland, Los Angeles, and San Francisco—registered losses in their black populations.
White population gains and losses
The nation’s white population has grown by a tepid 0.1% since 2010, and is projected to decline over the next decade. And areas with declining white populations are not likely to grow them by way of white immigration from abroad or white natural increase (the excess of births over deaths).
Thus, white population shifts are something of a zero-sum game: when some areas gain white migrants from other parts of the United States, the white populations from where they are emigrating from don’t stand to recover.
Map 6 displays white population gain and loss patterns among the nation’s 100 largest metropolitan areas. Since 2010, 45 of these areas sustained white population losses. These include relatively pricey areas such as New York, Los Angeles, and Chicago, but also areas that are less economically vibrant, especially since the Great Recession of 2007-09. Many of these are located in the industrial Midwest. But they are also prevalent in interior California, the Southeast, and New England.
Not all areas that are losing white residents showed total population declines since 2010. In 36 of the 45 areas, the combined gains of racial minority populations more than made up for white population losses.
Map 6
…
White* gains and losses in the 100 largest metro areas
Hover over areas to view statistics
…
Source: William H. Frey analysis of US Census population estimates, 2010 and 2018
*Non-Hispanic whites
Metro areas with increasing white populations are most prevalent in the Sun Belt region, especially Texas, the Southeast, and the Mountain West. This reflects similar migration patterns for racial minority groups; Phoenix, Denver, Dallas, Austin, and Nashville, Tenn. gained the most white residents in the past decade, with each also gaining substantial racial minority populations as well.
The kaleidoscopic patterns revealed by the latest U.S. population estimates indicate that the 2020 census will tell us that we are a more racially diverse nation than at any point in our history. And the fact that racial minorities hold an even bigger presence among our younger generations suggests that diversity will be the calling card of the nation’s demography in the 21st century, in ways that will have a lasting impact on our economy, politics, and society.
Interactive by Alec Friedhoff.
Related Content


Author

-
Footnotes
- Other than Hispanics, all racial groups discussed here are non-Hispanic members of those races; “Asian” here pertains to Asian-related groups including persons identified as Asian, Native Hawaiian or Other Pacific Islanders.
- That is, the county’s Hispanic, black, or Asian-related population exceeds the national percentage shares discussed above. For American Indian or Alaska Native populations—whose national share is 0.7%—their high representation is identified for counties in which their share exceeds 4% of the population.
- These include counties where one or more minority groups are larger than their national shares, and counties where persons identifying with two or more races exceed 4% of the population.
The Brookings Institution is committed to quality, independence, and impact.
We are supported by a diverse array of funders. In line with our values and policies, each Brookings publication represents the sole views of its author(s).


