
In December 2013, President Obama gave a speech on economic mobility, in which he called income inequality and lack of upward mobility “the defining challenge of our time.”
That challenge is front and center in America’s big cities today. Obama’s speech followed a series of municipal elections in November 2013 in which inequality figured prominently as a campaign issue. Foremost among these was in New York City, where Bill de Blasio won a landslide election after campaigning to address what he called a “Tale of Two Cities.” Similar themes were sounded in the successful campaigns and first days in office of Marty Walsh in Boston, Ed Murray in Seattle, and Betsy Hodges in Minneapolis. The “Google Bus” in San Francisco’s Mission District has shone a spotlight on growing economic divisions within that city. And income inequality will no doubt be a central issue in mayoral elections during the next couple of years in cities like Chicago and Washington, D.C.
Inequality may be the result of global economic forces, but it matters in a local sense. A city where the rich are very rich, and the poor very poor, is likely to face many difficulties. It may struggle to maintain mixed-income school environments that produce better outcomes for low-income kids. It may have too narrow a tax base from which to sustainably raise the revenues necessary for essential city services. And it may fail to produce housing and neighborhoods accessible to middle-class workers and families, so that those who move up or down the income ladder ultimately have no choice but to move out.
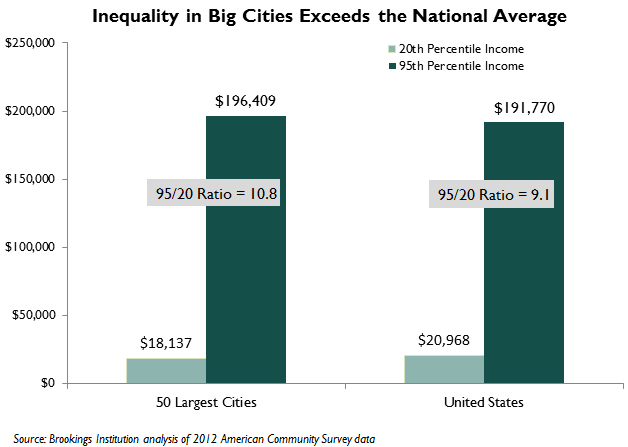
There are many ways of looking at inequality statistically; one useful way to measure it across places is by using the “95/20 ratio.” This figure represents the income at which a household earns more than 95 percent of all other households, divided by the income at which a household earns more than only 20 percent of all other households. In other words, it represents the distance between a household that just cracks the top 5 percent by income, and one that just falls into the bottom 20 percent. Over the past 35 years, members of the former group have generally experienced rising incomes, while those in the latter group have seen their incomes stagnate.
The latest U.S. Census Bureau data confirm that, overall, big cities remain more unequal places by income than the rest of the country. Across the 50 largest U.S. cities in 2012, the 95/20 ratio was 10.8, compared to 9.1 for the country as a whole. The higher level of inequality in big cities reflects that, compared to national averages, big-city rich households are somewhat richer ($196,000 versus $192,000), and big-city poor households are somewhat poorer ($18,100 versus $21,000).
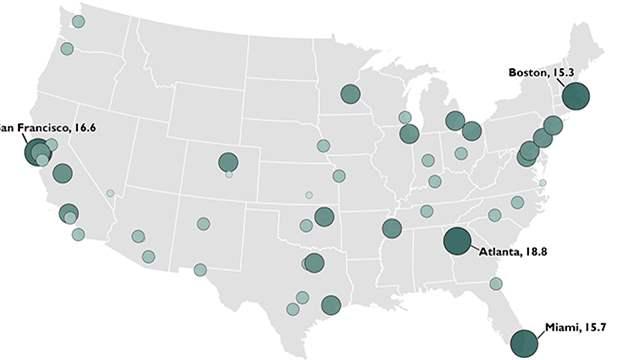
However, some cities are much more unequal than others. The big cities with the highest 95/20 ratios in 2012 were Atlanta, San Francisco, Miami, and Boston. In each of these cities, a household at the 95th percentile of the income distribution earned at least 15 times the income of a household at the 20th percentile. In Atlanta, for instance, the richest 5 percent of households earned more than $280,000, while the poorest 20 percent earned less than $15,000. In another six cities (Washington, D.C., New York, Oakland, Chicago, Los Angeles, and Baltimore), the 95/20 ratio exceeded 12. Overall, 31 of the 50 largest U.S. cities exhibited a higher level of income inequality than the national average.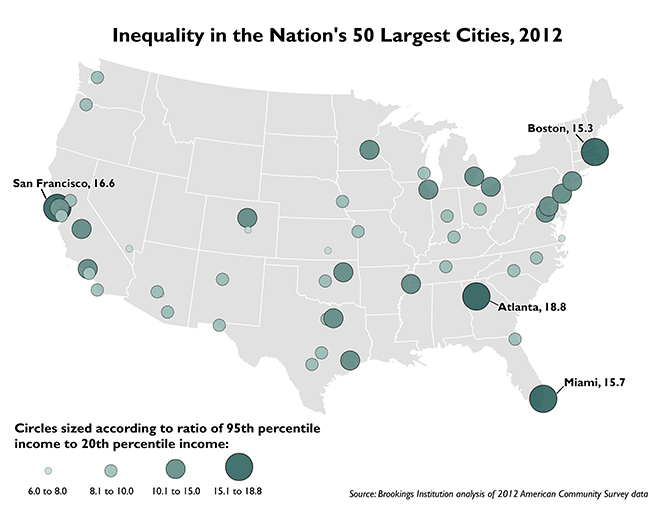
Nor are all unequal cities created equally. For example, compare San Francisco and Miami, which have similar 95/20 ratios. San Francisco’s ratio is high because its wealthy households have very high incomes, considerably higher than in any other major city ($353,000 at the 95th percentile). Miami’s ratio is high primarily because its poor households have very low incomes, third-lowest among the 50 largest cities ($10,000 at the 20th percentile). Miami has a lot of very poor residents and neighborhoods, but manages to retain several very wealthy enclaves. In San Francisco, skyrocketing housing costs may increasingly preclude low-income residents from living in the city altogether.
Compared to cities with high levels of inequality, cities with relatively low levels of income inequality are much more similar to one another. Most are Southern and Western cities with expansive borders, and either include many “suburban” neighborhoods alongside a traditional urban core, or are themselves overgrown suburbs like Mesa, Arizona and Arlington, Texas (what UNLV’s Rob Lang calls “boomburbs”). Upper-end incomes in these cities range from $150,000 to $200,000, while lower-end incomes mostly register between $19,000 and $24,000.
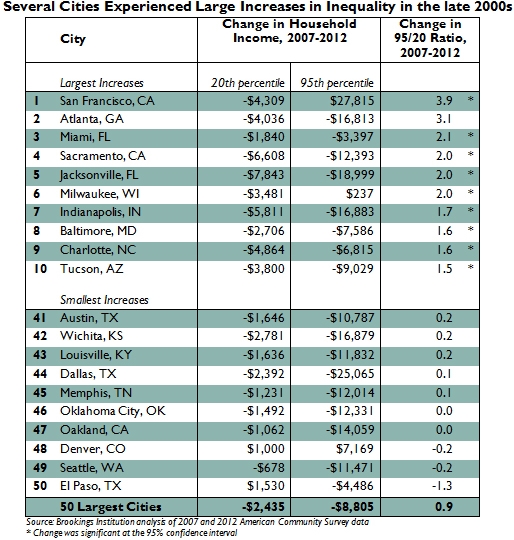
Growing debate about urban inequality suggests that the problem has gotten worse in recent years. But while inequality in cities is somewhat worse today than before the Great Recession, the trend is neither profound nor uniform. Overall, the 95/20 ratio across the 50 largest cities rose from 10.0 in 2007 to 10.8 in 2012. Not surprisingly, San Francisco experienced the largest increase in its ratio from 2007 to 2012. Income for its typical 20th-percentile household dropped $4,000 during that period, while income for its typical 95th-percentile household soared by $28,000. No other city saw nearly as large an increase in its rich households’ incomes.
Only 18 other cities among the top 50 registered statistically significant increases in their inequality ratios over those five years. Interestingly, most were not places where the rich made astronomical gains, but where low-income households suffered most from the recession and weak recovery. Many are Southern and Western cities—including Sacramento, Charlotte, Tucson, Fresno, and Albuquerque—where house-price collapses reduced work opportunities for poor households. Inequality was also up in places like Cleveland, Indianapolis, and Milwaukee, where poverty deepened as local manufacturing industries declined during the recession. In those cities, however, inequality has not become a leading political issue.
Inequality increased across cities despite the fact that rich households were less rich in 2012 than in 2007. In most cities (39 of 50), 95th-percentile incomes declined over the five-year period. But 20th-percentile incomes were also down, in most cities by larger proportions than incomes at the top. For instance, rich households in Jacksonville in 2012 earned nearly $19,000 (11 percent) less than five years prior. At the same time, incomes among the city’s poor households dropped nearly $8,000 (31 percent). In Jacksonville and many other cities, inequality rose not because the rich got richer while the poor got poorer—but because the rich became somewhat poorer while the poor got much poorer.
Seattle, where the inequality debate has fueled calls for a $15/hour minimum wage, turns out to have a relatively low inequality ratio (31st out of 50 cities). This fact is largely attributable to the relatively high incomes earned by its 20th-percentile households—$26,000, third-highest among the 50 cities. Like San Francisco, Seattle may have less poverty not only because people there earn more, but also because the region’s poor increasingly live in suburbia. For its part, the Emerald City experienced no measurable increase in inequality from 2007 to 2012, indicating that either its low-income households held their own during the recession, or that there were just fewer places for them to live in the city by 2012. If the latter is true, it seems as though residents of south King County may need a minimum wage boost at least as much as their central-city neighbors.
Large populations, diverse housing types, and generally progressive politics mean that most cities will always have higher shares of the rich and poor than smaller places. But the contemporary causes and consequences of inequality in cities vary greatly across the national map. Mayors who want to promote both economic diversity and economic mobility in their cities should take note.
The Brookings Institution is committed to quality, independence, and impact.
We are supported by a diverse array of funders. In line with our values and policies, each Brookings publication represents the sole views of its author(s).