A series of recent government reports on the nation’s demographic vitality, including one released this week, counter earlier suggestions that a post-recession “return to normal” is in the offing. The statistic that grabbed headlines as 2013 came to a close was a downturn in national population growth to the lowest rate (0.72 percent) since the 1930s. This figure follows a rise last year from the previous historic low, and is well below pre-recession growth rates that were closer to 1 percent.
According to the numbers just reported, births have declined and deaths have risen, in part a result of our aging population. Even so, the crude birth rate for 2012-2013—at 12.6 births per 1,000 population—is the lowest recorded in many decades. More importantly, the reported migration dynamics are once again headed in the wrong direction, following hopeful upturns last year.
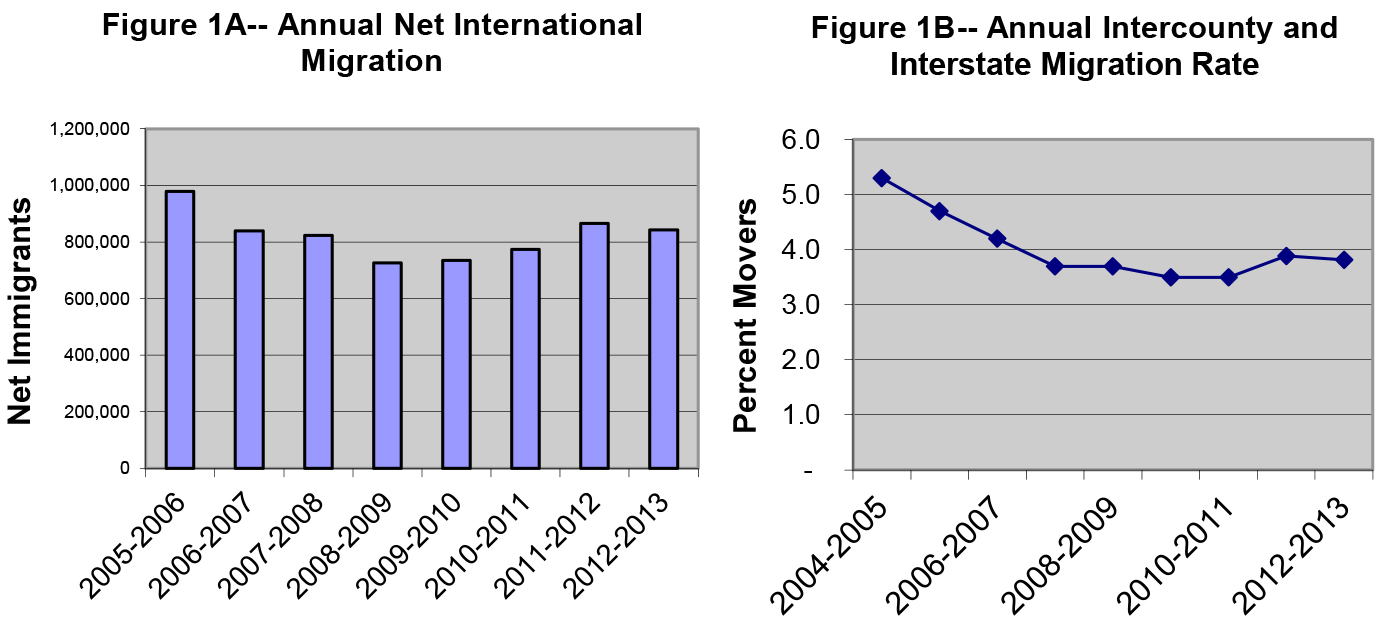
Immigration to the U.S. is a demographic yardstick for measuring the nation’s attractiveness to outsiders searching for both high- and low-skilled jobs. Due in large part to the recession, net inflows from abroad declined sharply, from 980,000 in 2005-2006 to just 725,000 in 2008-2009. Small gains followed on the heels of this decline, with a sharper gain last year (to 866,000) suggesting an upward trajectory. However, newly reported numbers from 2012-13—down to 843,000—run counter to that expectation (see Figure 1A).
Domestic movement across states, especially to recession-plagued parts of the South and West that were beginning to show signs of a comeback, showed disappointing results as well. A year ago, increased gains were seen in states that bore some of the greatest migration downturns during the recession and post-recession periods, as well as signs that overall long-distance migration was picking up. The comeback now appears to be stalled.
This slowdown was hinted at last fall when the Census Bureau released its annual national migration rate data, which showed that migration rates across counties and states showed downturns after a pickup from historic lows the year before (see Table 1B). The low mark—3.5 percent for 2009-2010 and 2010-11—was the lowest since 1948 when record keeping began, and well below the rates of 5 percent or greater that characterized the 1990s and early 2000s. Although the rise to a rate of 3.9 percent in 2011-2012 (representing 1.2 million additional movers) reflected a promising upward trajectory, the new lower rate of 3.8 percent in 2012-2013 suggests that a return to more normal rates will still take some time.
This delayed return to normal is also reinforced by state migration estimates, which were just released. A year ago, it looked as though a revival was in the offing for Sun Belt magnets, with most of the biggest gainers showing upticks from the year before. However, the more recent data for 2012-13 show six of the 11 top gainers in the South and West with lower migration gains than in 2011-2012 (see table). This includes Texas, the perennial migration gainer, which drew 29,000 fewer migrants.
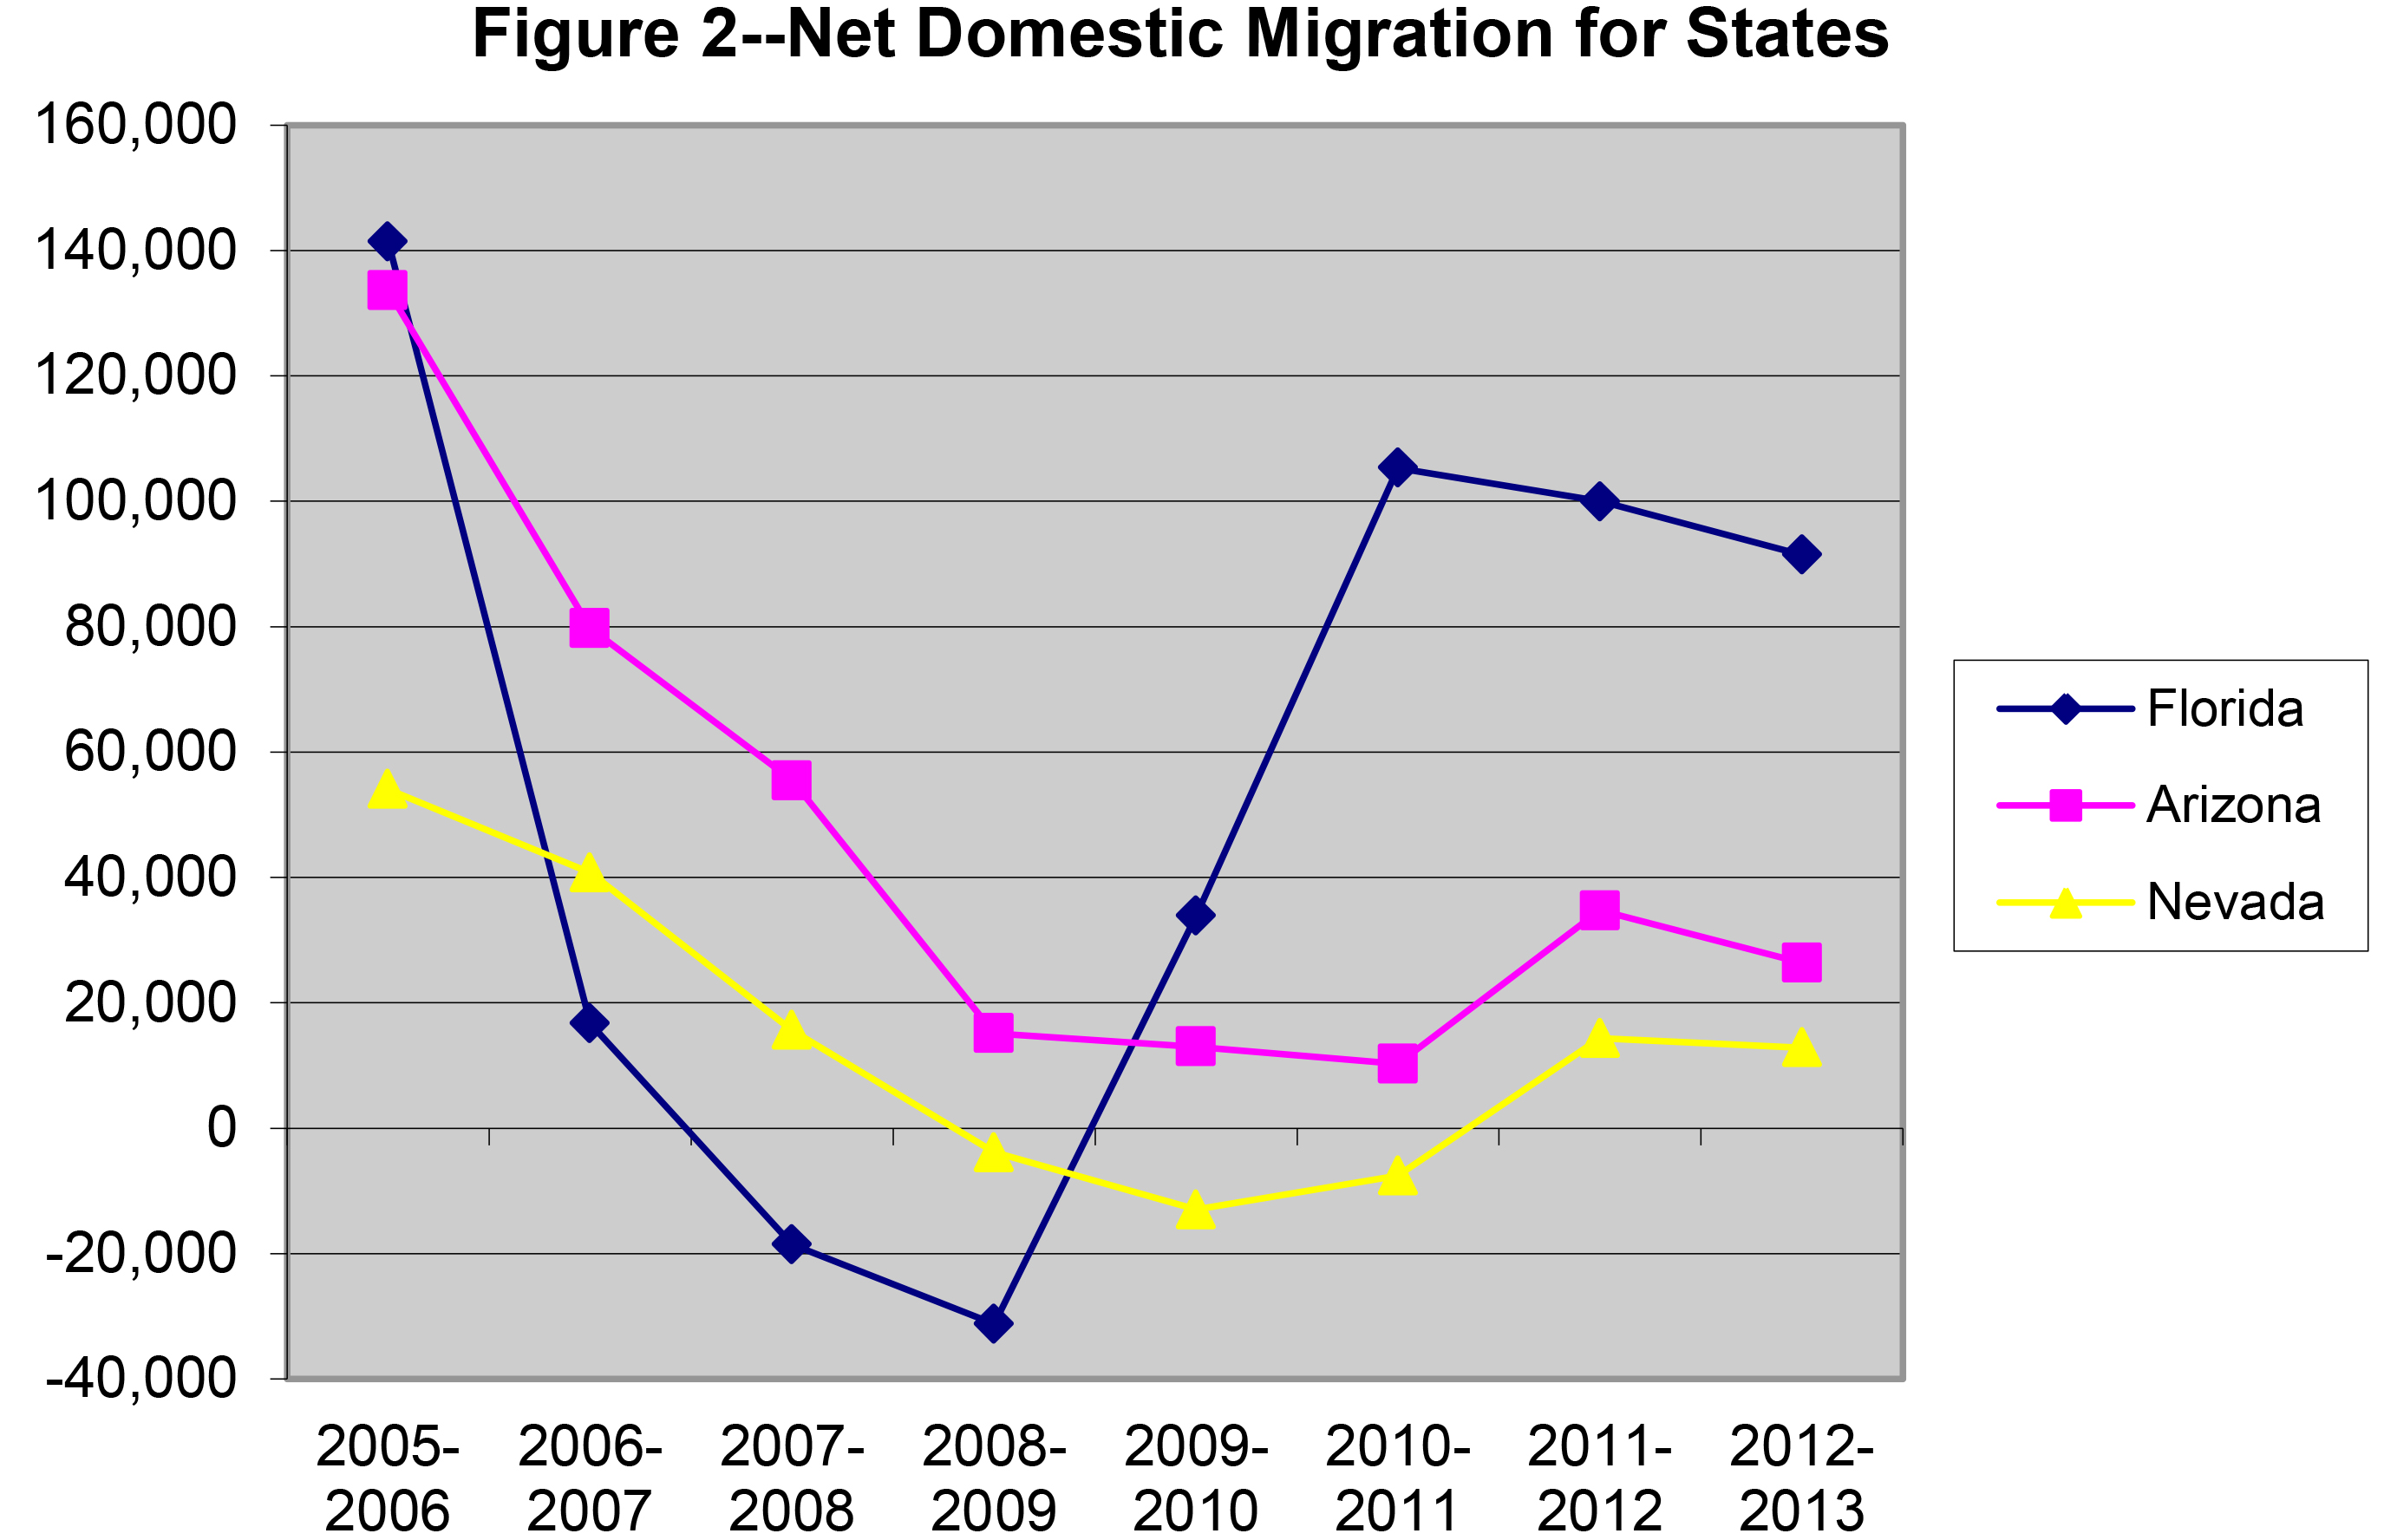
Especially noteworthy is the drop-off for three states that were poster children for the boom-then-bust migration patterns of the mortgage meltdown and recession years: Florida, Arizona, and Nevada. Each of these states showed heady migration levels in the mid-2000-2010 decade only to drop off dramatically as the economy got worse. Signs of revival began to emerge in 2010-11 for Florida, and in 2011-12 for the other two, although all remained well below their pre-2007 levels. However, as with many other Sun Belt states, their migration levels tapered off in 2012-2013 (see Figure 2).
This is not to say that snow belt to Sun Belt migration flows have halted, or even that they have returned to the low levels of the recession period. In fact, the 2012-2013 period shows higher migration gains among some Sun Belt states—notably Colorado, Utah, and North Carolina (as well as for a non-Sun Belt state, North Dakota).
What the new round of census statistics does suggest is that the return to “normal,” or pre-recession, migration flow levels from traditional exporting snow belt states like New York, New Jersey, Ohio, and Michigan to long-standing Sun Belt magnet states is occurring more tepidly and unevenly than had been expected. Potential migrants, especially young adult Millennials, appear to be more cautious in their responses to gradual upturns in housing and employment opportunities. As with economic indicators, demographic indicators suggest the recovery from the recession is occurring fitfully.
The Brookings Institution is committed to quality, independence, and impact.
We are supported by a diverse array of funders. In line with our values and policies, each Brookings publication represents the sole views of its author(s).


Commentary
Op-edUS Population Growth and Migration Sputter, Yet Again
January 24, 2014