Earlier this month the Congressional Budget Office published new estimates of income losses and gains in the Great Recession and in the recovery up through 2011. It is an update of earlier analyses, and it shows changes in pre-tax and post-tax incomes and in the distribution of federal tax burdens on low-, middle-, and high-income families.
The report offers insight into the role of government tax and benefit policy in protecting family incomes during the nation’s worst post-war recession. By almost any measure the policy was a resounding success. For middle-income families, tax cuts and higher government benefits erased almost 90% of the market income losses caused by the recession. For Americans with lower incomes the combination of tax cuts and more generous benefits offset virtually all the market income losses. Millions of laid off workers were clearly made worse off by the recession. But income replacement through the permanent tax and transfer system plus temporary measures to boost families’ spendable incomes achieved their intended goal. For poor and moderate-income families, wage and capital income losses caused by the recession were largely or wholly offset by tax cuts and benefit increases.
Voters and business reporters might find it astonishing that “successful” and “government policy” can appear in the same sentence without any trace of irony. This is especially true with regard to fiscal policies adopted in the Great Recession. Less than a year after Congress passed the American Recovery and Reinvestment Act (ARRA) in 2009, 74% of adults believed half or more of the funds spent under the stimulus bill was “wasted.” In fact, 45% of poll respondents thought “most” or “nearly all” the money spent under the ARRA was wasted. Since an overwhelming share of the funds authorized under the bill was spent on tax cuts, temporary benefit increases, and aid to state governments to maintain spending on education and health programs, poll respondents were either unaware of the allocation of funds or believed that taxpayers, benefit recipients, and state governments wasted the funds they received through the stimulus package.
More recent polling shows Americans remain skeptical of stimulus spending. In a 2012 poll the Pew Research Center found that just 37% of respondents approved while 41% disapproved of the 2009 stimulus package. The questionnaire did not determine why respondents disliked the bill. Many may have believed, as respondents did two years earlier, that much of the stimulus money was misspent.
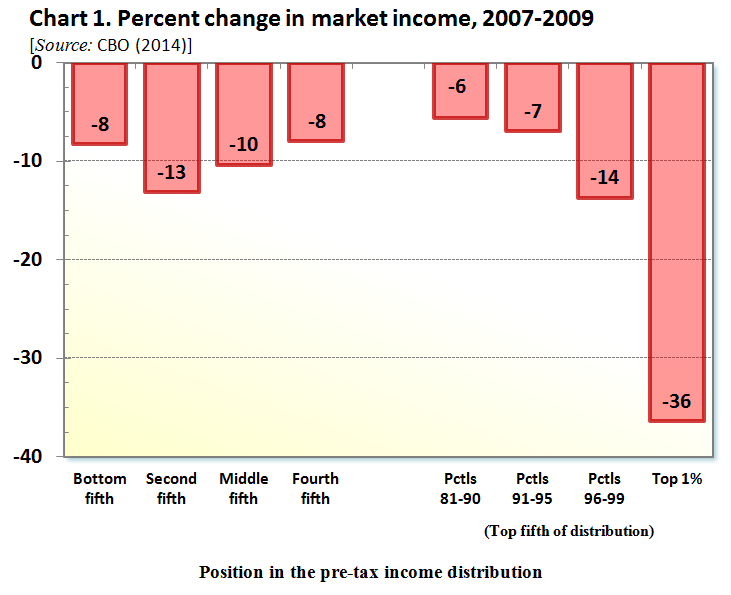
The new CBO report does not tell us how many stimulus dollars were misspent. But it does permit us to see how federal tax cuts and government benefit increases affected net family incomes in different parts of the distribution. Families in the middle one-fifth of households saw their market incomes plunge 10.4% between 2007 and 2009 (see Chart 1). Market income consists of wages and other compensation from paid work, net self-employment earnings, and earnings from interest, dividends, rents, realized capital gains, and other kinds of return on wealth. A drop in market income automatically cuts a family’s payroll and income tax liabilities, partially offsetting the direct hit to its income. The temporary tax cuts passed in 2008 and in the first term of the Obama Administration further insulated family incomes from the full effects of falling wages and capital income. CBO estimates that middle-quintile households saw their average market income fall $5,900, but $2,400 (or 41%) of the drop was offset by reduced federal taxes.
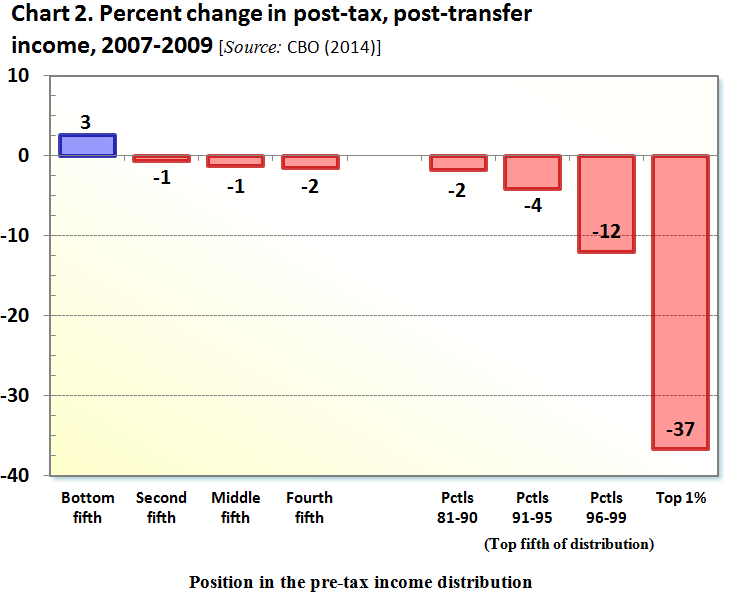
In addition, government transfer payments to middle-income families increased. For example, families with an unemployed breadwinner received unemployment benefits. Congress also passed temporary measures to boost weekly payments and extend the maximum duration of benefits. The increases in government benefits offset $2,800 (47%) of the average loss in market income sustained by middle-quintile families. Thus, about nine-tenths of the average drop in market income was erased as a result of lower federal taxes and higher public benefits. Instead of falling 10.4%, after-tax, post-transfer income in the middle quintile fell only 1.3% (see Chart 2).
Equivalent numbers for households in the bottom ranks of the income distribution show an even more impressive achievement. Market incomes fell sharply between 2007 and 2009, but federal tax cuts and higher benefits offset much of the loss. Families in the second quintile from the bottom saw their market incomes shrink slightly more than 13%, but tax reductions and benefit improvements meant their net or after-tax incomes fell just 0.7%. By 2009 households in the bottom one-fifth experienced a decline in market income equal to more than 8% of their pre-recession market income, but their post-tax, post-transfer income actually increased slightly. Of course, most households suffering big drops in market income saw only part of their losses replaced as a result of tax cuts and benefit hikes. The flip side is that many of us who experienced little or no income loss in the recession still received tax cuts that temporarily boosted our net income above pre-recession levels.
The CBO’s latest numbers also shed light on the debate over income distribution changes and the role played by public policy in accelerating or offsetting these changes. Many observers have pointed out the concentration of income gains so far in the recovery. Pavlina Tcherneva, an economist at Bard College, has calculated that 116% of the income gains in the economic recovery between 2009 and 2012 were the result of income gains obtained by households in the top one-tenth of the income distribution. Households in the bottom 90% of households on average suffered small income losses. Matthew Yglesias called Professor Tcherneva’s chart “the most important chart about the American economy you’ll see this year.” It is certainly one of the most widely republished.
As a guide to the distribution of economic gains over time the chart has two main shortcomings. First, it only shows income gains in expansions and disregards the distribution of income losses in recessions. Second, it focuses solely on market income gains and ignores the role of government taxes and transfer benefits in tempering the effects of higher or lower market incomes. The new CBO numbers show how these omissions can distort trends in inequality over time. Between 2007 and 2009, market incomes in middle-quintile households fell 10.4%. Among households in the top one-fifth of households, average market income fell considerably faster, 18.8%. Households in the top 1% of pre-tax incomes saw their average market income fall 36.4%, more than three times the percentage loss suffered by middle-income families (see Chart 1).
As noted above, the steep market income losses in the bottom three-fifths of the income distribution were largely or fully offset by reduced taxes and higher government transfers. This was not the case at the top the income distribution. Among households in the top one-fifth of the pre-tax income distribution, average after-tax income fell more than 16%. In the top 1% of the distribution, after-tax income fell 37% (see Chart 2). This was virtually the same percentage decline as the drop in their market income.
It is certainly true that income gains in the recovery have strongly favored the well off. It is also the case that income losses in the Great Recession, especially the losses in post-tax, post-transfer income, were highly concentrated among the well off. The CBO’s latest numbers confirm that an out-size share of income gains in the recovery has been obtained by households in the top one-fifth—and especially the top 1%—of pre-tax income recipients. This is true whether we focus on market income, pre-tax income including government transfers, or post-tax, post-transfer incomes.
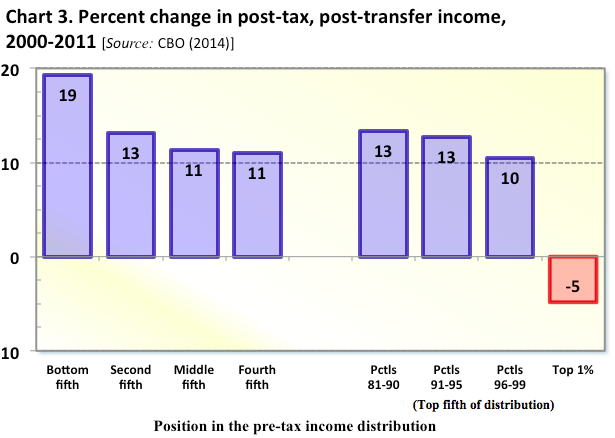
But CBO’s latest numbers sharply contradict the widespread impression that U.S. economic gains in the 21st century have been concentrated among the nation’s top income recipients. On the contrary, they show that the top 1% sustained the biggest income losses since 2000. In fact, every income group below the top 1% saw average after-tax income rise between 2000 and 2011 (see Chart 3). Middle-income families saw their after-tax incomes grow 11%. Only the top 1% of households experienced a drop in real, after-tax income. Their average income, after federal taxes are subtracted, fell 5%.
While widening market income inequality in expansions has fueled the perception that economic disparities are rising, changes in tax law and government benefit programs have in fact helped middle and lower income families enjoy modest real gains in after-tax incomes since the turn of the century. The fact that most middle-income Americans think their spendable incomes shrank may mean that some resources devoted to boosting family income have indeed been “wasted.” CBO’s numbers show middle class families experienced real income gains once the effect of tax cuts and benefit increases are included. If the gains are invisible to most families, we might wish to consider alternative policies to boost their net incomes.
The Brookings Institution is committed to quality, independence, and impact.
We are supported by a diverse array of funders. In line with our values and policies, each Brookings publication represents the sole views of its author(s).


Commentary
Op-edThe Stimulus Program Was a Smashing Success: It Erased Most Middle Class Income Losses in the Recession
November 25, 2014