The U.S. economy has largely recovered from the financial crisis. The unemployment rate has fallen to 5 percent, which policymakers have long characterized as full employment, and industrial capacity utilization is above the trend of the past 30 years. And in response, the Federal Reserve has raised its policy rate and begun a gradual program of interest-rate normalization. Yet, median household income remains well-below pre-recession levels, and over half of Americans believe they are still falling behind financially.1
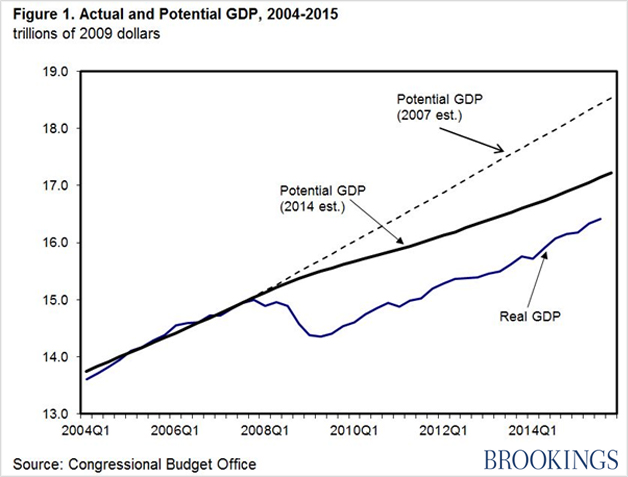
How do we reconcile the optimistic macroeconomic reports on resource utilization with the continued income losses? A more detailed examination of the data suggests that the reported economic recovery has been in part an illusion because it reflects a contraction of aggregate supply rather than a strong expansion of demand. It is most evident in the continuing fall in the labor force participation rate and very modest gains in productivity. The aggregate dimension is most evident in the comparison of actual GDP with the estimates of potential GDP published by the Congressional Budget Office (CBO), as shown in figure 1. The top line is based on the CBO projections released at the end of 2007 and extending out to 2017. However, as the sluggish recovery dragged on, the CBO cut back its estimates of potential GDP growth to the 2014 projections shown in the middle line.
Meanwhile, the weak growth in GDP implied a growing gap relative to the 2007 expected growth in potential, and all of the current reported recovery is due to the sharply lower current estimate of potential. Even the revised estimate of potential GDP appears too high and the CBO is likely to lower it further in the next budget cycle. While the gap between actual and potential GDP is still reported as a substantial 4 percent, the unemployment rate has already dropped below the rate that CBO associates with full employment. While the GDP gap and the unemployment rate do not have to be in complete agreement, the difference seems unduly large.
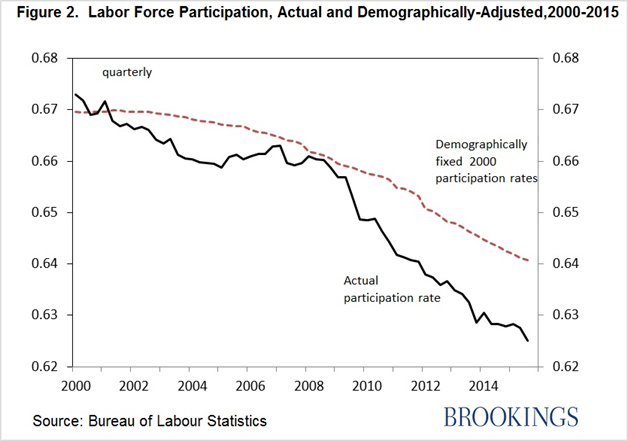
The continuing fall in the labor force participation rate has been an area of particular surprise. Initially, the drop in the participation rate was widely attributed to demographic change, as the Baby Boom generation entered their retirement years, and a temporary discouraged-worker effect of individuals leaving the labor force in the belief that no jobs were available as the Great Recession hit and dragged on. The latter group was expected to return to the labor market once overall conditions had improved. We can illustrate this phenomenon in figure 2 by separating the drop in the aggregate participation rate since 2000 into two components.
The demographic element is measured by holding the participation rates within 5-year age categories constant at the values of the year 2000, and allowing the overall rate to change only with shifts in the age-sex composition of the population of labor force age. As shown in the figure, the demographic change is substantial and ongoing, but the surprise lies with the growing magnitude of the perceived discouraged worker component. In terms of changing trends, it is concentrated among women aged 25-34 whose participation rate has fallen back to that of the early 1990s. The male rate has continued a decline stretching back for several decades. In addition, a pattern of rising participation rates among older workers (55 and over) has stopped. The reasons for these changes are not fully understood, but they appear to be more than cyclical.
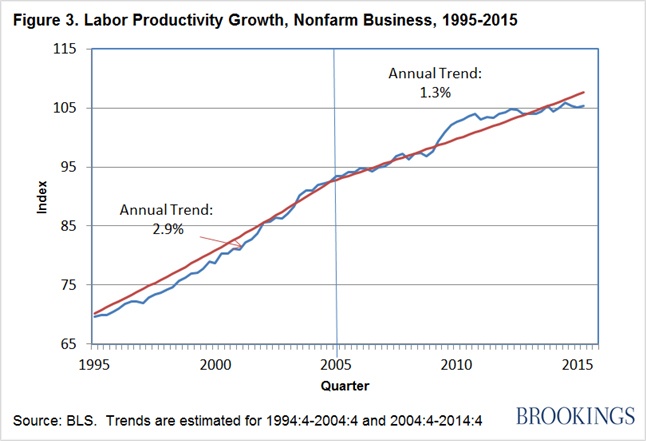
The supply-side concerns are also apparent in the slowing pace of productivity change in recent years (figure 3). There is growing evidence of a break in productivity performance around 2005, marking the end to the information and computing technologies boom of the late 1990s, and a return to the modest gains that dominated in the interval of 1972-95. Since 2005, labor productivity has improved at less than half the rate of the prior decade (1.3 versus 2.9 percent). There was a short-term surge of productivity gain in the early stages of the economic recovery by it quickly tapered off and has averaged less than ½ percent annually over the past five years. To the extent that productivity growth has been dominated by innovations in information and computing technologies, a slowdown seems inevitable as much of the industry has moved outside of the United States (Apple Inc., the largest IT company, has no U.S. production facilities), and in the retailing sector with the shift to large box stores, which were a source of major productivity gain, and now seems complete.
With a declining proportion of Americans in the workforce and near stagnate levels of productivity, there is little room for gains in real incomes. We do not know if these trends will continue in the future, but there are no signs of a near-term turnaround .
1.
U.S. Census Bureau at https://www.census.gov/hhes/www/income/data/historical/household/, and Pew Research Center (January 20, 2015). Household incomes are adjusted for inflation using the CPI-U-RS. Median income in 2014 was 6 percent below the pre-recession (2007) level, and only the elderly (65+) report a gain.
The Brookings Institution is committed to quality, independence, and impact.
We are supported by a diverse array of funders. In line with our values and policies, each Brookings publication represents the sole views of its author(s).


Commentary
Op-edLimited gains in living standards caused by a supply-side recession
December 21, 2015