Brookings researchers are asking Black people1 in four U.S. counties to help them map their communities and explore how structural racism is operating locally and impacting health and well-being.
Based on existing data, Brookings has plotted the locations of some of the institutions and infrastructure in Howard County and Baltimore County in Maryland and Spalding County and Forsyth County in Georgia.
If you live in one of these counties, we would like to hear from you. What did we miss? How do these organizations and resources work where you live? How do these resources impact your sense of health and well-being? Please check out the interactive below and fill out this reference form with your thoughts.
This local community profiles mapping tool is the first step in our case study research approach in four U.S. counties. The tool communicates what we currently know about the community assets present in Howard County and Baltimore County in Maryland and Spalding County and Forsyth County in Georgia based on available data.
What is included in the tool
This tool displays interactive maps of each of the four selected counties, detailing how community assets are distributed within the counties, overlaid with the Black population. The community assets are divided into three categories: income and wealth; institutions; and infrastructure.
To see this tool in action or for more information about the data, read below to view the local community profiles and read our Data and analysis section further down the page.
How the tool can be used
Individuals interested in using this tool should first pick a county to focus on. From there, they can select from 10 community assets and view how they are distributed within the county relative to where the Black population lives.
The base layer of the map below shows the percentage of Black people living in a census block group2, which are smaller areas within the county.
Using the drop-down menu below, select a community asset to get started. Once an asset is selected, it will display on the map on top of the base layer. Together, these two variables display where local community assets are located relative to where Black people in the county live.
You can look at all 10 community assets individually alongside the Black population distribution. If you use your mouse to hover over a census block group, you can learn specific data about the location.
The purpose of this mixed-methods case study research project is to provide local agencies, institutions, and individuals interested in improving the condition of their region’s Black population a more comprehensive understanding of the existing condition of that population, so such work may be directed to the most helpful channels. This project relies on the foundational methods employed by W.E.B. Du Bois’ sociological study “The Philadelphia Negro” to inform the purpose and research design.
In summer 2021, Brookings Metro’s Valuing Black Assets Initiative established a partnership with the NAACP with the purpose of using empirical evidence to dismantle the injustice Black people in this nation face, improve the condition of Black people in the U.S., and support Black well-being.
The first major result of the collaboration is the Black Progress Index, an interactive data visualization tool that allows users to explore indicators of life expectancy at the local level. The Index demonstrates how structural racism3 operates at the local level and take years off Black people’s lives.
Building off the work of the Index, this project is a mixed-methods case study research project focused on identifying the local community assets that improve health and well-being outcomes in Black people’s lives, and describing how structural racism erodes those assets.
We understand community assets4to include the local relationships, social networks, systems, institutions, governance structures, infrastructure, and neighborhood resources that support health and well-being.
Because these case studies combine quantitative knowledge with new qualitative data informed by the voices and perspectives of local residents, relationship building (efforts to foster collaborative connections and bi-directional communication between our research team and local community members) and power sharing with local residents are core to the success of this work.
This collaboration will inform how people experience racism in their everyday lives and generate recommendations to improve Black health and well-being locally. We also intend to use the knowledge gathered to further contextualize the Black Progress Index results and identify new or interacting variables shaping well-being that were not possible to identify in the Index’s analysis of existing quantitative data.
Related Books
To better understand how structural racism erodes community assets, we focused our research on four U.S. counties. We selected two counties in the same state and core-based statistical area to keep local factors that might impact health and well-being (for example, climate) constant, and better explore how differences in community assets might be impacting Black people’s lives.
We selected the four counties included in this tool using the following process:
- Starting from the Black Progress Index county-level data, we identified all possible county pairs.
- Then, we created a variable which identified the difference between the Black Progress Index score in each county within a pair.
- County pairs were selected as candidates if they had the maximum difference in their Black Progress Index scores and had one county where Black life expectancy is above the national average (74.4 years) and another county below the average.
- Next, we limited potential county pairs to those that had one county that fell within the top 90th percentile and another in the bottom 10th of the Black Progress Index rank. This resulted in five potential county pairs.
- Finally, we prioritized county pairs with known local assets that may impact well-being (for example, historically Black colleges and universities), pairs in different regions of the U.S., distance from the core research team, and locations where we had already built relationships.
The data used in this tool was originally aggregated by our colleagues in an October 2022 report. We did not rely on their original typology. Beginning with their full list of variables, we underwent the following process to identify the 10 community assets included in this tool:
- All variables with geographic identifiers (e.g., FIPS code) or flags associated with the primary analysis were not considered.
- Understanding community assets to be inclusive of relationships, social networks, systems, institutions, governance structures, infrastructure, and neighborhood resources, we labeled the remaining variables into broad community asset categories. The existing data did not include variables that could be used to represent relationships, social networks, broad systems, or governance structures. The existing data provided insight into institutions, infrastructure, and neighborhood-level income and wealth.
- We met as an internal research team to come to a consensus about labeling and the associated categories.
- We then considered the specific community assets each of the variables within the categories were related to. For example, historic sites and museums as examples of cultural institutions, and regional parks as examples of green space infrastructure.
Related Content


Authors


-
Footnotes
- Black people: In this project, “Black people” refers those who identify as Black, and/or those who are racialized as Black. Racialization is the processes by which a group of people becomes defined by their race; this gives meaning to one’s racial identity, including how it relates to social structures, institutions, and systems in society
- Census block groups: The data in these maps is broken down into census block groups. Census block groups are smaller geographic units within counties. They generally contain between 600 and 3,000 people, and are made up of a cluster of census blocks. Census blocks are formed by streets, roads, railroads, streams and other bodies of water, other visible physical and cultural features, and the legal boundaries defined by the Census Bureau. The census block group is the smallest geographic area for which the decennial census tabulates and publishes data.
- Structural racism: “The totality of ways in which societies foster racial discrimination through mutually reinforcing systems” (1453) Bailey, Z. D., Krieger, N., Agénor, M., Graves, J., Linos, N., & Bassett, M. T. (2017). Structural racism and health inequities in the USA: Evidence and interventions. The Lancet, 389(10077), 1453–1463. https://doi.org/10.1016/S0140-6736(17)30569-X
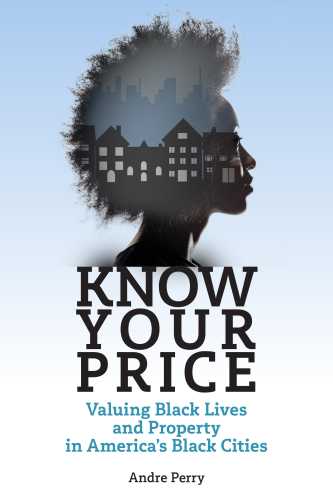
- Community assets: The tangible and intangible resources that can be exchanged for quality-of-life improvements. This definition is adapted from Andre Perry’s “Know Your Price: Valuing Black Lives and Property in America’s Black Cities.” These community assets include local relationships, social networks, systems, institutions, governance structures, infrastructure, and neighborhood resources that support health and well-being.
The Brookings Institution is committed to quality, independence, and impact.
We are supported by a diverse array of funders. In line with our values and policies, each Brookings publication represents the sole views of its author(s).