As the Millennium Development Goals approach their 2015 deadline, debates are in full swing about what might form appropriate targets for Sustainable Development Goals (SDG) to 2030 and beyond. At the intergovernmental level, there is active debate around setting a formal SDG target at perhaps 20 or 25 for 2030. Meanwhile Bill and Melinda Gates recently made a high-profile “bet” that global under-5 child mortality will drop from around 46 per 1,000 live births today to 23 by 2030.
In considering potential new goals, a first step is to adopt a clear set of terms. Trajectories usually extrapolate from recent trends. Projections imply assumptions about the future. Possibilities examine potential outcomes under a range of scenarios. Why care about such basic word choices? Simply put, because we need to ensure past trajectories don’t lead to flawed projections that limit our thinking regarding future possibilities.
Trajectories can change dramatically
In a recent paper examining long-term global trends in under-5 mortality, I found two clear structural shifts in mortality trends since 1990, especially in sub-Saharan Africa. Global patterns of progress changed considerably between the early 1990s and late 1990s, and then again over the course of the mid-2000s. For a large number of countries, using the past as of around 2000 to predict the future through to 2015 would have led to huge errors.
Figure 1: Worldwide deaths of children under-5 declined much faster than history would have predicted as of 2000
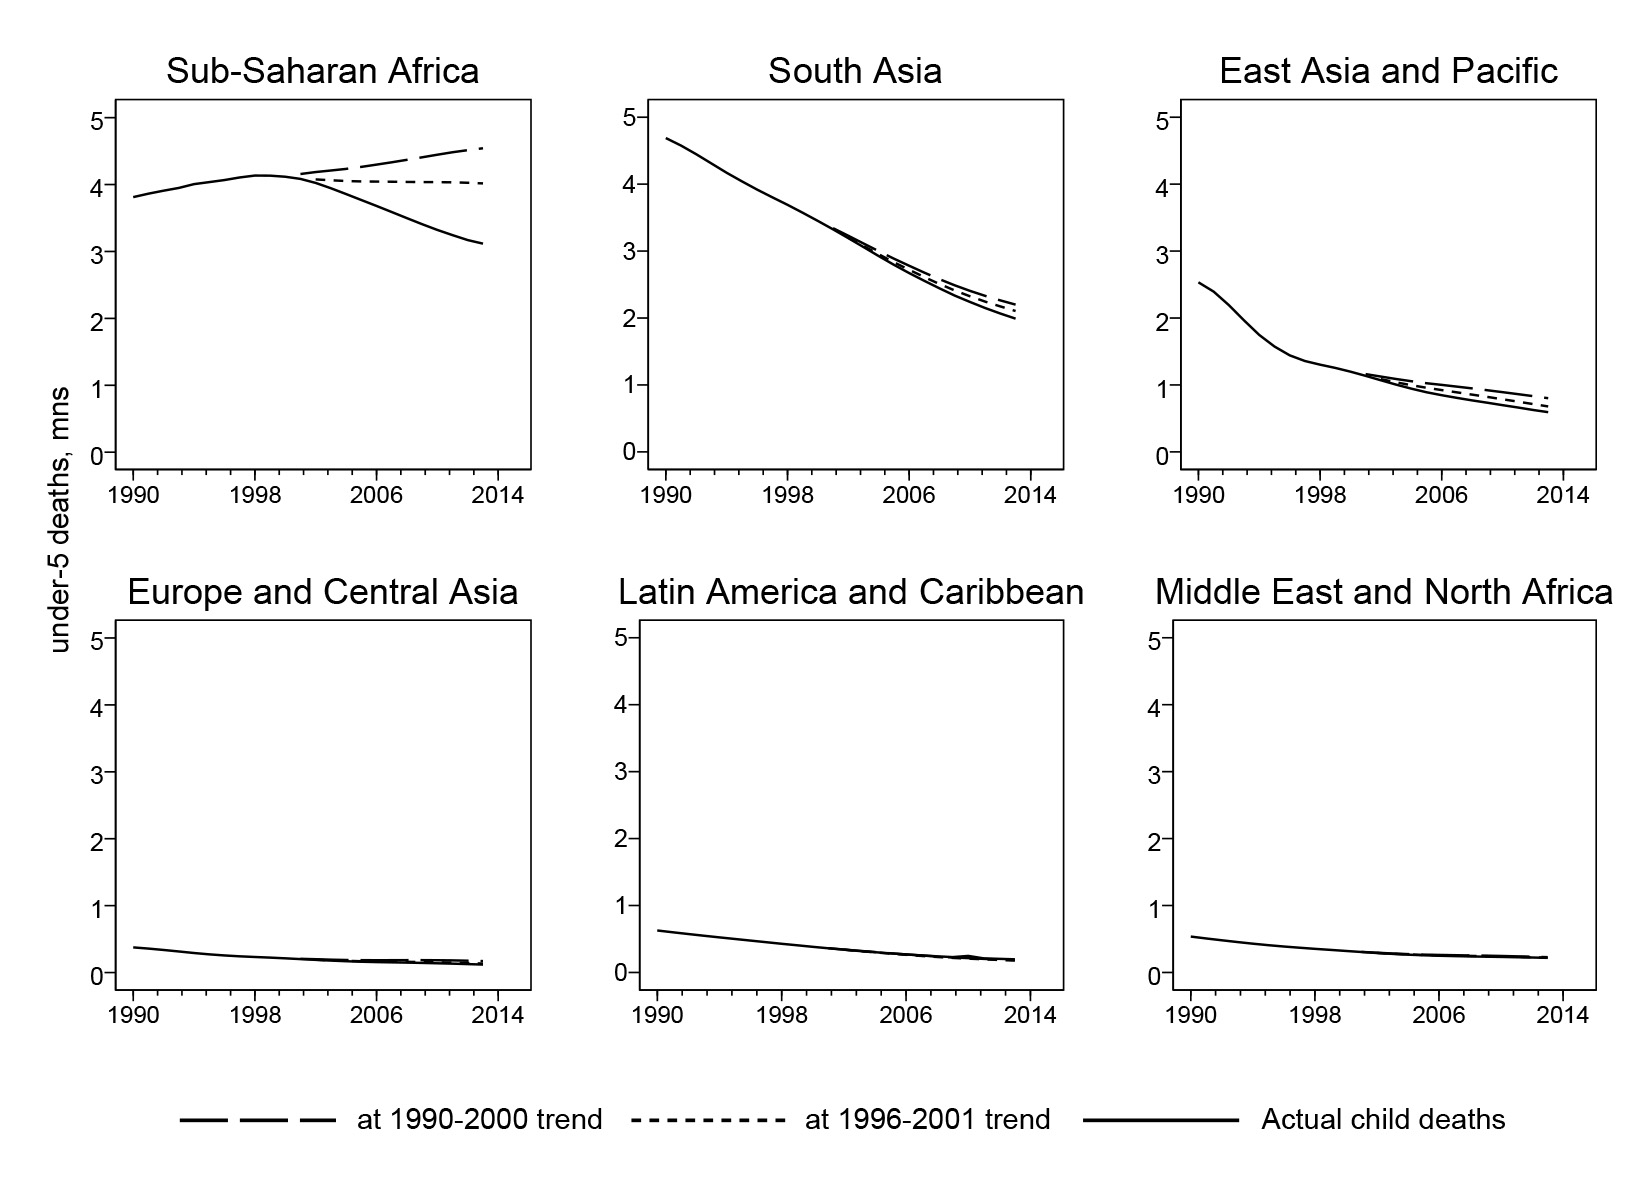
Figure 1 shows the magnitude of the implied mistake across each region, measured by millions of deaths on the vertical scale. The solid line shows the actual data, while two sets of dotted lines show counterfactuals based on trajectories as of 1990 to 2000 and then 1996 to 2001, respectively. The biggest difference is in sub-Saharan Africa, where the trajectory of 1990-2000 would have seen child deaths increasing each year to nearly 5 million today. Meanwhile, the trajectory of 1996-2001 would have flat-lined at around 4 million deaths annually. But instead, progress accelerated dramatically and the regional child death count dropped to about 3 million in 2013.
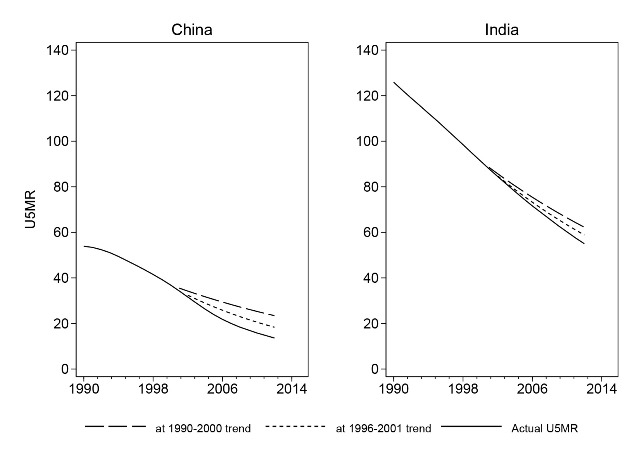
Changes in trajectory were not limited to Africa. Many Asian countries saw significant shifts, including China and India, as did post-Soviet economies. Figure 2 shows the earlier under-5 mortality rate (U5MR) trajectories alongside the actual paths for China and India. During the early 1990s, China’s mortality rates were dropping by a little more than 1 percent per year. Then, in the 2000s, mortality rates declined precipitously, by up to 9 percent per year.
Figure 2: Under-5 mortality progress accelerated in China and India too
Looking Forward to 2030
These recent cases provide important context for considering possible global goals for 2030. In last fall’s paper I also calculated the current 2030 trajectory for U5MR in each of 141 developing countries. This is done by extrapolating the 2001 to 2013 compound average annual rate of progress all the way out to 2030. Recently I went back to review these country-level results and see what they can tell us about aggregate global trends and how they relate to high mortality countries in particular.
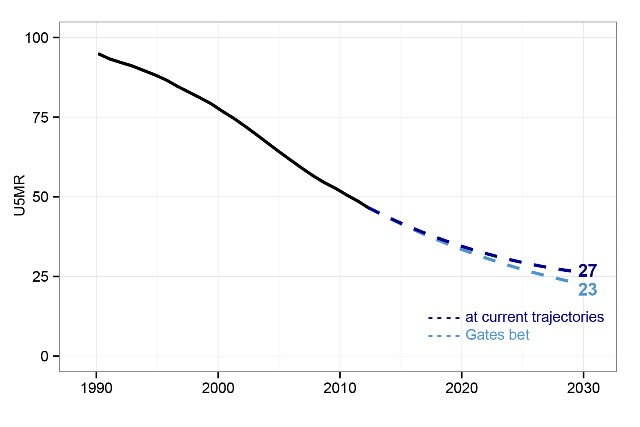
The results provide two key insights. First, as shown in Figure 3, the world is currently on a course to achieve a global U5MR of 27 per 1,000 live births by 2030– or 26 if extrapolating from faster trends since 2005. So a global target of 20 and Bill and Melinda Gates’s recent bet are only slightly more ambitious than current trajectories.
Figure 3: What Might Child Mortality Rates Be in 2030? Bill and Melinda Gates’ bet is only slightly more ambitious than current trajectories
Second, the country-specific results (see page 31 in the paper), show that at least 58 countries are on a trajectory for U5MR of at least 20 by 2030. Within this group:
- 14 countries are on course for U5MR of 20 to 24
- 23 countries are on course for U5MR of 25 to 49 (including populous India at 26)
- 17 countries are on course for U5MR of 50 to 99 (including Pakistan at 60 and Nigeria at 63), and
- 4 countries are on course for U5MR of greater than 100 (CAR, Chad, Somalia, and Angola).
The latter categories are the top global SDG priority cases for “bending the curves” on child mortality.
What Are the Possibilities?
The global experience since 2000 underscores the risk of simple extrapolations. Nonetheless, the past 15 years provide a helpful starting point for considering what is possible over a 15 year period. Consider Angola, likely the world’s worst case child mortality starting point in 2015. Barring dramatic shifts in forthcoming data reports, the country will begin the SDG period with a U5MR of around 158. This is very high, although some MDG success stories started with even higher mortality rates in 2000, including Malawi (at 174) and Rwanda (at 182).
Table 1 shows what could happen if Angola replicates the rates of progress from a variety of country success stories since 2000. Malawi, for example, is on a course to cut mortality by 66 percent by 2015, a result that very few people would have predicted in 2000. If Angola matches the same pace of progress moving forward, it arrives at a U5MR of 54 by 2030.
Rwanda offers another positive reference point, being on course to cut mortality by 75 percent. Applied to Angola, this would lead to U5MR of 40 by 2030. Cambodia provides an in-between example, with its likely 69 percent mortality drop over 15 years. That rate of progress would bring Angola down to 49 by the likely SDG deadline.
Table 1: Applying some 2000-2015 rates of progress to high-mortality Angola
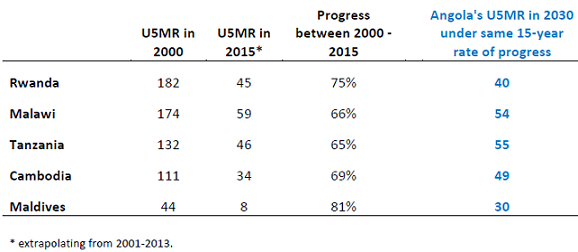
How far can success go? The fastest rate of progress since 2000 has been achieved in Maldives. If it continues all the way to 2015, the country will have achieved an 81 percent reduction in U5MR over 15 years. Applied to Angola, this would result in a final mortality rate of 30 per 1000 live births by 2030. That is still higher than the proposed global targets of 20 or 25, but roughly equivalent to today’s mortality rate in Morocco, which would be an extraordinary result.
The Upshot
The figures above all underscore how important it is to distinguish between trajectories, projections, and possibilities. Trajectories can change quickly, and should not be confused with projections, especially over an extended period. At the same time, the range of recent country experiences helps to illuminate the possibilities for a potential next generation of results.
Of course, there is no reason to presume that any recent rates of progress will continue. The bounds of possibility are never fixed. Progress could always end up accelerating even further…
The author thanks Christine Zhang for outstanding research assistance in conducting the underlying analysis for this post.
Disclosure: The Bill & Melinda Gates Foundation provides support to Brookings’ Global Economy and Development Program, including for some of the author’s research. The foundation had no involvement in the underlying analysis or drafting of this post.
The Brookings Institution is committed to quality, independence, and impact.
We are supported by a diverse array of funders. In line with our values and policies, each Brookings publication represents the sole views of its author(s).


Commentary
What does the past tell us about the future? Possibilities for child survival in 2030
May 7, 2015