Totaling more than $111,000,000.00, the 2014 North Carolina Senate contest between Kay Hagan and Thom Tillis is the most expensive Senate election in the nation’s history (not adjusted for inflation). As we investigated earlier this week, outside money has been flowing into American politics in the wake of the Supreme Court’s Citizens United decision in 2010.
When candidate and independent spending are combined, 2014 ranks among the most expensive, if not the most expensive, in history. However, understanding campaign spending takes more than a simple examination of total dollars. Spending differences across states can occur for a variety of reasons, including geographic size, population size, and the expense of media markets.
As a result, a more useful metric for understanding the magnitude of campaign activity is spending per voter, and 2014 offers an interesting case: Alaska. This year, Alaska saw a highly competitive Senate race in which both outside groups and candidates spend substantial amounts of money. Alaska ranks 47th in population with just over 700,000 residents and an estimated 503,000 eligible voters. After adjusting spending (both candidate and independent expenditures) for each state’s estimated voting eligible population, Alaska’s 2014 Senate race, unsurprisingly, ranks as the most expensive in US history.
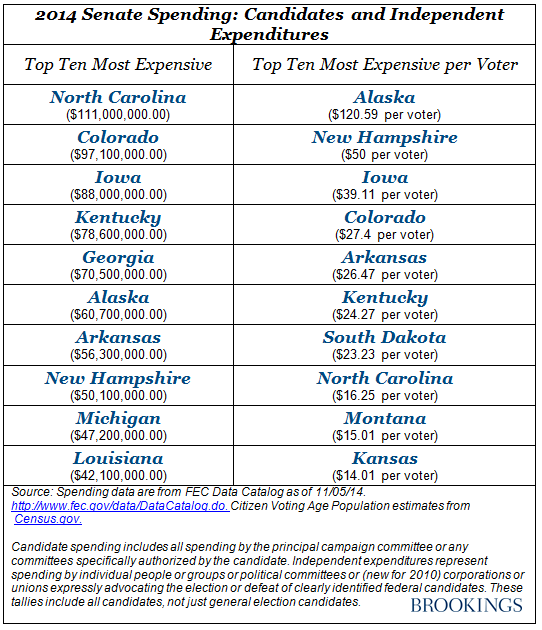
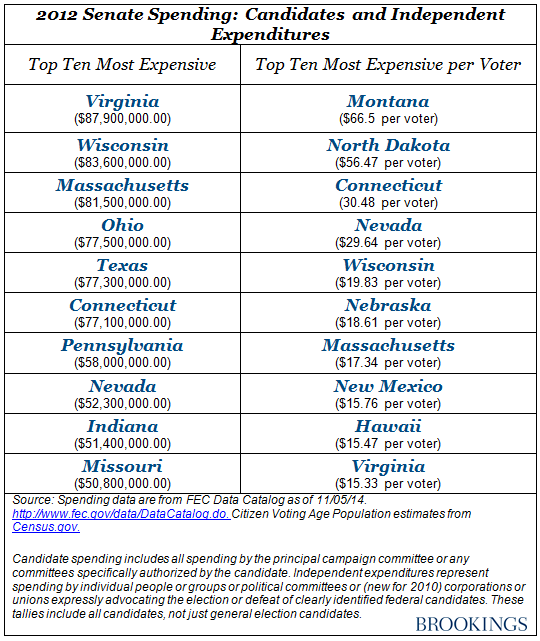
Alaska originally ranked 6th most expensive in 2014, with about $60 million spent total. But it jumps to first place in dollars spent per voter. Candidates and outside groups spent roughly $120 per voter in Alaska this year, about double the next most-expensive race, Montana 2012, where candidates and outside groups spent $66.5 per voter. By comparison, the $111 million Senate race in North Carolina—with a voting-eligible population of about 6,826,610—equaled only $16.25 per voter. That’s still far above the median spending per race for all three cycles ($7.3 per voter) but certainly serves to put the spending in context.
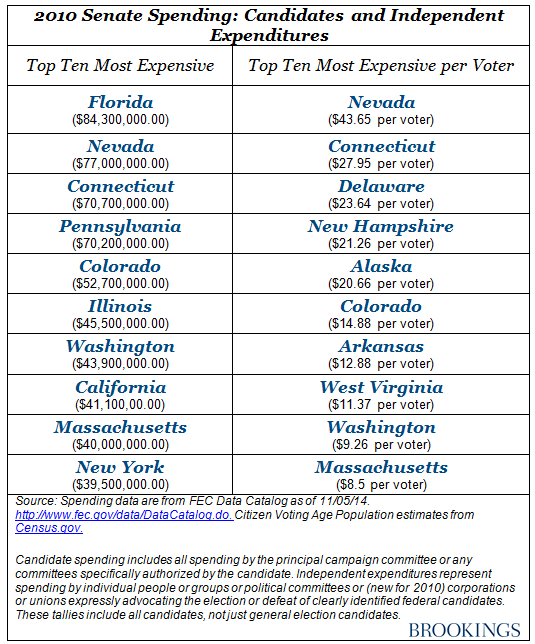
Relative to 2012 and 2014, in terms of both combined and per-voter spending, 2010 could be considered one of the cheaper cycles for Senate races thus far.
These data lend some support to the observation that, since Citizens (and more recently McCutcheon v. FEC) independent expenditures are quickly outpacing contributions to candidates. But given changes in reporting requirements and limited data, there is still a lot about outside spending we still don’t know.
All in all, candidate and outside group spending totaled just over a billion dollars in Senate races in 2014. The fact that North Carolina alone accounted for more than ten percent of that spending is astonishing, but no less remarkable is the intensity of spending per voter in Alaska. But if spending continues to grow as it has the last three election cycles, both of those records will likely be shattered in 2016.
The Brookings Institution is committed to quality, independence, and impact.
We are supported by a diverse array of funders. In line with our values and policies, each Brookings publication represents the sole views of its author(s).

Commentary
How Much Did Your Vote Cost? Spending Per Voter in the 2014 Senate Races
November 7, 2014