From 2000 to 2018, the labor force participation rate of 16- to 64-year-olds fell 3.6 percentage points. In previous work, we have shown that declining labor force participation among young people contributed substantially to this decline. In this analysis, we describe how teenagers (16–19-year-olds) have shifted away from working or seeking work and the impact this shift has had on the aggregate labor force participation rate.
While declining summer employment is part of the story, the bulk of the teenage reduction in labor force participation comes from fewer teenagers being jointly enrolled in school and participating in the labor force during the academic year. We find that—despite the low teen share of the working-age population (8 percent)—if teens had still participated in the labor force at their 2000 rates, aggregate 16–64-year-old participation would be more than 1.3 percentage points higher.
Many factors are at play in the decline of teen labor force participation, including increased school enrollment, seasonal employment, decreased returns to work, reduced demand for low-wage work, minimum wage hikes, and competition from older workers or immigrants. Time pressure is another driver of reduced teen participation. Teens have many demands on their time and those demands fundamentally differ between the academic year and summer.
School is not out for the summer
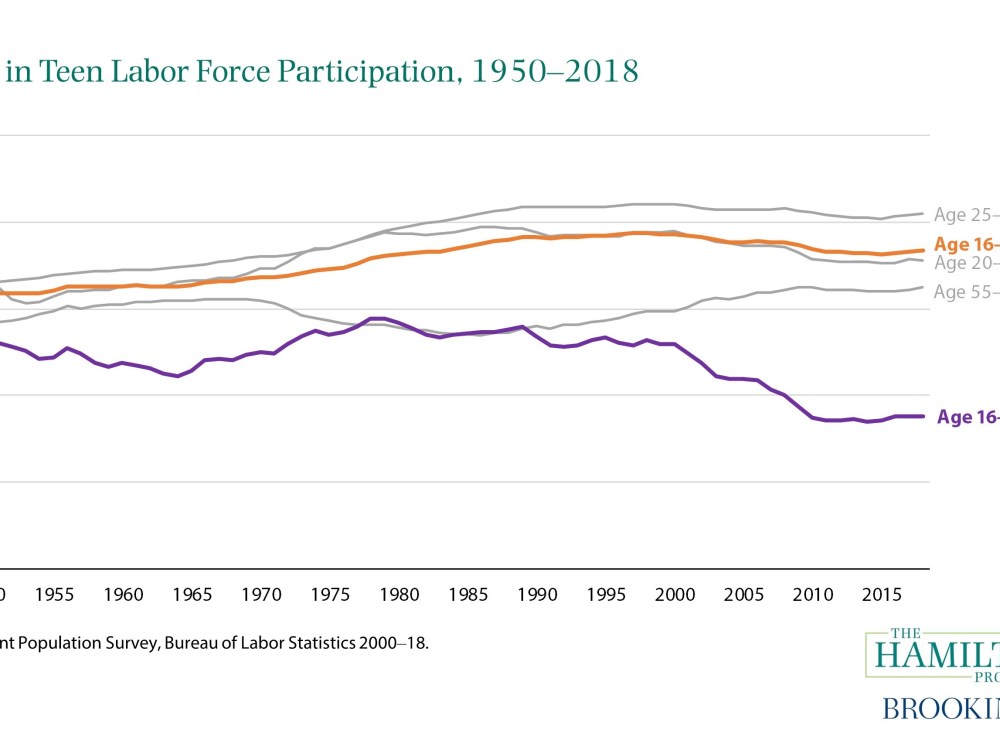
It is striking how the labor market behavior of teens deviates from that of other age groups. The teen labor force participation rate reached an all-time peak in 1979 (57.9 percent) and gradually declined until about 2000, when it then dropped precipitously to a 2010–18 plateau of about 35 percent (figure 1). While the participation rate of prime-age workers (25- to 54-year-olds) has edged down since its peak in the late 1990s and older workers’ (55- to 64-year-olds) participation has increased, the scale of the shift in teen participation dwarfs these other changes.
The annualized labor force participation rates shown in figure 1 obscure how different labor force participation is for teenagers during the summer and academic year. In this analysis, we use data from the Current Population Survey to separate academic year and summer teen labor force participation trends. Within the academic year and summer, we show how labor force participation and school enrollment have changed over time (figures 2a and 2b).
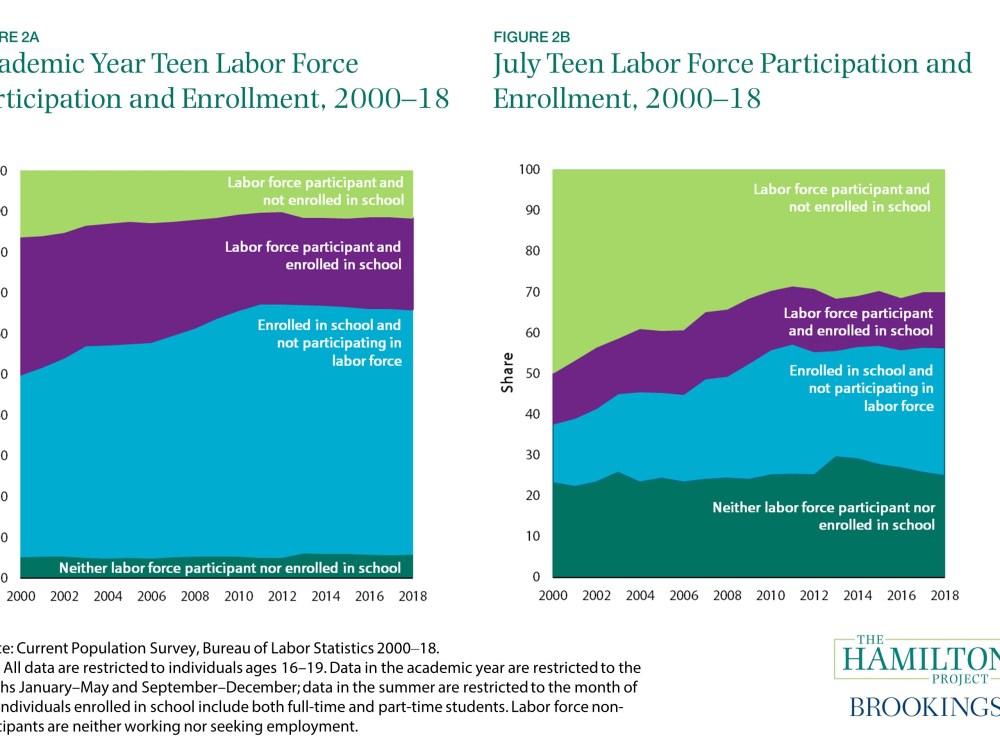
Most teenagers are compelled to be in school during the academic year, but may or may not work at the same time. Figure 2a depicts the decline in teenagers’ academic year (September to May) labor force participation. From 2000 to 2018, the share of teenagers working or seeking work while enrolled in school declined by 11.4 percentage points and the share of teenagers who are only working or seeking work decreased by 4.6 percentage points from 2000 to 2018, amounting to a total decline in teen labor force participation of 15.9 percentage points.
Whether this reduction in labor force participation during the academic year is a matter of concern depends on what teenagers are doing instead of working. If, for example, the share of teenagers who are neither participating in the labor force nor enrolled in school were increasing, then these trends could imply a rise in high school dropout rates and/or a decrease in postsecondary enrollment. However, figure 2a shows a large increase in the share of teenagers who are only enrolled in school (15.3 percentage points) and a very small increase in the share of teenagers who are neither participating in the labor force nor in school (0.7 percentage points). The reduction in labor force participation is largely attributable to a declining share of teenagers who are simultaneously enrolled and participating in the labor market during the academic year.
The decline in teen labor force participation during the summer is even more dramatic. In contrast to the academic-year decline in labor force participation while enrolled, the sizable shift we observe during the summer is a straightforward replacement of labor force participation with school enrollment. Consider the following statistics illustrated in figure 2b:
- The proportion of teenagers who are only working or seeking work decreased by 19.9 percentage points during this period;
- The share of teenagers who are not participating in the labor force but who are enrolled in school in July increased by 16.7 percentage points;
- The share of teenagers both participating in the labor force and enrolled in school has stayed flat over time, increasing by only 1.3 percentage points from 2000 to 2018;
- The share of teenagers neither participating in the labor force nor enrolled in school in July has also remained relatively stable over time at about one-in-five, increasing by 1.9 percentage points.
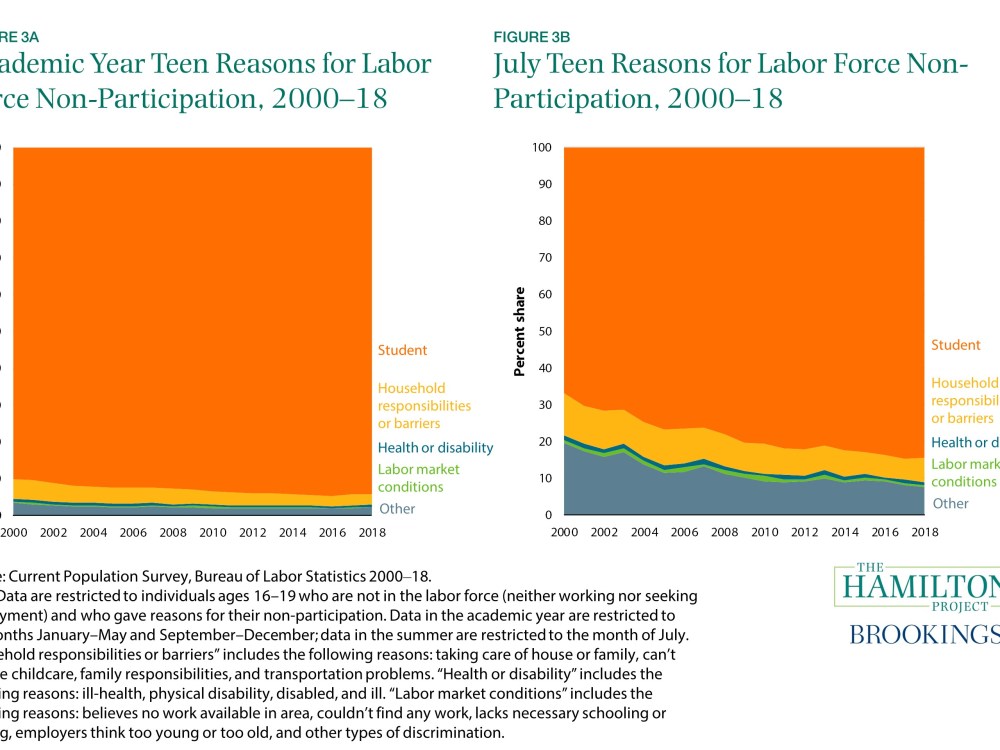
These shifts in labor force participation are borne out in the reasons given for not working or seeking work. From 2000 to 2018, there was a 3.9 percentage point increase during the academic year and a 17.8 percentage point increase during the summer in nonparticipants saying that they were not participating in the labor force because they were students (figures 3a and 3b). We also found it noteworthy that the number of teenagers reporting household responsibilities or “other reasons” has declined while summer school enrollment has increased.
Similarly to Julia Dennett and Alicia Sasser Modestino and Ernie Tedeschi, we find that while teens are less likely to be in labor force they are not substantially more likely to be entirely disconnected (not in employment, education, or training). Teresa Morisi provides some evidence that the intensity of high school may have increased in ways that have helped crowd out non-school activities.
The shift in teenage participation that we document is large, and indeed large enough to depress the aggregate labor force participation rate.
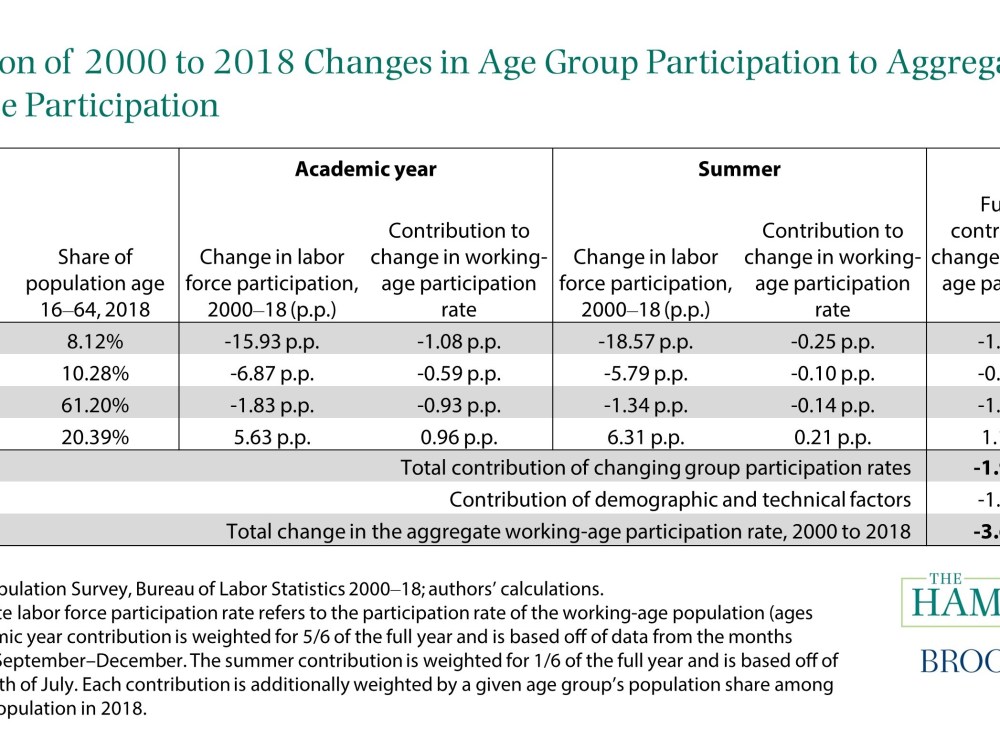
Table 1 shows contributions by age group to changes in the overall labor force participation rate. We calculate how much the change in participation for a given group moved overall participation based on their share of the population in 2018.
For teenagers, we find that the reductions in teen labor force participation have contributed a total of 1.33 percentage points to a lower working-age labor force participation rate from 2000 to 2018. In other words, if teenagers had continued to participate in the labor force at their 2000 labor force participation rate, the aggregate labor force participation rate for the working-age population would be 1.33 percentage points higher in 2018. This represents 37 percent of the aggregate 3.6 percentage point decline in labor force participation among the working-age population from 2000 to 2018. More than 80 percent of teens’ contribution (1.08 percentage points) comes from the academic year decline while 0.25 percentage points is from the decline in summer labor force participation.
Young workers (20- to 24-year-olds) have also contributed to the decline in aggregate participation, though not by as much. Prime-age workers have had increasing labor force participation in the last few years, but it is still 1.8 percentage points below 2000 levels, which translates in table 1 to a one percentage point contribution to the lower aggregate labor force participation among the working-age. These negative contributions are partially offset by increasing participation by older workers.
In addition to these within age group shifts in participation rates shown in the table, changes in the demographic composition of the labor force also contribute to the decline in aggregate labor force participation, most notably the rising share of Americans aged 55 to 64 who tend to work less than other working-age adults. (There are also technical factors such as microdata weights and the fact that we use July data to stand in for eight weeks of summer that contribute to the change over time in small amounts).
Declining labor force participation is often a cause for concern as it can contribute to declines in output per capita and may reflect barriers to work or a weak job market. The experience of teenagers is an important one, since changes in teen labor force participation are large enough to shift the aggregate working-age participation rate. At the same time, the reasons for declining teen labor force participation seem to reflect increasing time spent in school during the summer as well as a decline in labor force participation while in school during the academic year. In both cases, the increased attention to academics may in fact be a better outcome for society than increased youth employment. While there is evidence that the benefits to high school work experience have declined over time, more research is needed to determine whether there are long-term effects of the shift of teenagers towards school and away from work on labor force attachment and earnings.
Related Content

Authors


The Brookings Institution is committed to quality, independence, and impact.
We are supported by a diverse array of funders. In line with our values and policies, each Brookings publication represents the sole views of its author(s).

Commentary
All school and no work becoming the norm for American teens
July 2, 2019