With the 2010 Census under its belt, the Census Bureau last week released the first set of state population counts for 2011. The news wasn’t heartening. After a decade in which the United States registered its lowest population growth rate since the Great Depression, the 0.73 percent rise in U.S. population from 2010 to 2011 marked the lowest annual growth rate since 1945.
This demographic low point coincides with the smallest immigration level since 1991, a noticeable downturn in fertility, and a continuing decline in internal migration. The weak labor market seems to be giving potential immigrants pause, and putting a hold on childbearing decisions. At the same time, the aging Baby Boom generation, now past its prime childbearing years, is contributing to a long-run trend of declining natural population increase.
While some might welcome slowed population growth, it is nonetheless a worrisome trend for a few reasons. First, the ability of the United States to maintain high and rising standards of living will depend in part on keeping a large share of its population in the workforce. That in turn requires growth to replenish our younger, working-age ranks. Second, those younger workers are crucial for the nation’s ability to provide needed support for a growing older population. And third, population growth itself is a reflection of our society’s optimism about current and future opportunities.
Perhaps just as troubling as the national growth slowdown is its geographic pervasiveness. Already, we knew that a handful of Sunbelt states were suffering from migration whiplash. Florida, Arizona, and Nevada in particular benefited greatly from the mid-decade housing bubble. Their explosive population growth turned out to be short-lived as housing values began to plummet in late 2006, recession set in, and foreclosures skyrocketed.
The new figures show, however, that the growth slowdown has spread beyond the bubble-then-bust areas. Growth has slowed sharply in states that seemed relatively immune from mid-decade housing gyrations like Georgia, North Carolina, and Colorado, as employment opportunities in a variety of industries contracted and mortgage credit began to dry up. Idaho, Utah, and Tennessee are exhibiting similar trends.
Even Texas, the hands-down winner of the 2010 Census sweepstakes, is registering notably slower growth than in recent years. The Lone Star state did lead all other states (though not the District of Columbia) in growth last year, but its top-ranked growth rate of 1.6 percent in 2010-2011 pales in comparison to Nevada’s top-ranked rate of 3.7 percent in 2005-2006. Back then, 13 states grew at a rate exceeding Texas’ rate last year.
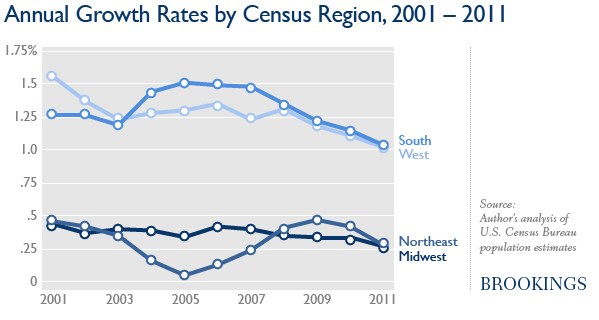
Population growth has even slowed considerably from earlier years of our economic doldrums. Thirty-six (36) states grew more slowly in 2010-2011 than in any of the previous three years. Of those, 21 are in South and West regions. Moreover, of the 24 states that gained in-migrants in the first year of the recession (2007-2008), 20 gained fewer last year, including Texas, North Carolina, and Colorado.
One noteworthy turnaround is the state of Florida, which registered unprecedented out-migration from 2007 to 2009. These first population estimates since then, which show a net in-migration to Florida of 108,000 from 2009 to 2011, coupled with an increased population growth rate, suggest that the state’s real estate-driven economic collapse may have bottomed out. At the same time, Arizona and Nevada show few signs of revival, with Nevada registering more net out-migration and slower population growth than in previous years.
A few states stand out for recent increases in population growth. North Dakota and Alaska, with strong energy-driven economies and low unemployment rates, ranked among the top seven states for population growth two years running. With widespread unemployment, people seem more willing to move to the few booming places on the map, irrespective of their unfamiliarity, distance, or climate.
The continued migration slowdown, coupled with economic woes that are spreading across broader parts of the country, are dampening population growth almost everywhere, including longstanding Sunbelt magnets. When the economy eventually does pick up, there will be a pent-up demand for moving both into and across the country. The latest numbers give frustratingly few clues as to where these new migrant draws will be.
| Rank | State | 2005-6 | 2006-7 | 2007-8 | 2008-9 | 2009-10 | 2010-11 |
|---|---|---|---|---|---|---|---|
| 1 | District of Columbia | 0.63 | 0.65 | 1.02 | 2.07 | 2.06 | 2.14 |
| 2 | Texas | 2.55 | 2.02 | 2.00 | 2.03 | 1.84 | 1.65 |
| 3 | Utah | 2.76 | 2.86 | 2.51 | 2.27 | 1.95 | 1.49 |
| 4 | North Dakota | 0.52 | 0.52 | 0.73 | 1.13 | 1.43 | 1.37 |
| 5 | Colorado | 1.91 | 1.77 | 1.79 | 1.69 | 1.55 | 1.36 |
| 6 | Washington | 1.81 | 1.43 | 1.56 | 1.60 | 1.16 | 1.28 |
| 7 | Alaska | 1.25 | 0.74 | 1.05 | 1.66 | 2.16 | 1.19 |
| 8 | Florida | 1.82 | 1.11 | 0.87 | 0.68 | 1.02 | 1.16 |
| 9 | Arizona | 3.26 | 2.30 | 1.83 | 1.00 | 1.11 | 1.08 |
| 10 | Georgia | 2.58 | 2.12 | 1.66 | 1.22 | 0.95 | 1.06 |
| 11 | North Carolina | 2.43 | 2.25 | 2.10 | 1.51 | 1.19 | 1.00 |
| 12 | California | 0.54 | 0.64 | 0.98 | 0.97 | 1.05 | 0.94 |
| 13 | South Dakota | 0.97 | 1.10 | 0.95 | 0.99 | 1.16 | 0.91 |
| 14 | South Carolina | 2.05 | 1.98 | 1.91 | 1.34 | 1.01 | 0.90 |
| 15 | Virginia | 1.28 | 1.01 | 1.06 | 1.18 | 1.25 | 0.90 |
| 16 | Idaho | 2.83 | 2.48 | 1.94 | 1.31 | 1.09 | 0.88 |
| 17 | Oregon | 1.60 | 1.40 | 1.24 | 1.06 | 0.80 | 0.87 |
| 18 | Hawaii | 1.32 | 0.45 | 1.26 | 1.09 | 1.26 | 0.84 |
| 19 | Oklahoma | 1.28 | 1.12 | 0.95 | 1.32 | 1.19 | 0.83 |
| 20 | Delaware | 1.67 | 1.45 | 1.39 | 0.89 | 0.90 | 0.81 |
| 21 | New Mexico | 1.55 | 1.42 | 1.03 | 1.30 | 1.43 | 0.79 |
| 22 | Maryland | 0.63 | 0.46 | 0.56 | 0.80 | 0.97 | 0.73 |
| 23 | Montana | 1.34 | 1.26 | 1.21 | 0.77 | 0.70 | 0.73 |
| 24 | Tennessee | 1.63 | 1.43 | 1.16 | 0.94 | 0.81 | 0.72 |
| 25 | Nevada | 3.72 | 3.11 | 2.02 | 1.17 | 0.74 | 0.70 |
| 26 | Nebraska | 0.64 | 0.61 | 0.73 | 0.91 | 0.98 | 0.68 |
| 27 | Louisiana | -5.99 | 1.69 | 1.37 | 1.26 | 1.17 | 0.65 |
| 28 | Minnesota | 0.86 | 0.85 | 0.76 | 0.65 | 0.56 | 0.64 |
| 29 | Wyoming | 1.66 | 2.34 | 2.09 | 2.53 | 0.82 | 0.64 |
| 30 | Arkansas | 1.46 | 0.95 | 0.91 | 0.78 | 0.85 | 0.56 |
| 31 | Kentucky | 0.87 | 0.89 | 0.78 | 0.63 | 0.68 | 0.51 |
| 32 | Massachusetts | 0.11 | 0.34 | 0.58 | 0.75 | 0.61 | 0.49 |
| 33 | Kansas | 0.64 | 0.75 | 0.87 | 0.88 | 0.93 | 0.42 |
| 34 | Indiana | 0.86 | 0.74 | 0.71 | 0.54 | 0.48 | 0.40 |
| 35 | Iowa | 0.61 | 0.56 | 0.58 | 0.53 | 0.56 | 0.40 |
| 36 | Alabama | 1.29 | 0.95 | 0.97 | 0.84 | 0.58 | 0.36 |
| 37 | New York | -0.15 | 0.15 | 0.42 | 0.49 | 0.44 | 0.36 |
| 38 | Wisconsin | 0.57 | 0.59 | 0.54 | 0.50 | 0.38 | 0.35 |
| 39 | Mississippi | -0.03 | 0.80 | 0.66 | 0.37 | 0.38 | 0.28 |
| 40 | Missouri | 0.91 | 0.77 | 0.62 | 0.63 | 0.59 | 0.25 |
| 41 | New Jersey | 0.11 | 0.19 | 0.38 | 0.51 | 0.53 | 0.24 |
| 42 | Illinois | 0.27 | 0.41 | 0.40 | 0.39 | 0.36 | 0.21 |
| 43 | Pennsylvania | 0.49 | 0.42 | 0.38 | 0.43 | 0.34 | 0.20 |
| 44 | Connecticut | 0.30 | 0.28 | 0.52 | 0.46 | 0.43 | 0.15 |
| 45 | New Hampshire | 0.76 | 0.32 | 0.26 | 0.01 | 0.05 | 0.11 |
| 46 | Vermont | 0.27 | 0.09 | 0.11 | 0.11 | 0.18 | 0.08 |
| 47 | Maine | 0.37 | 0.26 | 0.26 | -0.07 | -0.15 | 0.06 |
| 48 | Ohio | 0.16 | 0.17 | 0.13 | 0.12 | 0.06 | 0.06 |
| 49 | West Virginia | 0.41 | 0.34 | 0.34 | 0.41 | 0.34 | 0.05 |
| 50 | Michigan | -0.15 | -0.35 | -0.54 | -0.46 | -0.24 | -0.01 |
| 51 | Rhode Island | -0.45 | -0.54 | -0.22 | -0.13 | -0.07 | -0.12 |
| United States | 0.97 | 0.96 | 0.95 | 0.88 | 0.83 | 0.73 |
The Brookings Institution is committed to quality, independence, and impact.
We are supported by a diverse array of funders. In line with our values and policies, each Brookings publication represents the sole views of its author(s).


Commentary
2011 Puts the Brakes on U.S. Population Growth
December 28, 2011