There has been a lot of talk recently about regional divergence in the American economy and what to do for places left behind, especially in the industrial Heartland. Judging by one important economic indicator, however, economic outcomes around the country are actually more similar than they were in the past.
In May 2017, the U.S. unemployment rate dipped to 4.3 percent. That rate varied considerably across the nation’s 388 metropolitan areas, from a low of 1.7 percent in Ames, Iowa to a high of 19.2 percent in El Centro, Calif. (those figures are for April 2017, the latest data available).
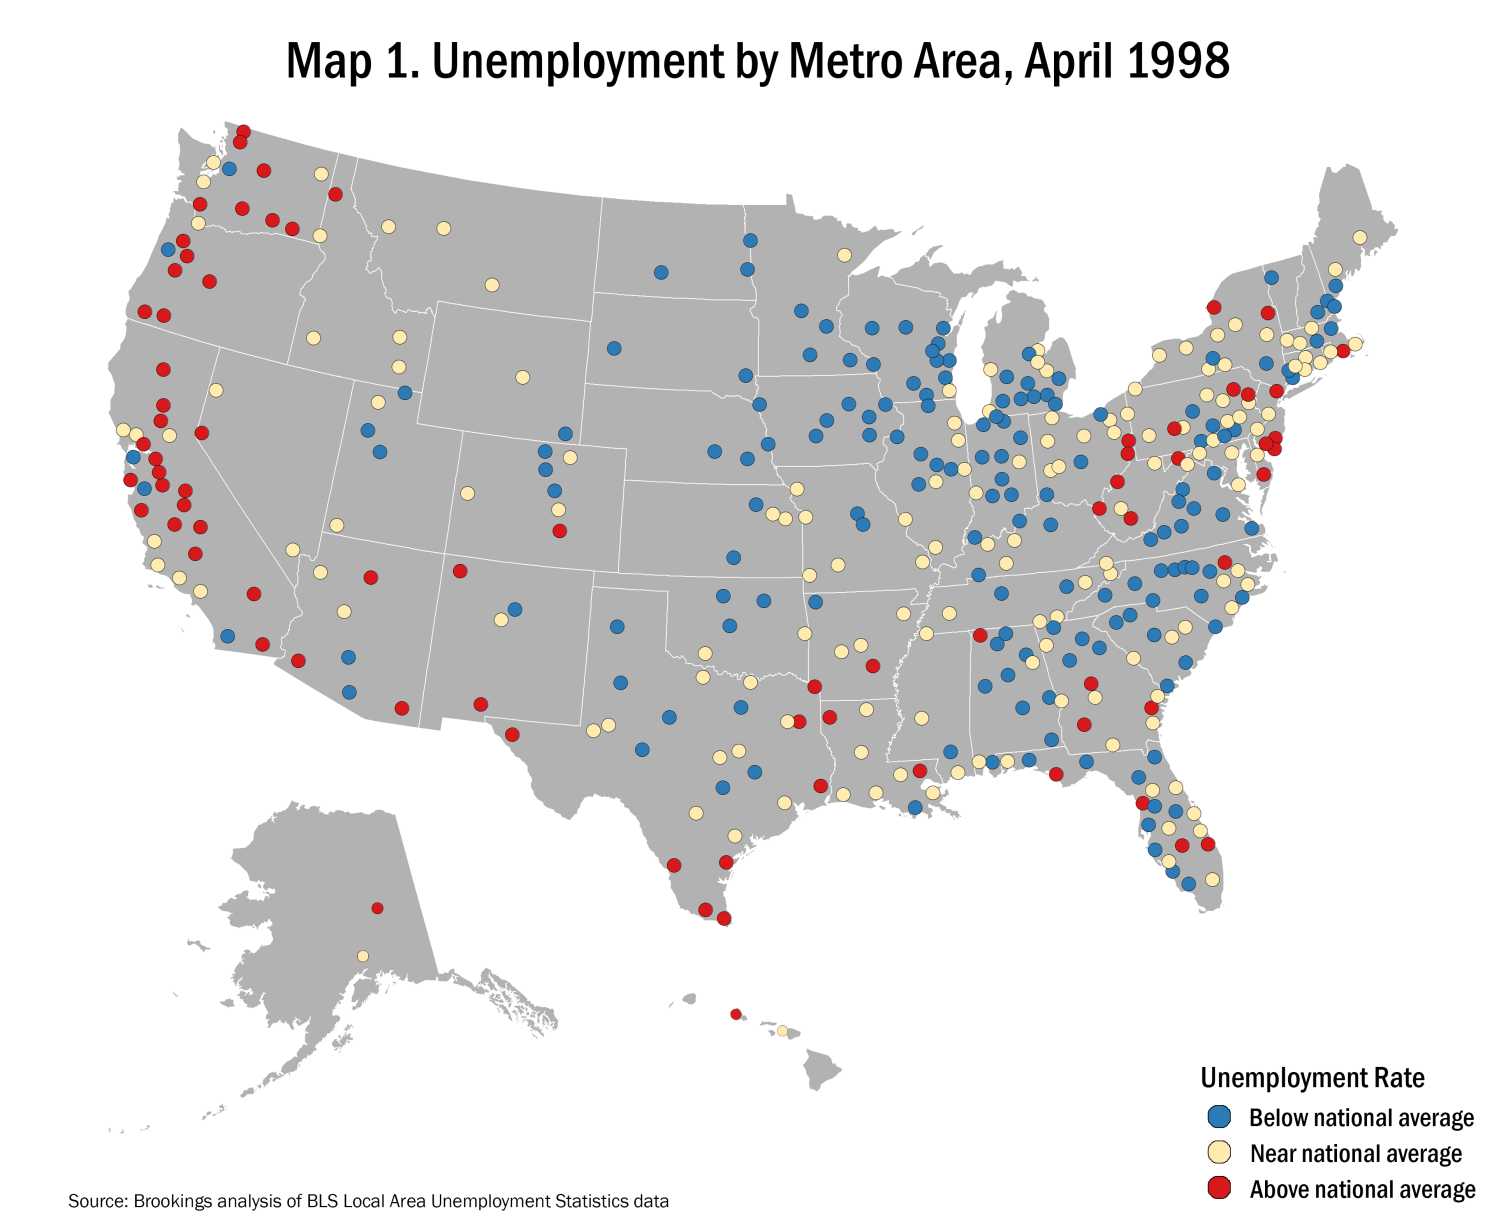
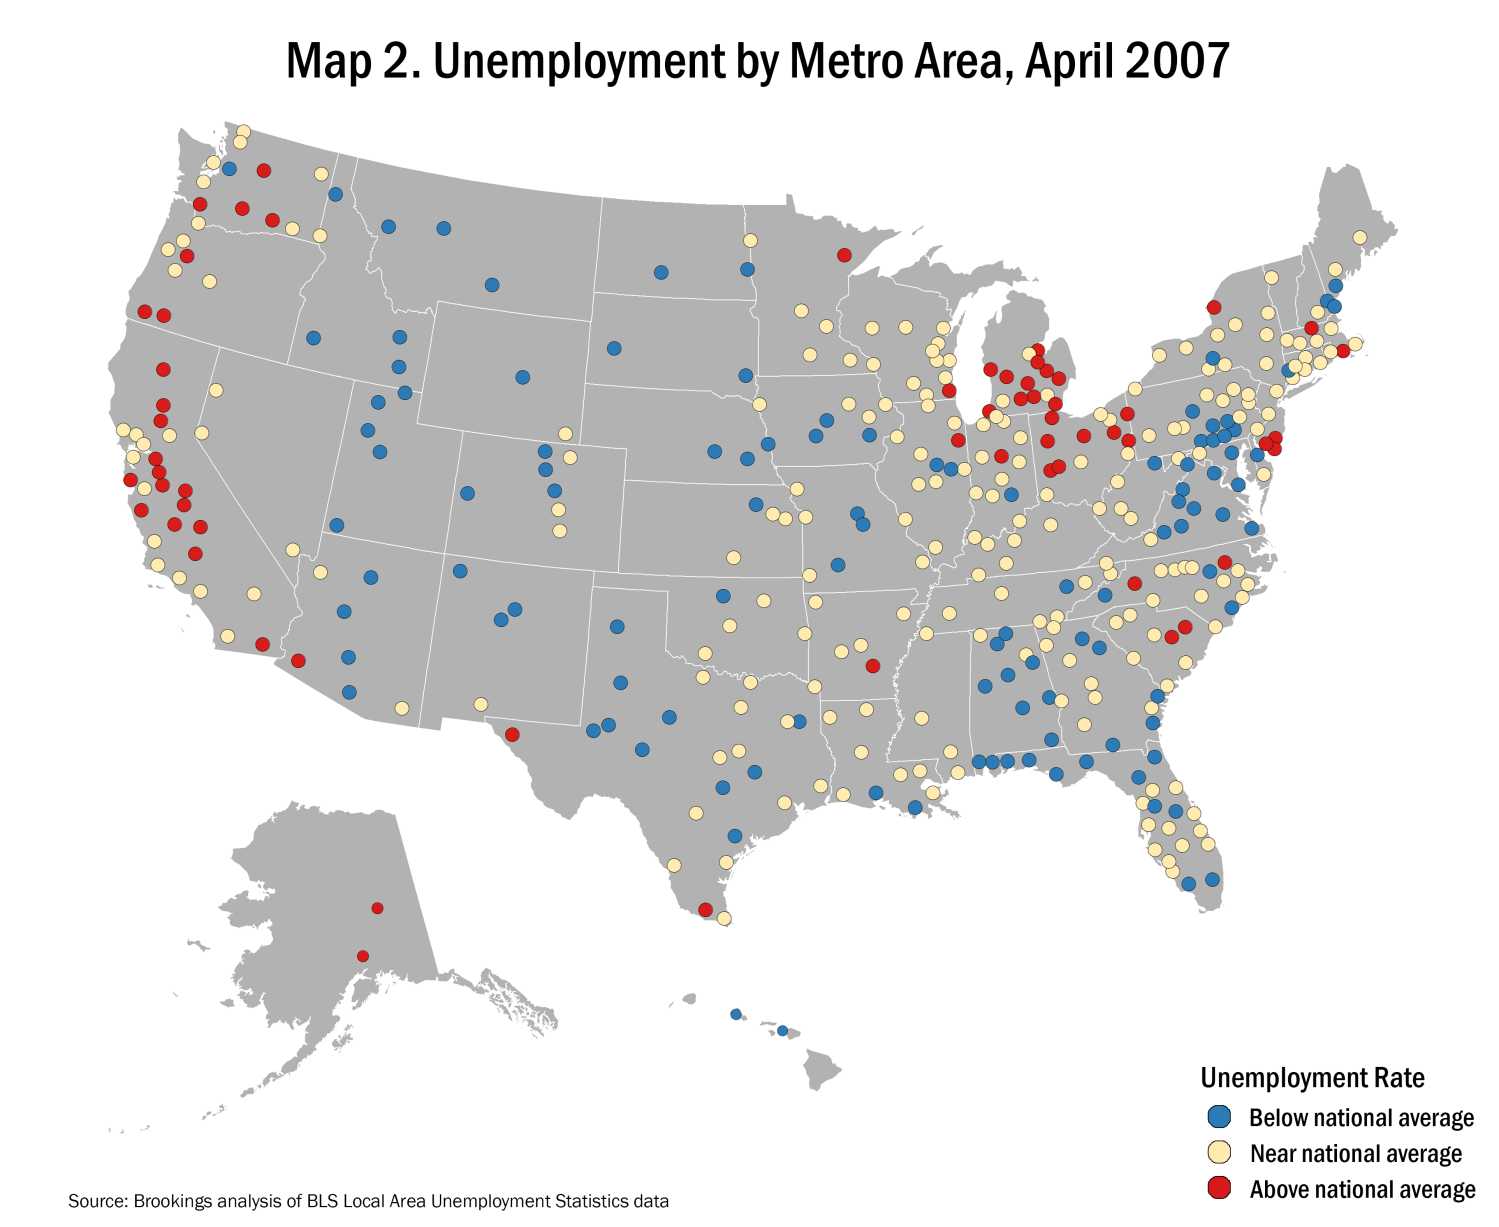
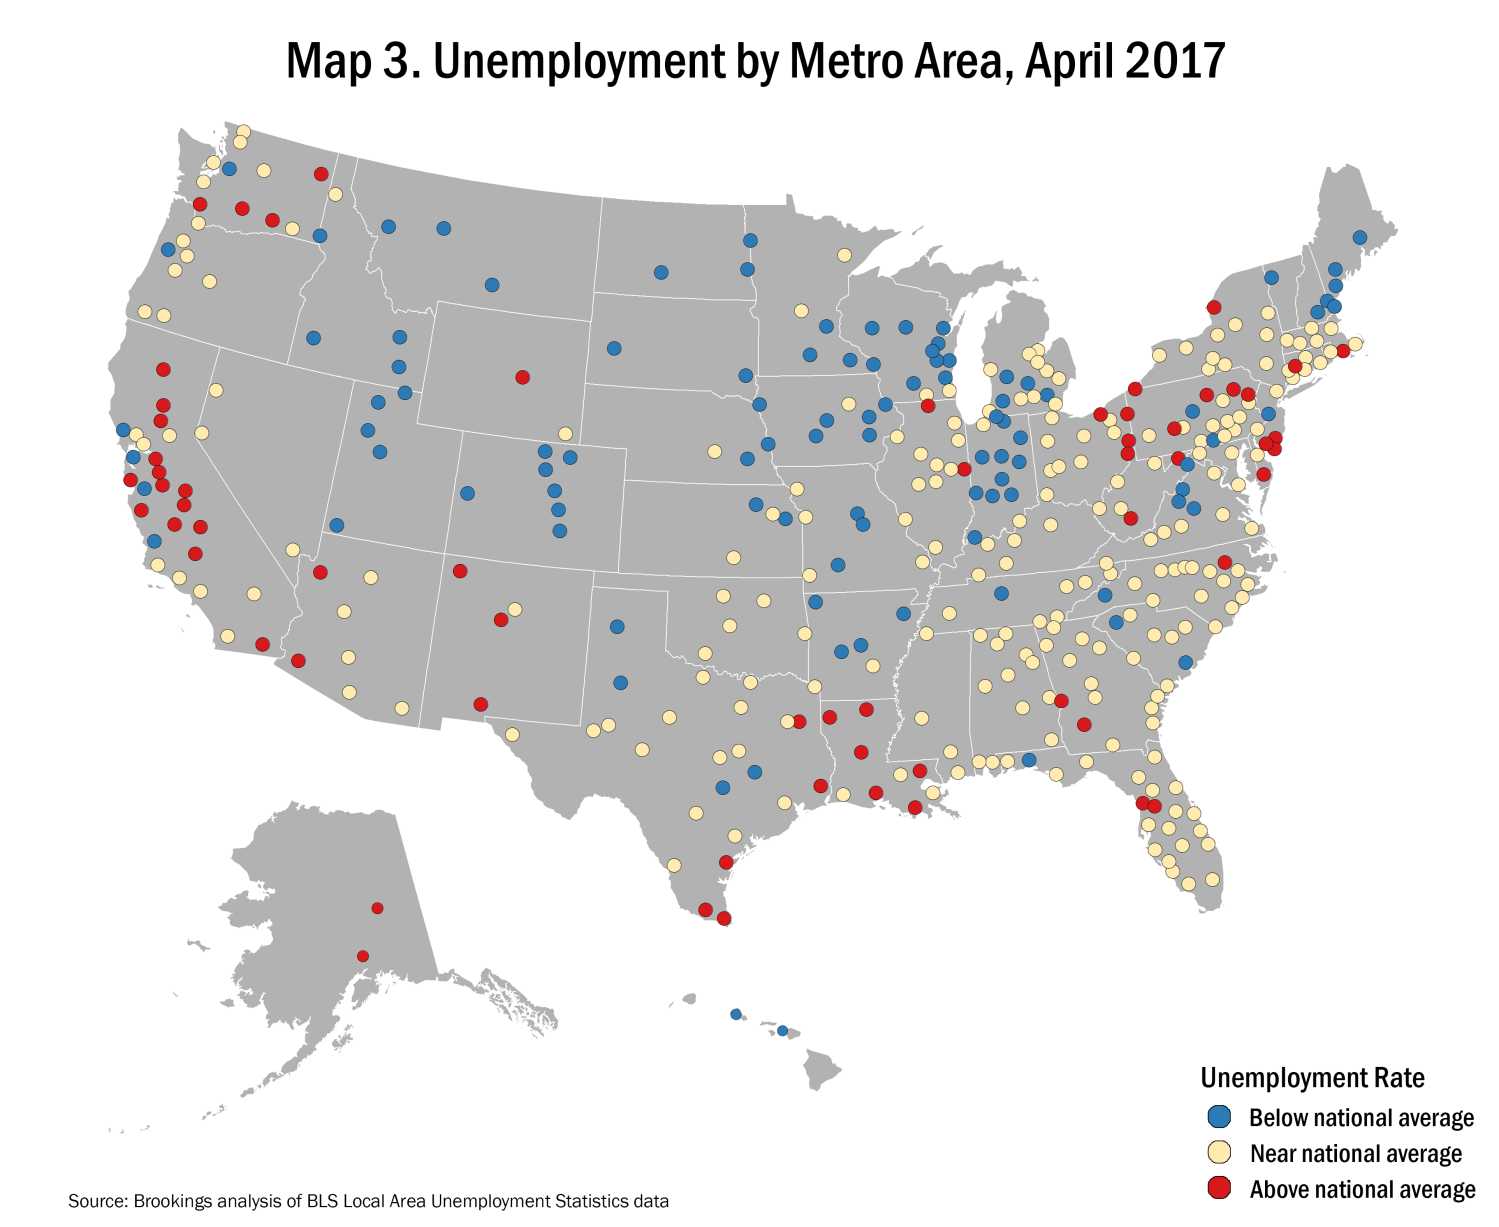
The last two times the national unemployment rate was that low were in the late 1990s, and just before the Great Recession in 2007. Compared to those two business cycles, metro areas today are actually more similar in their unemployment rates (see maps 1-3).
- In April 2017, when the U.S. unemployment rate was 4.4 percent, 226 of 388 metro areas had unemployment rates within one percentage point of that benchmark. 100 metro areas had rates below 3.4 percent, and 62 had rates exceeding 5.4 percent.
- In April 2007, when the U.S. unemployment rate was 4.5 percent, slightly fewer (217) metro areas had rates around the national average.
- But in April 1998, when the U.S. unemployment rate was 4.3 percent, only 153 metro areas had rates within one percentage point of that figure. Many more (159) had rates well below the national average, and several more (76) had rates well above the national average.
The maps point to different sources of this long-run convergence. Many places in the western and southwestern United States transitioned during this time from smaller, resource-based, high-unemployment economies to larger, industrialized, moderate-unemployment economies. Metro areas in the Northwest, inland California, and the southwestern border in Texas and Arizona that once battled sustained levels of high unemployment fit that profile. At the same time, many college towns that boasted very low unemployment in the late 1990s (think Raleigh-Durham, N.C., Lexington, Ky., Champaign-Urbana, Ill., and Ithaca, N.Y.) also matured in ways that made them more “average” economically. Unemployment is also somewhat higher today in manufacturing-focused metro areas that boomed in the 1990s, but lost much of that industry in the 2000s, places like Detroit, Mich., Peoria, Ill., and Dothan, Ala.
Although the distribution of unemployment rates across metro areas today is roughly similar to what it was 10 years ago, the geographic patterns of unemployment have shifted (see map 4).
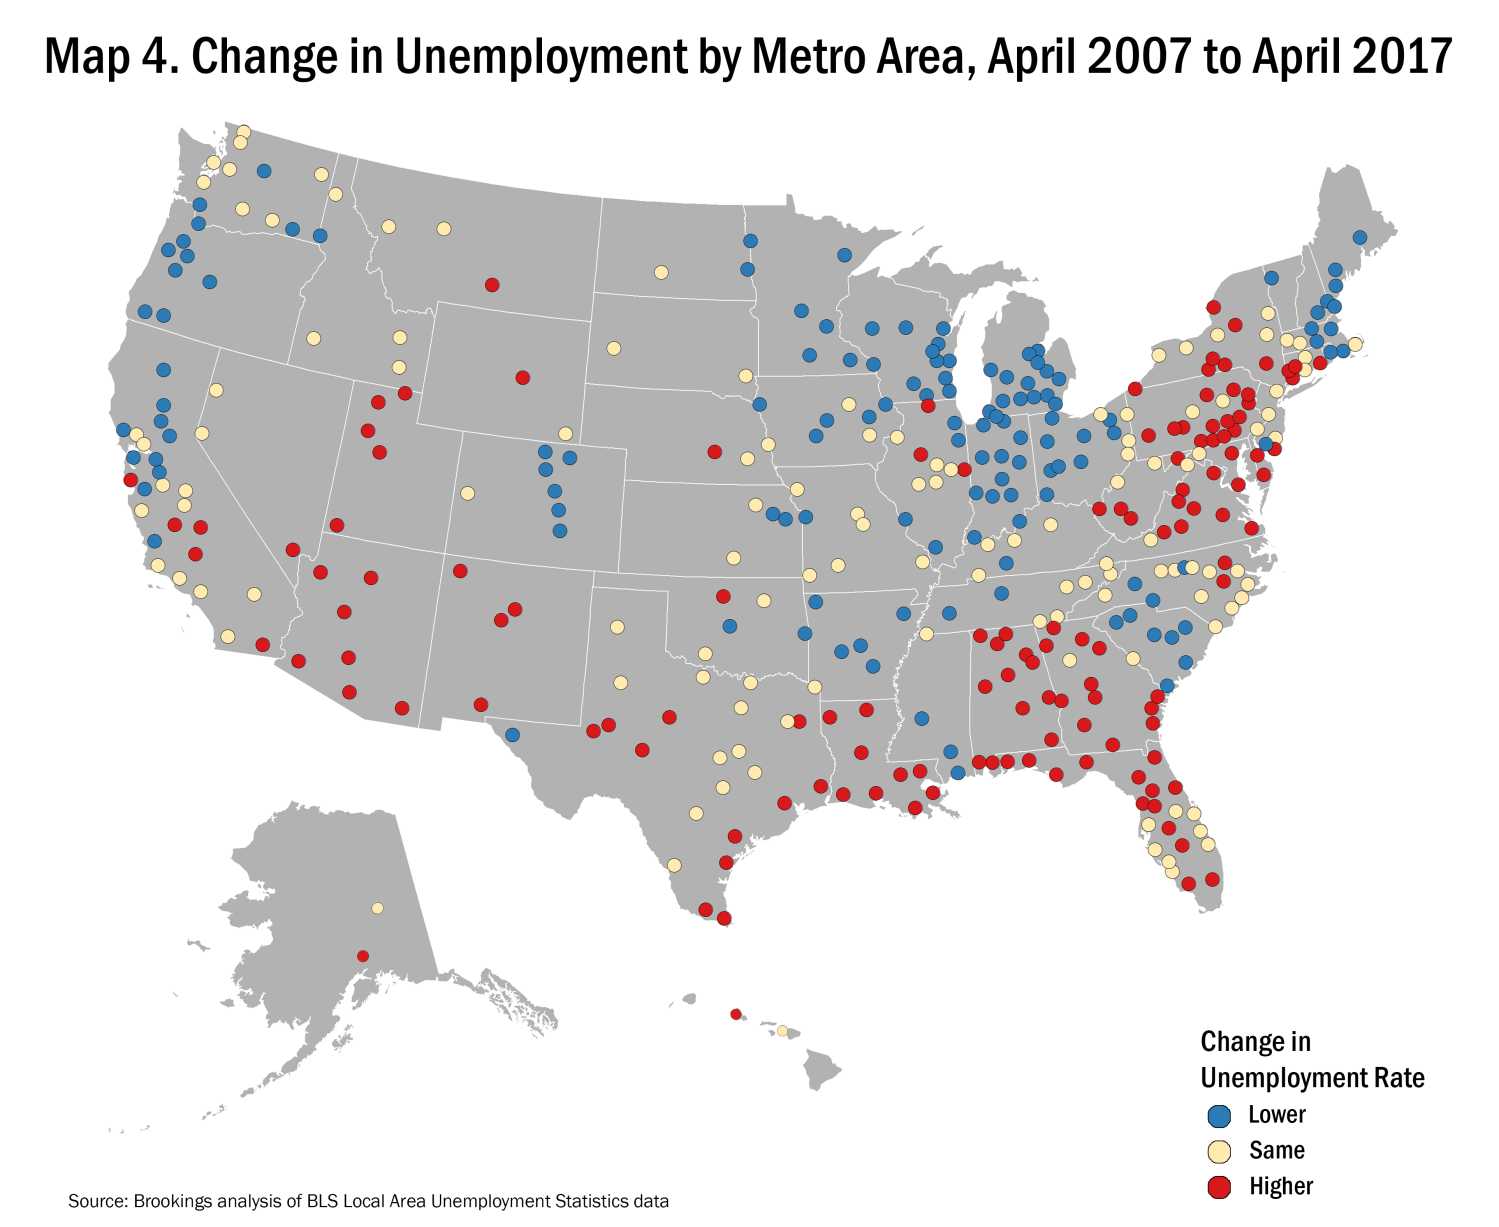
Most strikingly, metro areas across the industrial Midwest—in Ohio, Indiana, Michigan, and Wisconsin—have unemployment rates today at least one percentage point lower than in April 2007. In the Milwaukee metro area, the unemployment rate stands at 3.2 percent today, versus 5.3 percent in April 2007. In the Battle Creek, Mich. metro area, it is 3.6 percent, down from 6.8 percent a decade ago. And in the Fort Wayne, Ind., metro area, the unemployment rate has fallen to 2.5 percent, well below its 4.5 percent level in April 2007.
Other areas of the country, including northern California, Oregon, Colorado, Minnesota, Arkansas, and South Carolina also boast lower unemployment rates today than at a similar point in the last business cycle. By contrast, in much of the Northeast, mid-Atlantic, Southeast, and Interior West, larger shares of adults are looking for work than a decade ago. Notably, unemployment rates are elevated in many Pennsylvania metro areas relative to their Midwestern brethren.
To be sure, the unemployment rate is an imperfect indicator that fails to capture other concerning trends, such as people dropping out of the labor force altogether, or long-run stagnation in wages. These sorts of phenomena can be tracked locally (see here and here for examples), but typically with a much greater time lag and less precision.
Yet these metropolitan unemployment patterns—of increasing regional convergence over the last two decades, and improved conditions in the industrial Midwest over the last decade—don’t square neatly with the political narratives of places being left behind, especially in the Rust Belt. Since most Americans—83 percent of us—live in one of these metro areas, these trends suggest the value of looking more carefully at the hidden strengths and growing similarities of our local labor markets.
Related Content


Authors


The Brookings Institution is committed to quality, independence, and impact.
We are supported by a diverse array of funders. In line with our values and policies, each Brookings publication represents the sole views of its author(s).


Commentary
Metro area unemployment trends buck the national narrative: A story of convergence, not divergence
June 8, 2017