Last week, with John Irons from the Rockefeller Foundation, we introduced a new framework for understanding whether an economy is inclusive—that is, whether it expands opportunities for broadly shared prosperity—and described an initial effort to test that framework with data for U.S. metropolitan areas. Using over 100 indicators, we visualized how the 100 largest metropolitan areas stacked up on five characteristics of inclusive economies the Foundation has identified: equity, participation, growth, sustainability, and stability.
Some metro areas did much better than others on achieving inclusive economic outcomes. Yet every metro area could improve its performance. Identifying which metro areas are similar to one another on these outcomes could help policy makers understand not only why places perform like they do, but also how to develop common strategies for enhancing local prosperity.
So we did what we often do at Brookings Metro: We made a map.
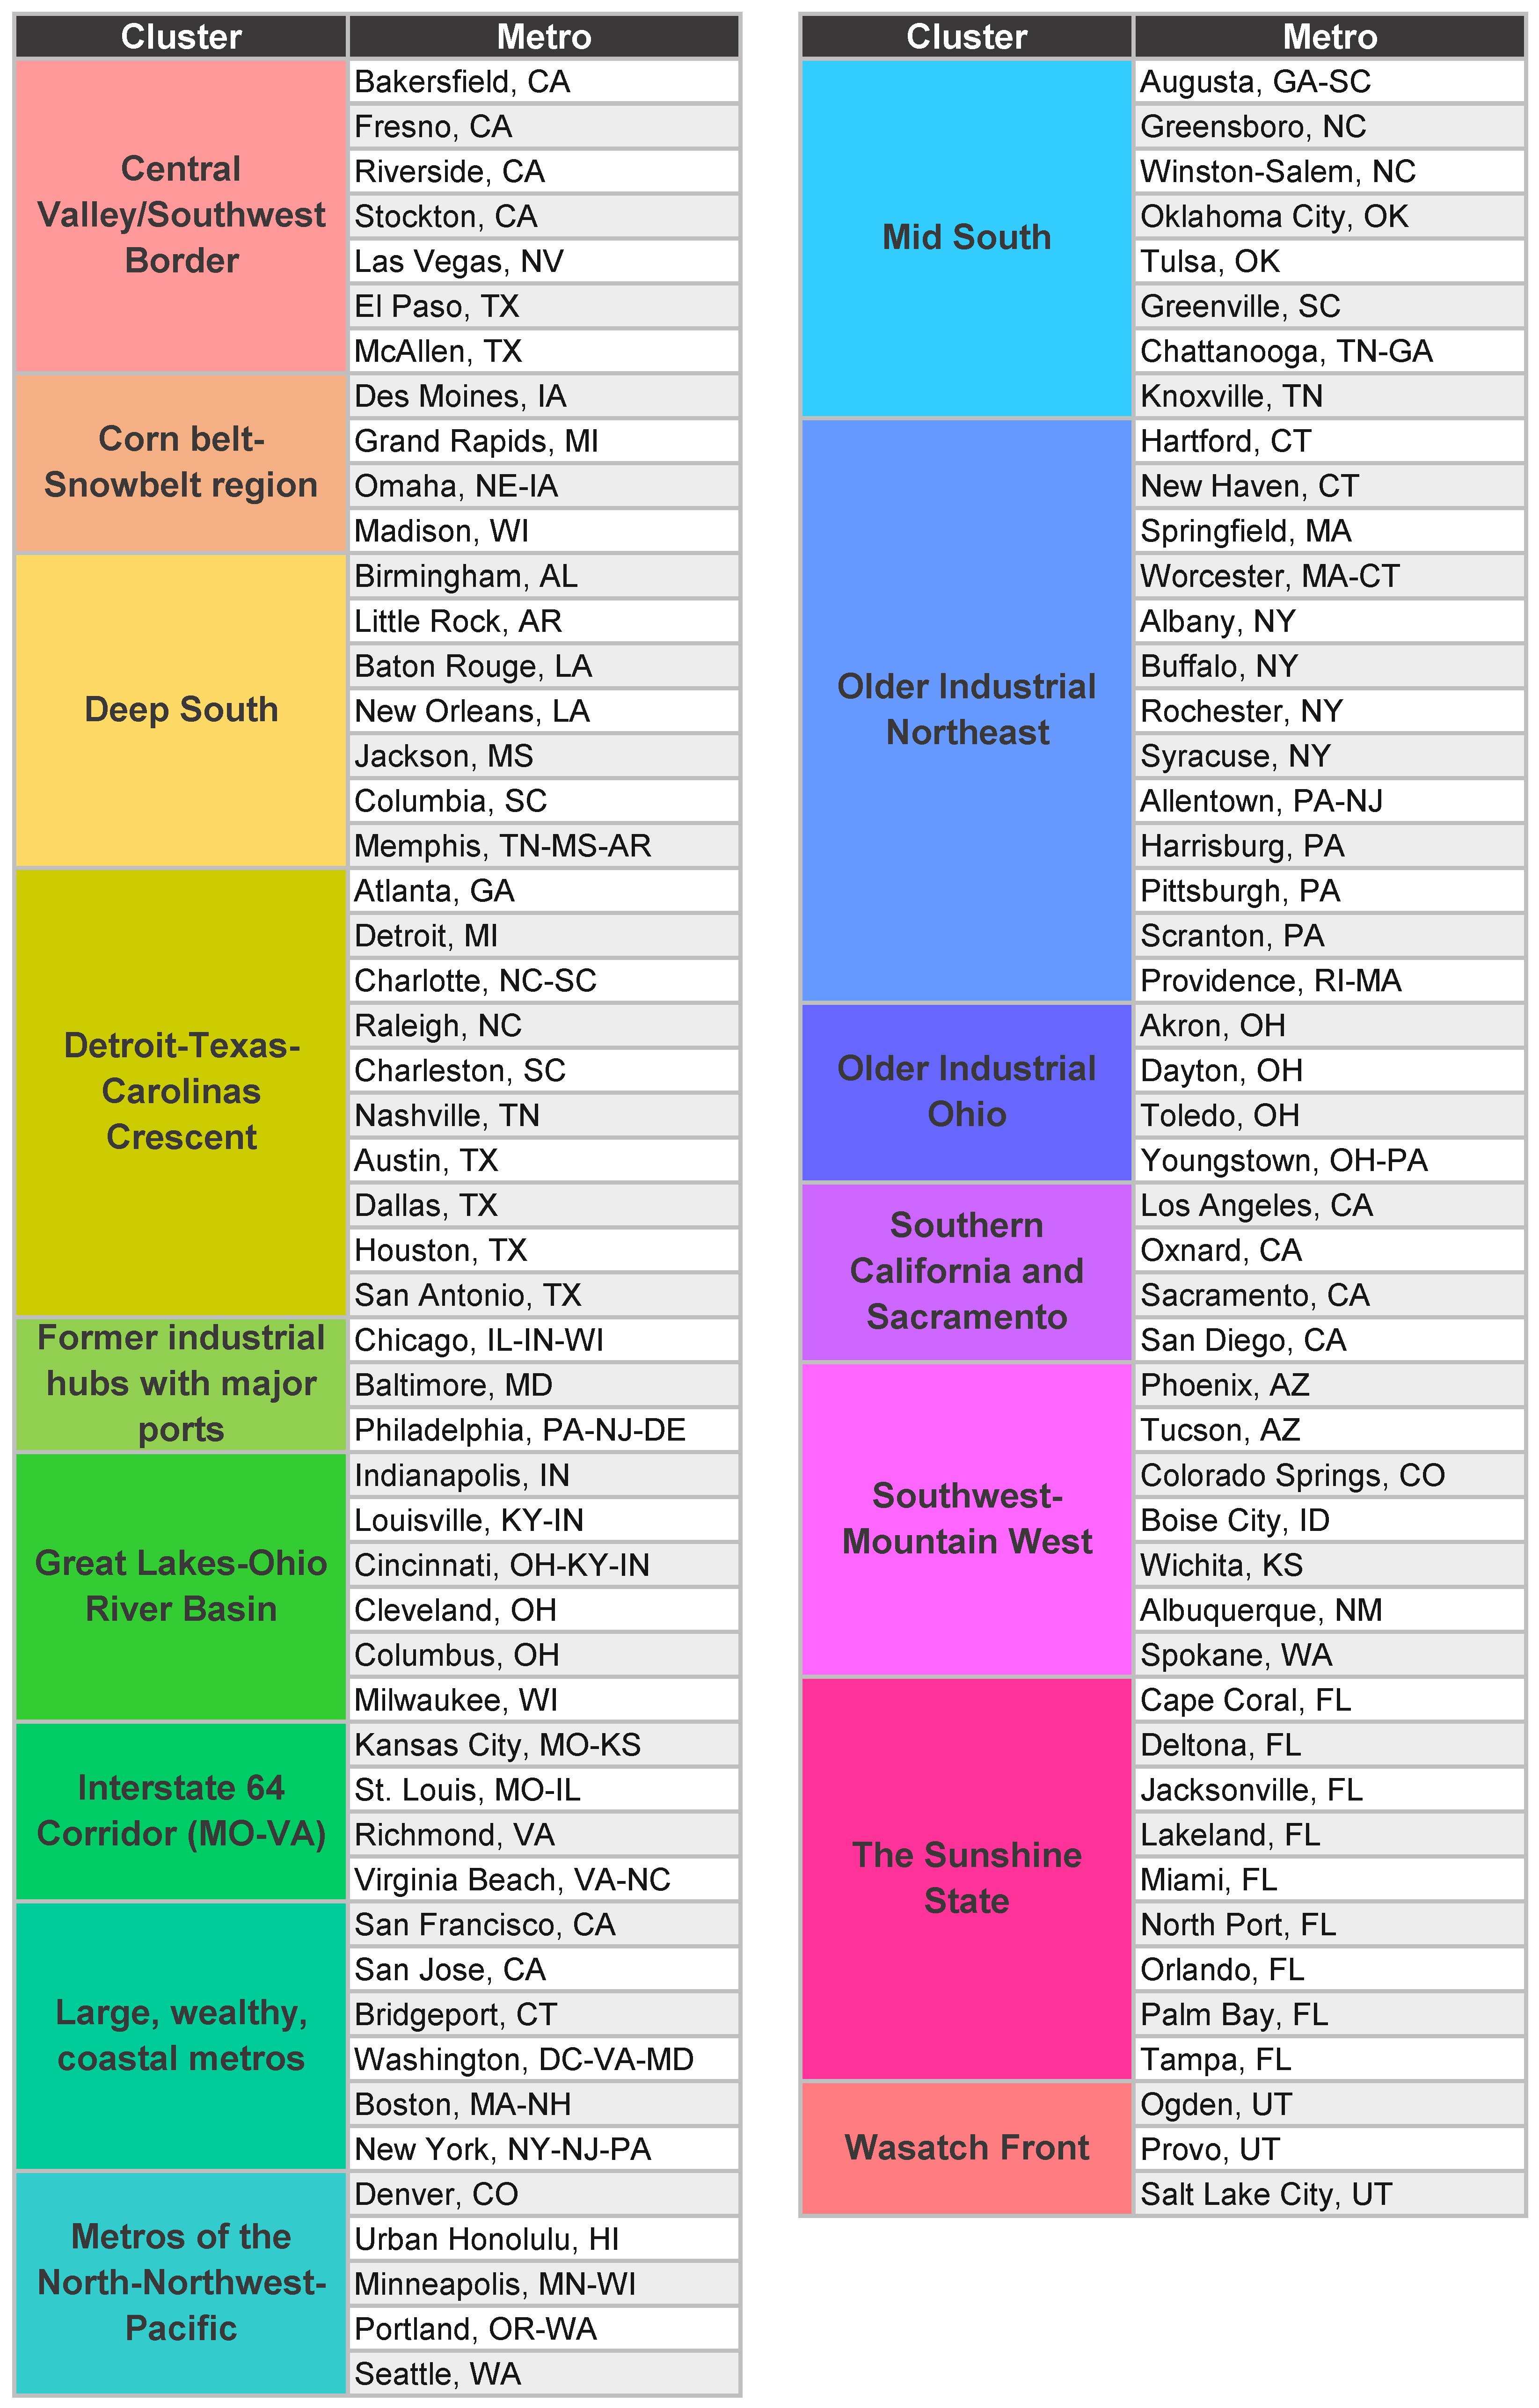
More specifically, we used advanced statistical techniques to generate “clusters” of metro areas based on their inclusive economy characteristics, as well as their size and wealth. Ultimately, the approach classified the 100 metro areas into 16 distinct clusters, shown on the map and listed below.
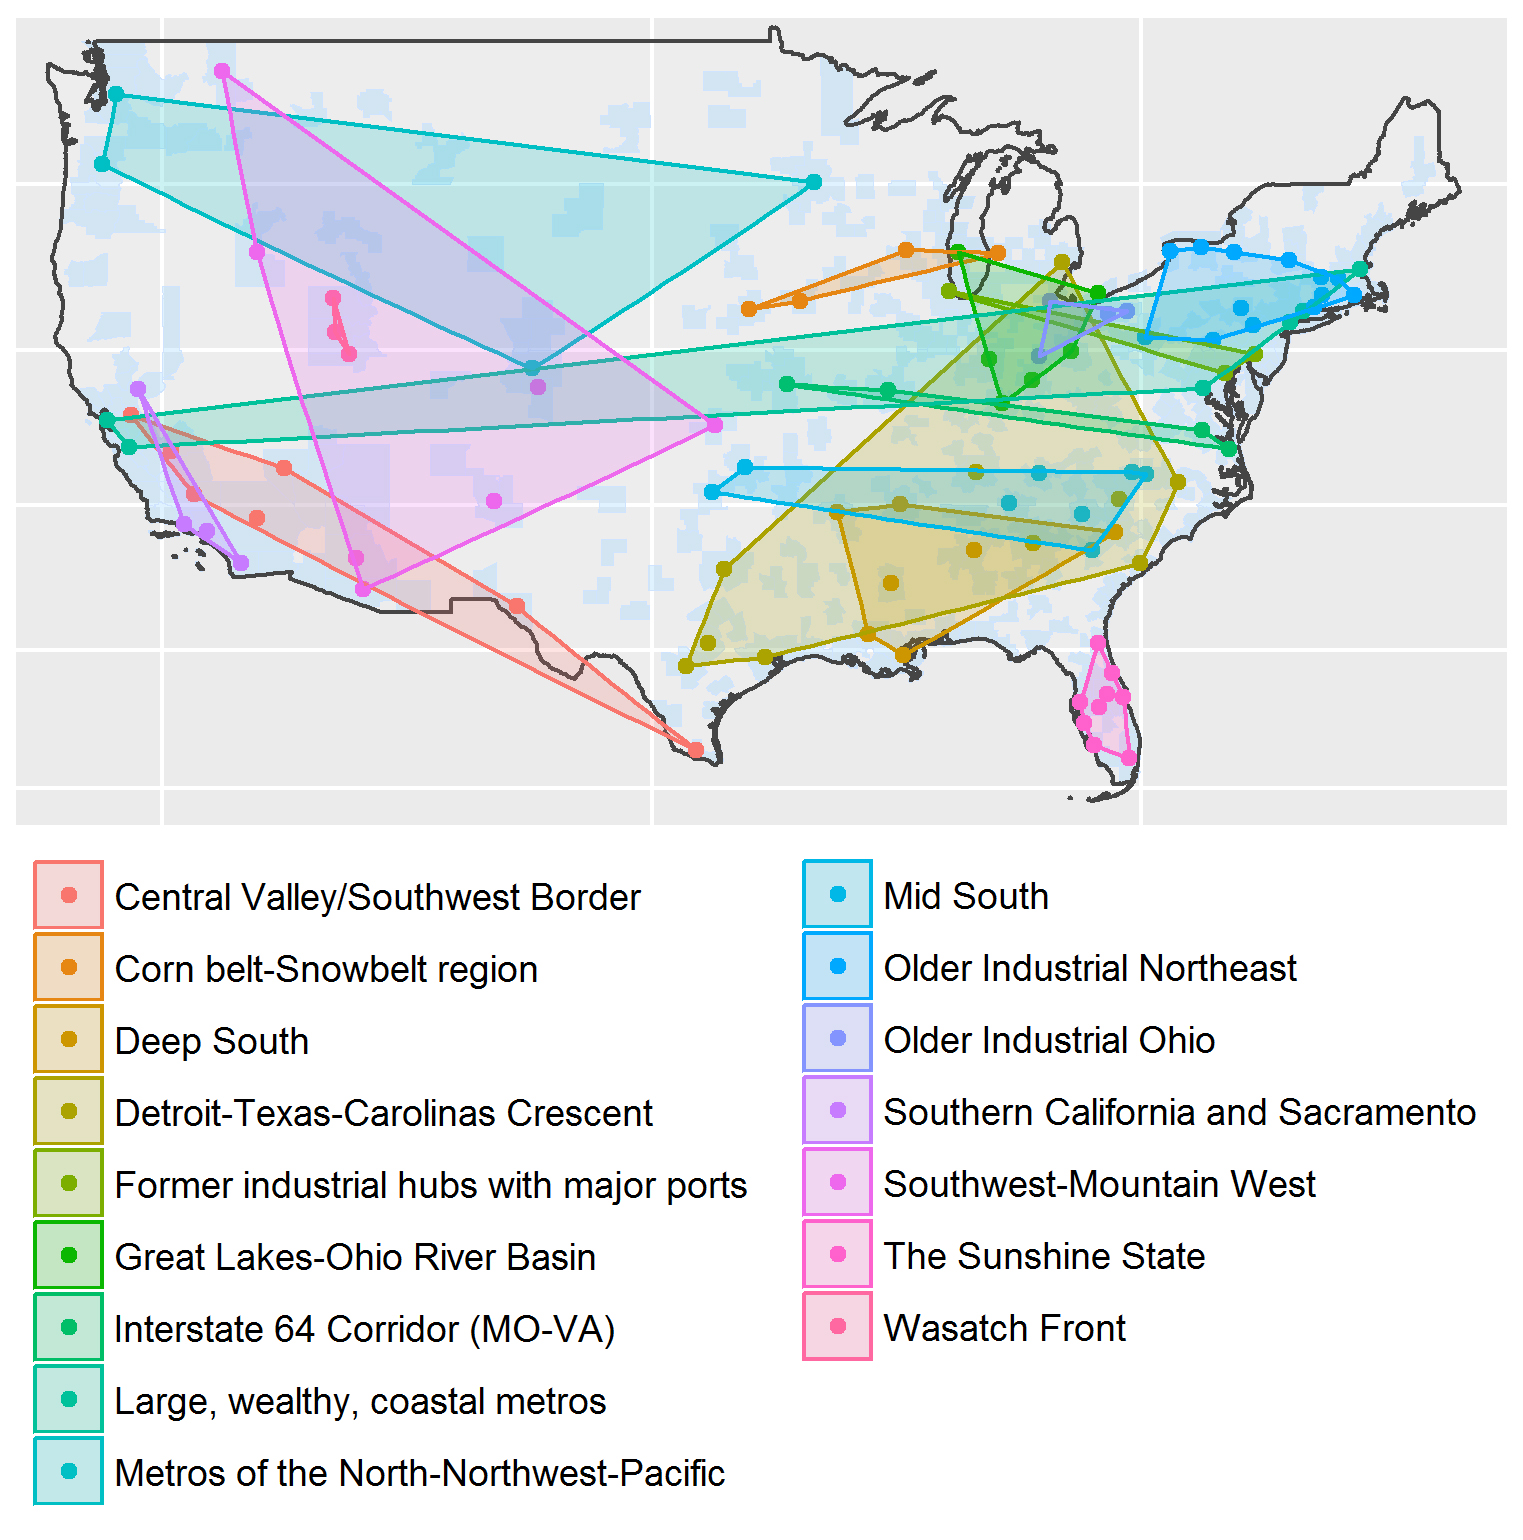
Even though the technique included no details on the metro areas’ location, many of the clusters are geographically specific. This reflects the fact that places with similar demographic, cultural, and economic features tend to be located near one another, and those features in turn influence places’ inclusive economy characteristics. Distinct regional groupings appear in the Southeast and Florida; older industrial areas of the Northeast; the Great Lakes and Ohio River Basin; and inland California and the Southwest.
However, factors other than geography play important roles in some clusters. For instance, Boston, New York, the San Francisco Bay Area, and Washington, D.C. are more linked by status as major global cities than shared location. Historical migration patterns and common industrial lineage help unite metro areas such as Denver, Minneapolis, Portland, and Seattle. Infrastructure may matter, too; Baltimore, Chicago, and Philadelphia are important historical port cities, while Kansas City, Richmond, and St. Louis lie along one of the nation’s most important transportation backbones.
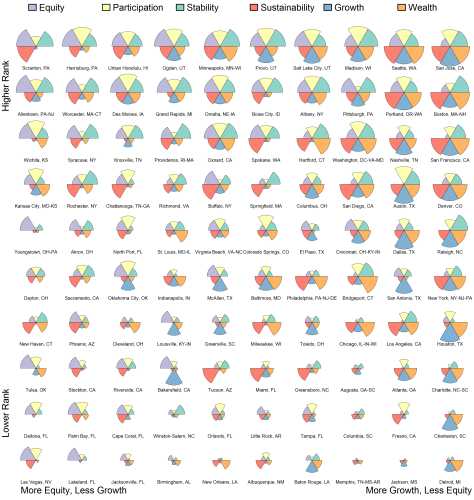
While the map displays a somewhat dizzying 16 clusters, there are four groups of clusters that share broadly similar inclusive economy characteristics.
- Metro clusters in the Midwest/Plains and Pacific Northwest tend to exhibit moderate to high levels of equity, participation, and stability, along with steady growth.
- Clusters in the Mountain West, older industrial areas of the Northeast, and Great Lakes register middling overall performance, and tend to score higher on equity than growth.
- Metro areas in the coastal and Texas clusters tend to rank high on traditional measures of competitiveness (e.g., growth, innovation, per-capita income), but lower in many inclusive economy characteristics, particularly equity.
- A final group of clusters are located across the southern United States, and face significant challenges across multiple inclusive economy characteristics. Many have large African-American and Latino populations, indicating that their subpar outcomes on inclusion have an important racial and ethnic dimension.
Ultimately, efforts to build a more inclusive U.S. economy will need to wrestle with the distinctive strengths and challenges that metropolitan economies exhibit. This analysis suggests that metro clusters might offer a framework for common investment strategies, and opportunities for shared learning among local leaders with their metro peers.
John Irons is managing director, Global Markets, of the Rockefeller Foundation, which provides financial support for Brookings.
Related Content


The Brookings Institution is committed to quality, independence, and impact.
We are supported by a diverse array of funders. In line with our values and policies, each Brookings publication represents the sole views of its author(s).


Commentary
A metro map of inclusive economies
May 18, 2016