When the United Nations recently announced a $286 million budget cut, a number of eye-catching headlines generated confusion as to why this occurred. Making matters worse, few observers can easily describe how the U.N.’s core organizational budget relates to the larger family of U.N. organizations—like the World Food Program and the Department of Peacekeeping Operations—or how it stacks up alongside other major multilaterals like the World Bank and the Global Fund to Fight AIDS, Tuberculosis, and Malaria. To help inform such assessments, our new policy brief, “Who funds which multilateral organizations?” presents a snapshot of how all countries, plus the Bill & Melinda Gates Foundation, have recently allocated funding across 53 distinct multilateral organizations (see Box 1 at bottom for the list of organizations).
Here we describe some key results, with a focus on how much each country contributes, how important each funder is to each organization, and how funding allocations compare to objective benchmarks like share of donor country income, share of world income, and share of world population.
How much do countries contribute?
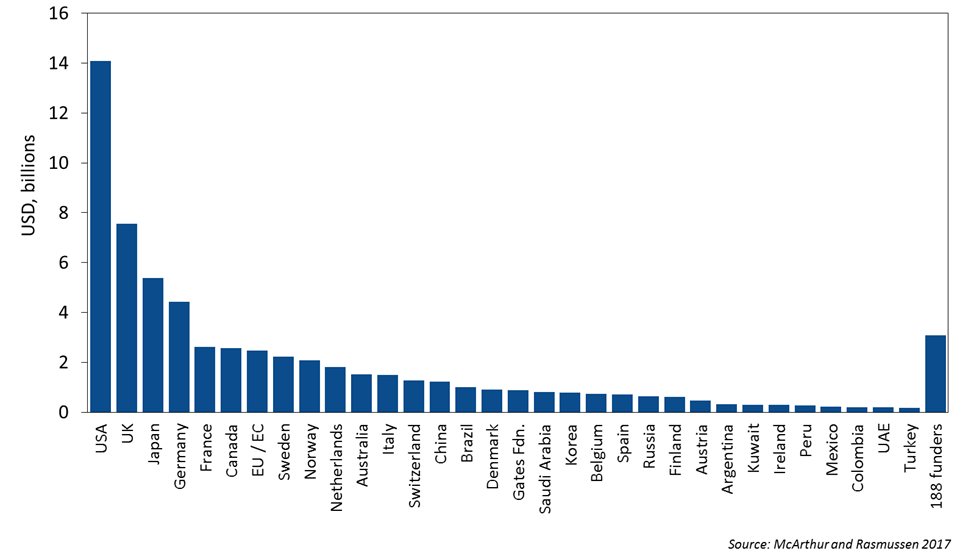
The 53 multilaterals in our sample received around $63 billion per year in estimated direct, recurrent grant funding during the 2014-2016 period. Figure 1 shows the composition of these resources by funder. In absolute terms, the U.S. is the largest overall funder at $14.1 billion per year, providing 22 percent of the sample’s resources. The U.K. is the second-largest funder at $7.6 billion (12 percent), followed by Japan at $5.4 billion (9 percent) and Germany at $4.4 billion (7 percent). These four countries contribute approximately 50 percent of the total funding, and the top 32 funders account for 95 percent. Notably, the Bill & Melinda Gates Foundation is the 17th largest funder and provides more than $880 million per year.
Figure 1: Average total annual contributions to 53 multilaterals, 2014-16 (est.)
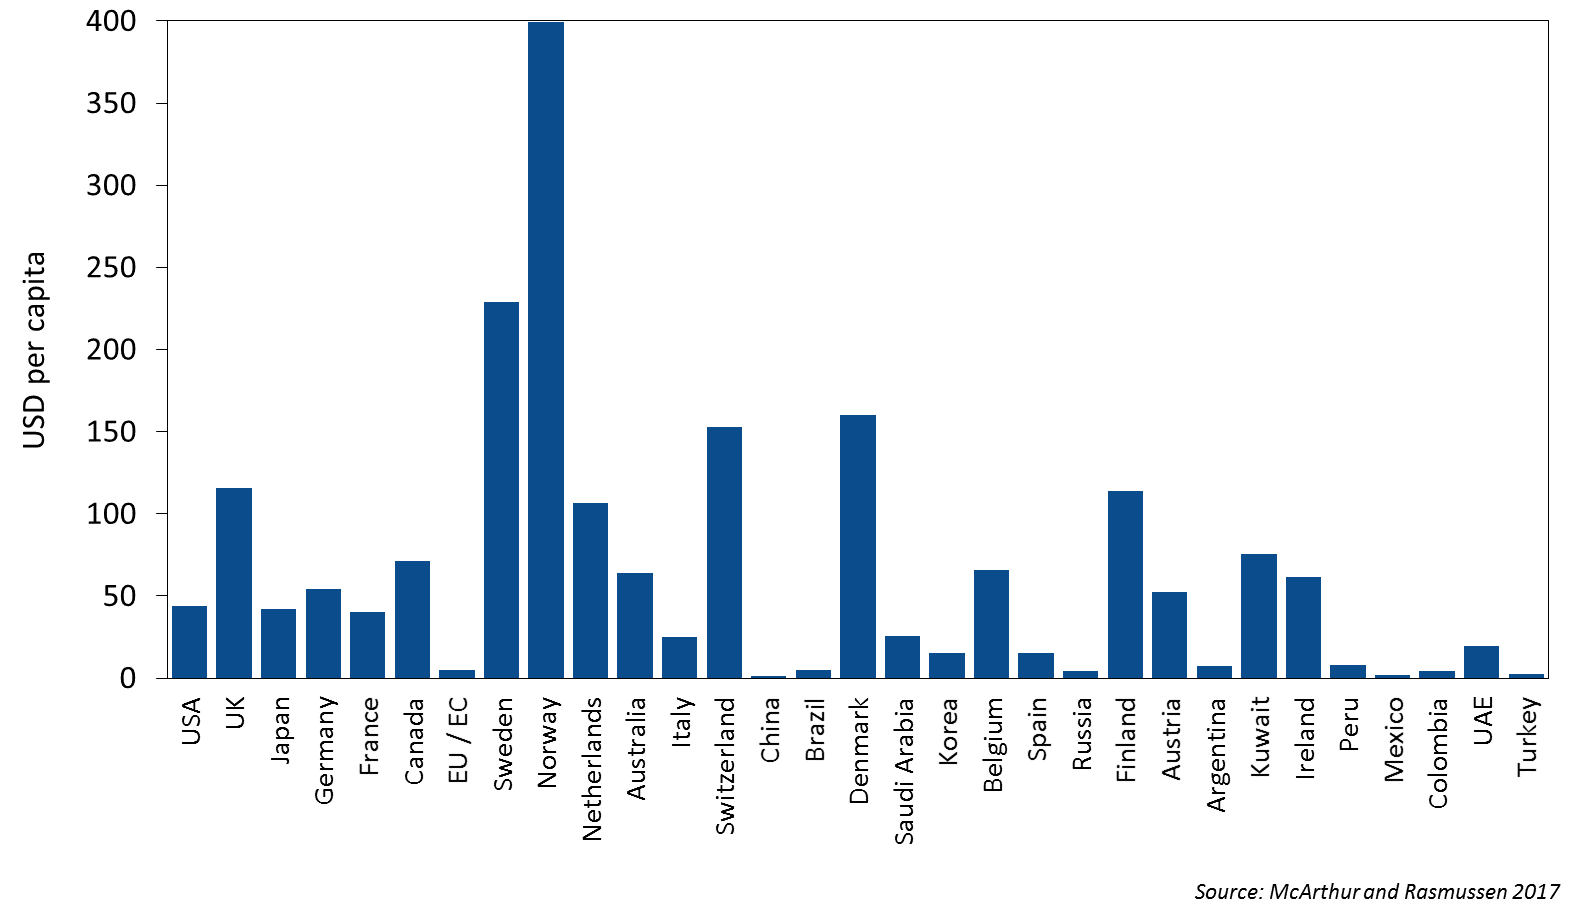
The funding picture looks quite different when translated into per capita terms, as in Figure 2. The graph shows that Norway contributes by far the most per person to the multilateral system, at $399 per year, followed by Sweden at $229 and Denmark at $160. Among the top three absolute funders in Figure 1, the U.S. ranks 20th overall in per capita terms at $44, the U.K., is eighth at $116, and Japan is 21st at $42. (Note that some smaller funders with sizeable per capita contributions are not included in the figure).
Figure 2: Average per capita annual contributions to 53 multilaterals, 2014-16 (est.)
How important is each funder to each organization?
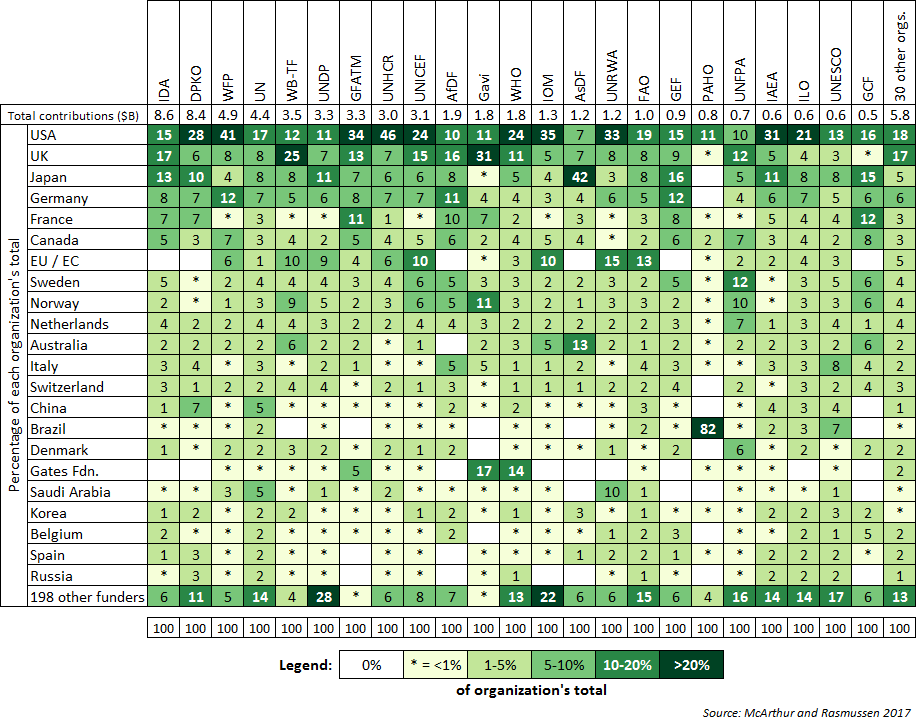
We next consider each funder’s relative importance to each organization. Figure 3 maps the share of each multilateral’s direct funding provided by each contributor, with a focus on the 23 largest organizations representing 90 percent of the sample’s funding. Vertical columns sum to 100 percent from top to bottom, with darker shades of green indicating larger shares of organizational funding. The largest recipient is the World Bank’s International Development Association (IDA), with an average of $8.6 billion per year, followed by the U.N.’s Department of Peacekeeping Operations (DPKO), at $8.4 billion.
Either the U.S., the U.K., or Japan is the largest funder for 42 organizations in the sample; the U.S. is top contributor to 24 organizations, the U.K. to nine, and Japan to nine. Other examples of largest contributors per organization include France for both the Council of Europe and La Francophonie; Sweden for the United Nations Population Fund (UNFPA) and U.N.-Women; Brazil for the Pan-American Health Organization (PAHO); Argentina for the International Civil Aviation Organization (ICAO); and Panama for the International Maritime Organization (IMO). The Bill & Melinda Gates Foundation is the second-largest funder to three organizations: Gavi, the Vaccine Alliance; the World Health Organization (WHO); and the Consultative Group for International Agricultural Research (CGIAR).
Figure 3: How important is each funder to each organization (% of grants)
How do funding contributions compare to objective benchmarks?
A limitation of the preceding analysis is that it fails to compare funders’ contributions to their respective sizes and capacities. As a starting point, we consider share of world population, share of world income, and (for relevant countries) share of total OECD donor country income as benchmarks. Figure 4 merges these with a consideration of how large a funder each country is for each organization. In the figure, the horizontal bars represent the share of direct funding the country provides to each respective organization. The three vertical lines from left to right indicate the share of world population, share of world income, and share of donor country income, respectively.
Figure 4: Country share of each organization’s funding relative to benchmarks (%)
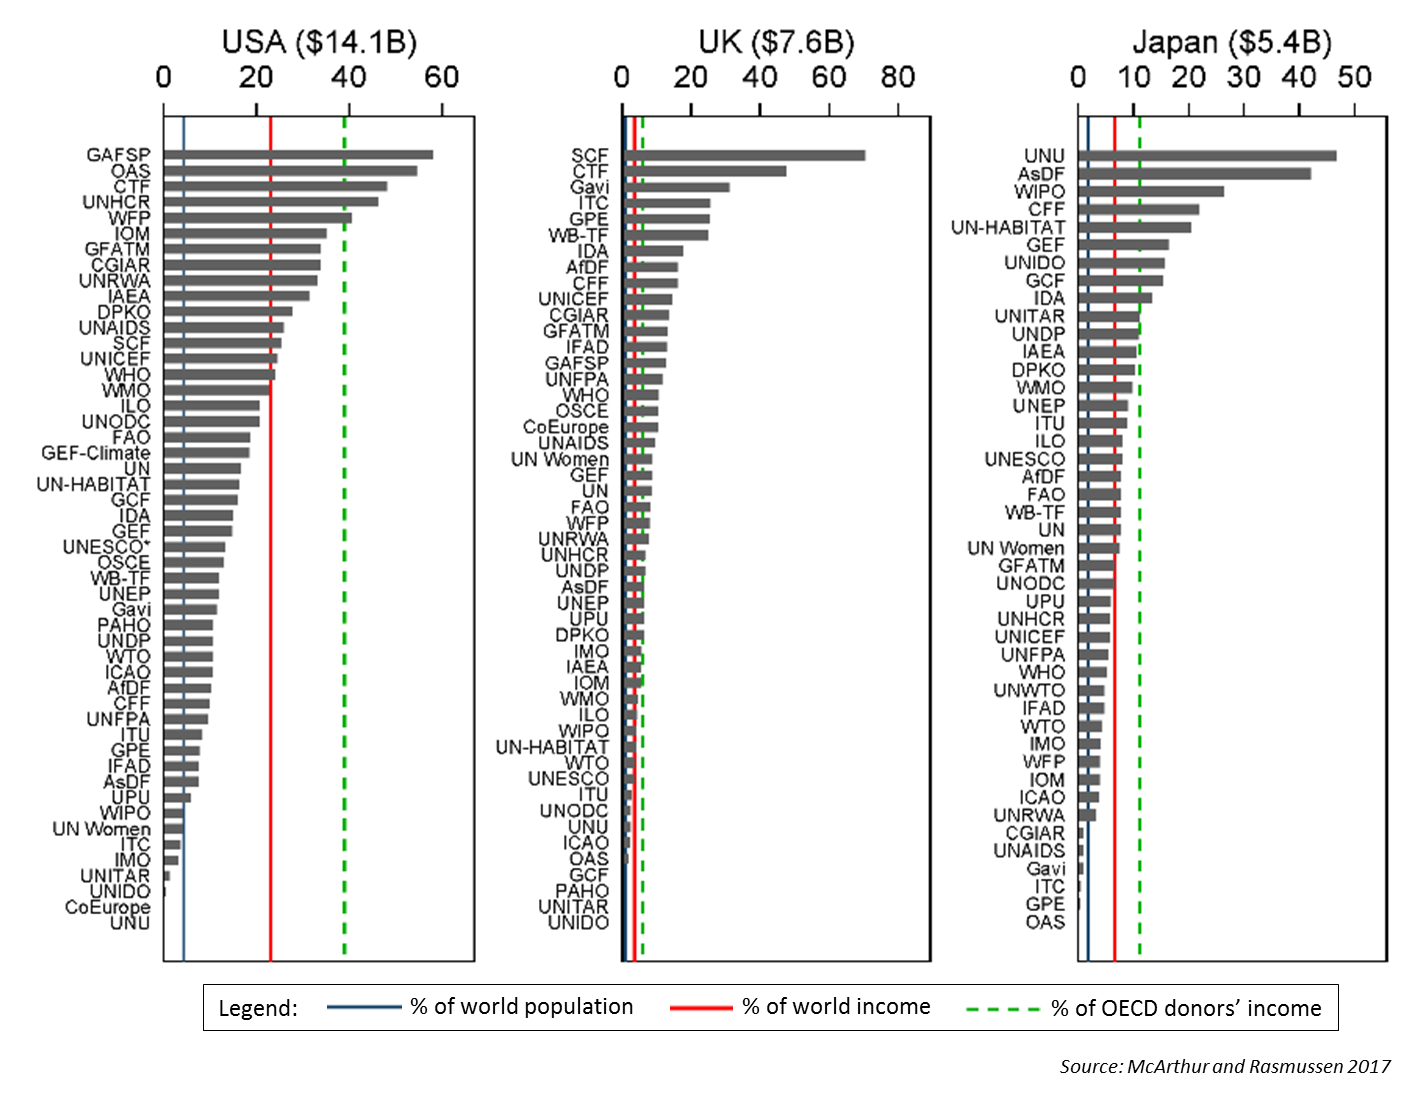
Among the three largest absolute funders presented in Figure 4, the U.K. contributes at least its share of funding relative to its share of total donor country income for 31 organizations, while Japan does so for 10 organizations, and the U.S. does for five. Comparable analysis of other countries shows that Norway exceeds its share of donor country income for 40 organizations, as does Sweden for 39, and Finland, Luxembourg, and Switzerland for 32.
Deeper dives
A fuller discussion of results is available in the policy brief itself. We have also posted digital tables here as an online supplement. We hope this allows readers to conduct deeper dives on individual funders and organizations as might be of interest. Comments and feedback are warmly welcome, as always.
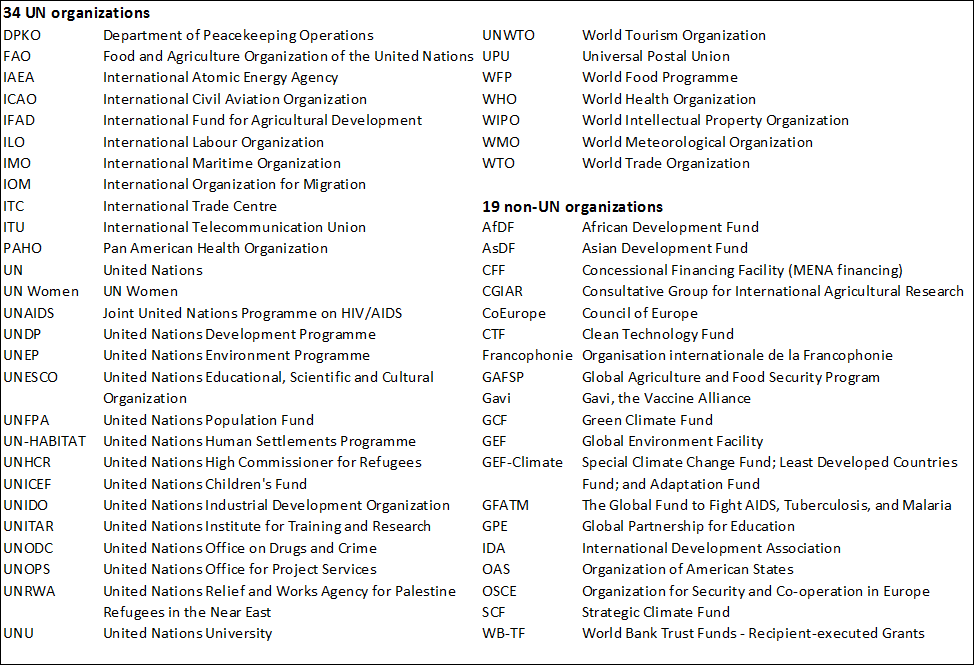
Box 1: 53 multilateral organizations in sample
Related Content
Authors


The Brookings Institution is committed to quality, independence, and impact.
We are supported by a diverse array of funders. In line with our values and policies, each Brookings publication represents the sole views of its author(s).


Commentary
Who actually funds the UN and other multilaterals?
January 9, 2018