The discussion about welfare measurement has long examined how to use income standards to reflect the level and the changes in the well-being of individuals and households across countries. The contemporary global development debate has focused on improving the monetary metrics, typically emphasizing the extremities of the income distribution. For example, global goals and national plans commit to ending poverty by lending a hand to those at the bottom. Concerns about inequality, on the other hand, emphasize the large gaps between those at the lower tail of the distribution and those at the upper tail, particularly at the tippy top. Debates about the notion of inclusive growth focus on how quickly the income of those at the bottom (in the case of the World Bank’s goal of “boosting shared prosperity,” the bottom 40 percent) is growing over time, as the overall distribution shifts through the process of economic growth.
Each of these approaches gives us important information about the distribution of income and how it is changing over time, but (as is the case with all measures) they only tell part of the story by looking mainly at the tails of the distribution. These measures don’t study what is happening in the middle and miss a big part of the development story.
Missing out on the ‘middle’
The term “middle” is in quotation marks here because there are many ways to interpret what this means. One common interpretation is that of the “middle class,” which can be based on a notion of households’ economic security (absolute definition) or those at the middle point (relative definition). For example, the World Bank defines the middle class based on an absolute income threshold that aligns with a probability of falling into poverty lower than x percent (typically 10 percent), in line with our proposed “vulnerability approach,” first implemented in for all Latin American countries in a 2013 report on social mobility and middle classes. However, as this is an absolute rather than a relative definition of the middle, in many countries this group does not actually correspond to the middle of the income distribution in a statistical sense. In the Latin America and the Caribbean (LAC) region, for example, the middle class as defined by this approach starts around the 66-67th percentile of the income distribution, because incomes below this are inconsistent with economic security standards that “properly” define a middle class.
Why don’t we always look carefully at what is happening in the middle? One way to systematically study what is happening in “the middle” is to look at median income—the income of the person(s) in the 50th percentile of the income distribution. In other words, if everyone in a society lined up from poorest to richest—the persons earning the median income would find themselves straddling the divide between the half of the population that is poorer than them and the other half of the population that is richer than them.
Compared to other income standards which measure the size of the distribution (such as mean income), median income is less sensitive to what is happening at the tails of the distribution, which is always a contentious issue due to underreporting and measurement problems to properly characterize the tails (particularly the upper tail when it comes to underreporting). While median income measures can capture the level and changes in the welfare indicator at the middle of the distribution by design, mean income measures can obscure these changes if more extreme values end up pulling averages up or down. Median income is thus not affected by common problems of measurement error at the tails, such as nonresponse or underreporting of income at the top.
What’s happening to the median Latin American and Caribbean persons?
Median income measures do tell a relevant story about growth and in its incidence. Using household survey data for Colombia, Chile, Mexico, Peru, and Uruguay between (circa) 2002 and 2019, we can see what this measure tells us about what is happening with monetary well-being over the past two decades. Note that in all these countries (as in many the world), mean income is higher than median income. This is because the income distribution is positively skewed with a long right tail, reflecting the empirical reality that most people earn less than the average income and a handful of high earners pull up the average.
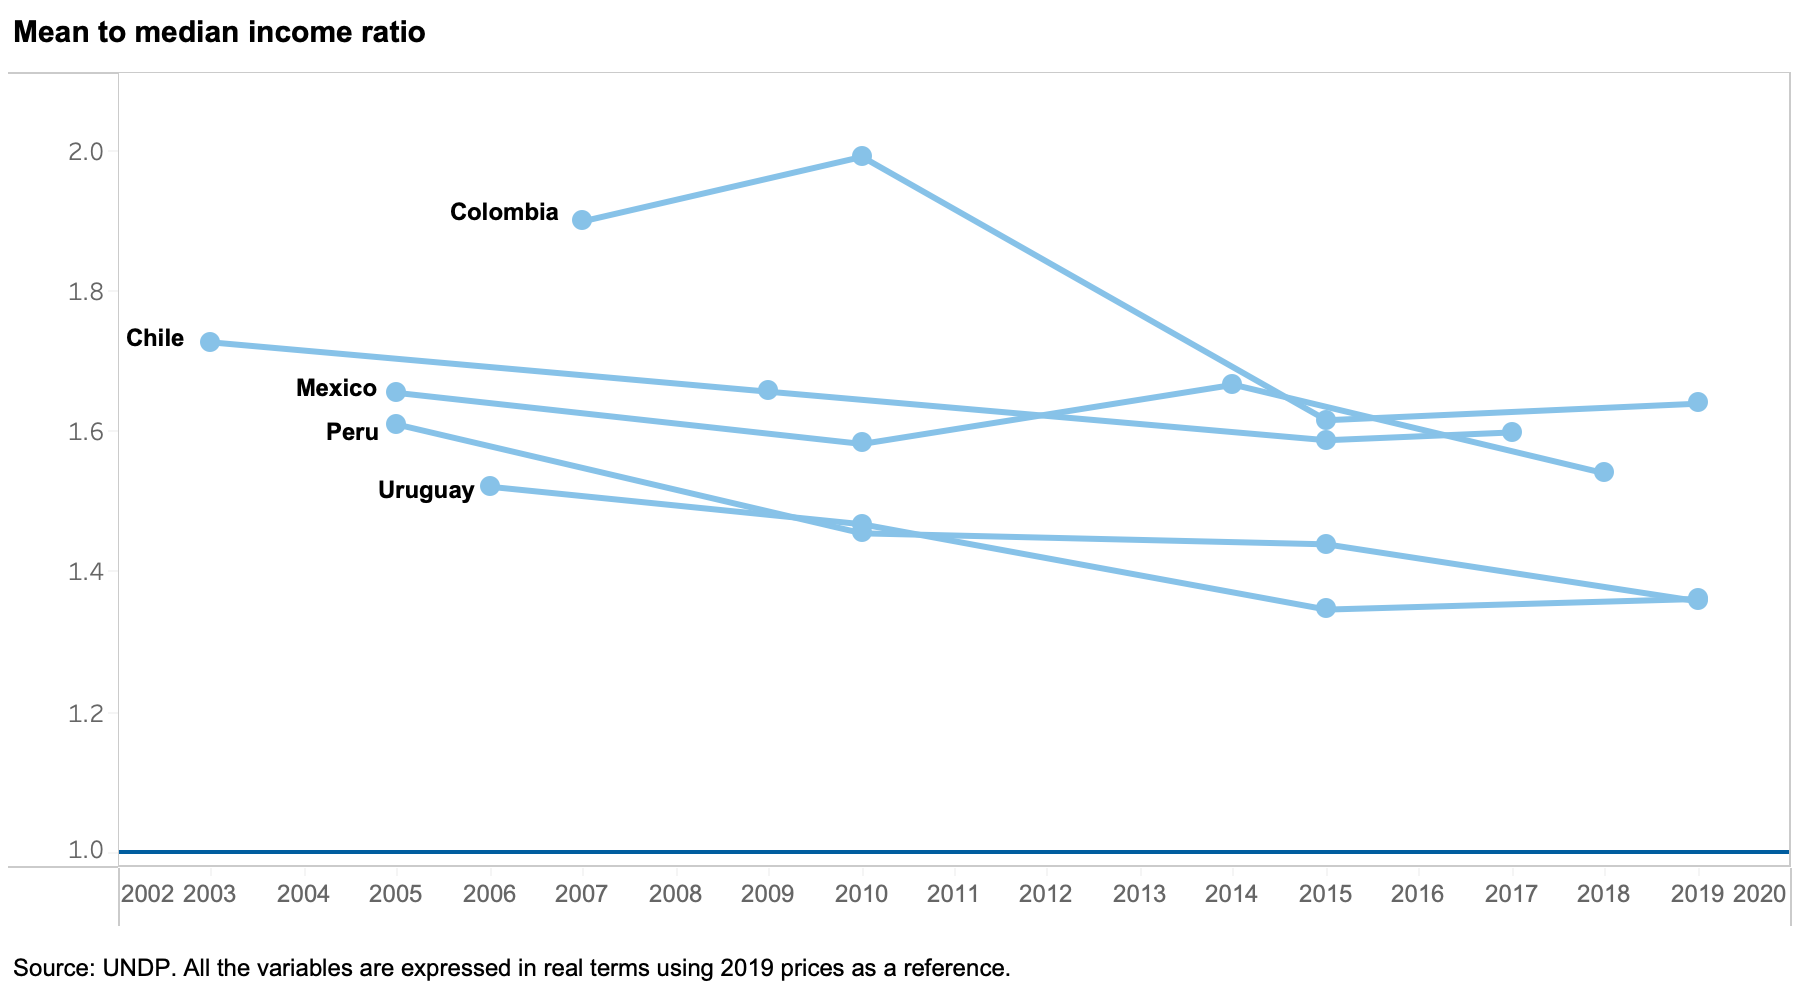
Looking at the data in these LAC countries represented in Figures 1, 2, and 3, a few facts emerge.
Figure 1. Both median income and mean income have risen steadily in all countries
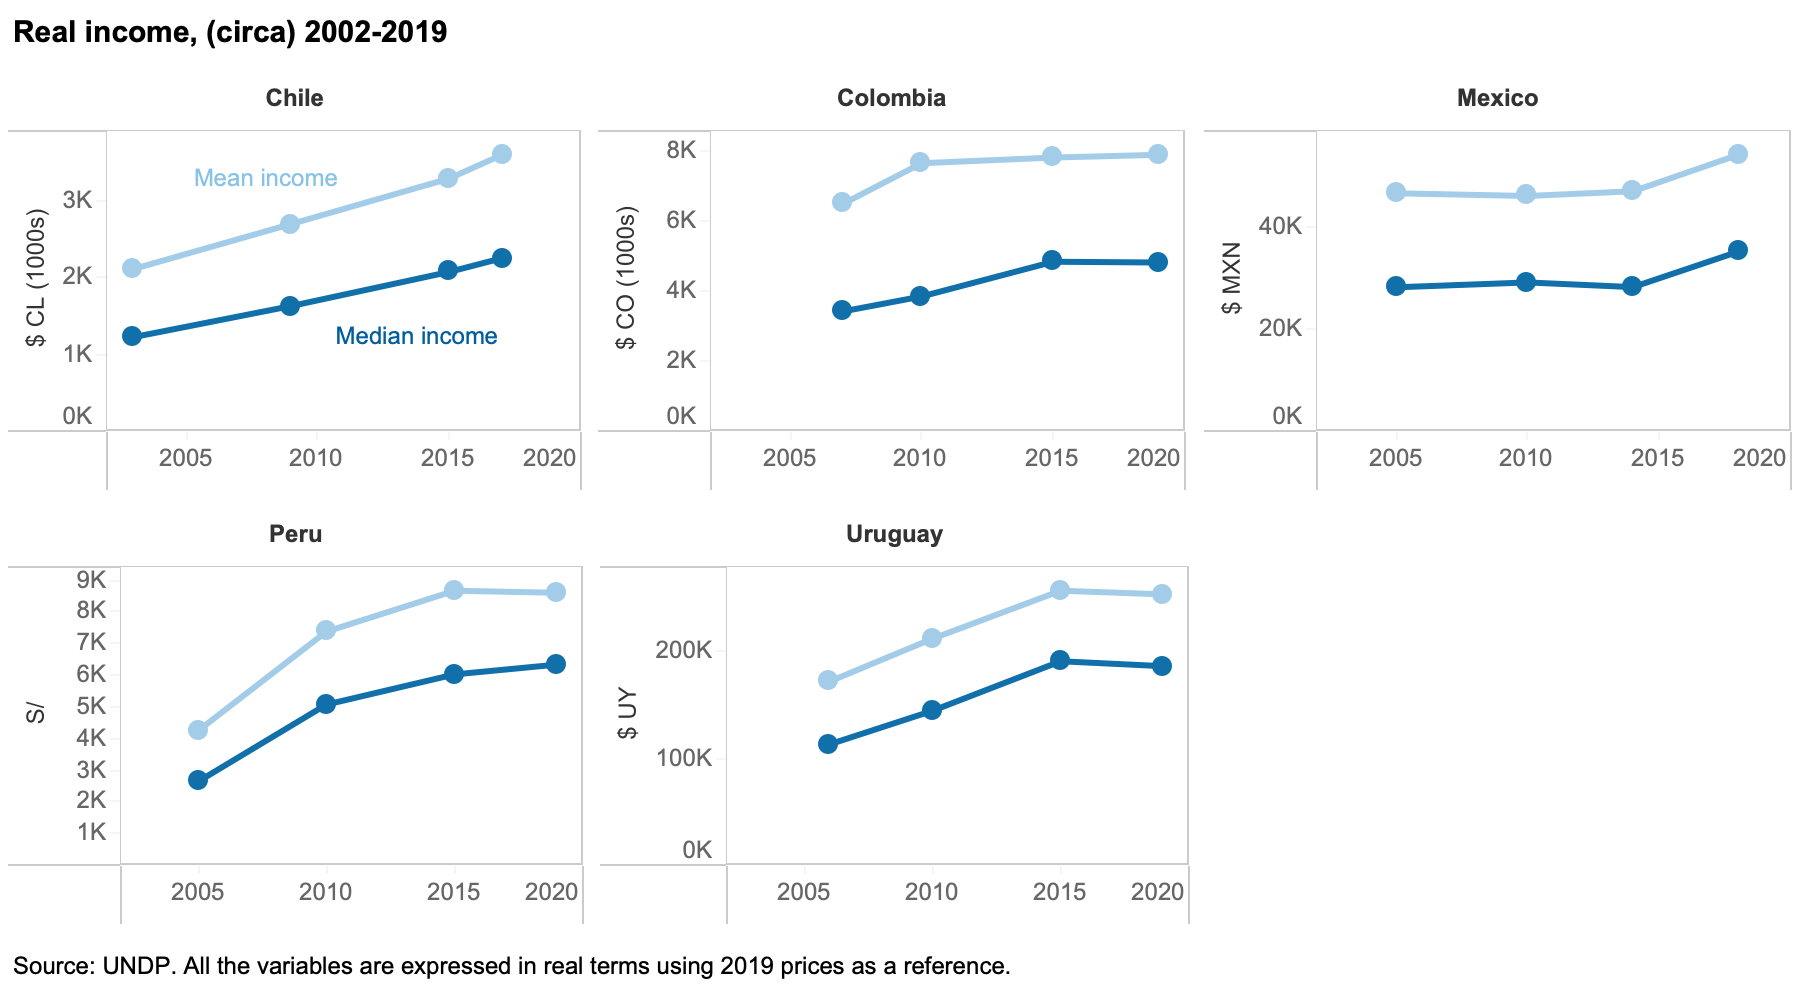
Figure 2. Median income has grown at a faster pace than the mean income in all countries
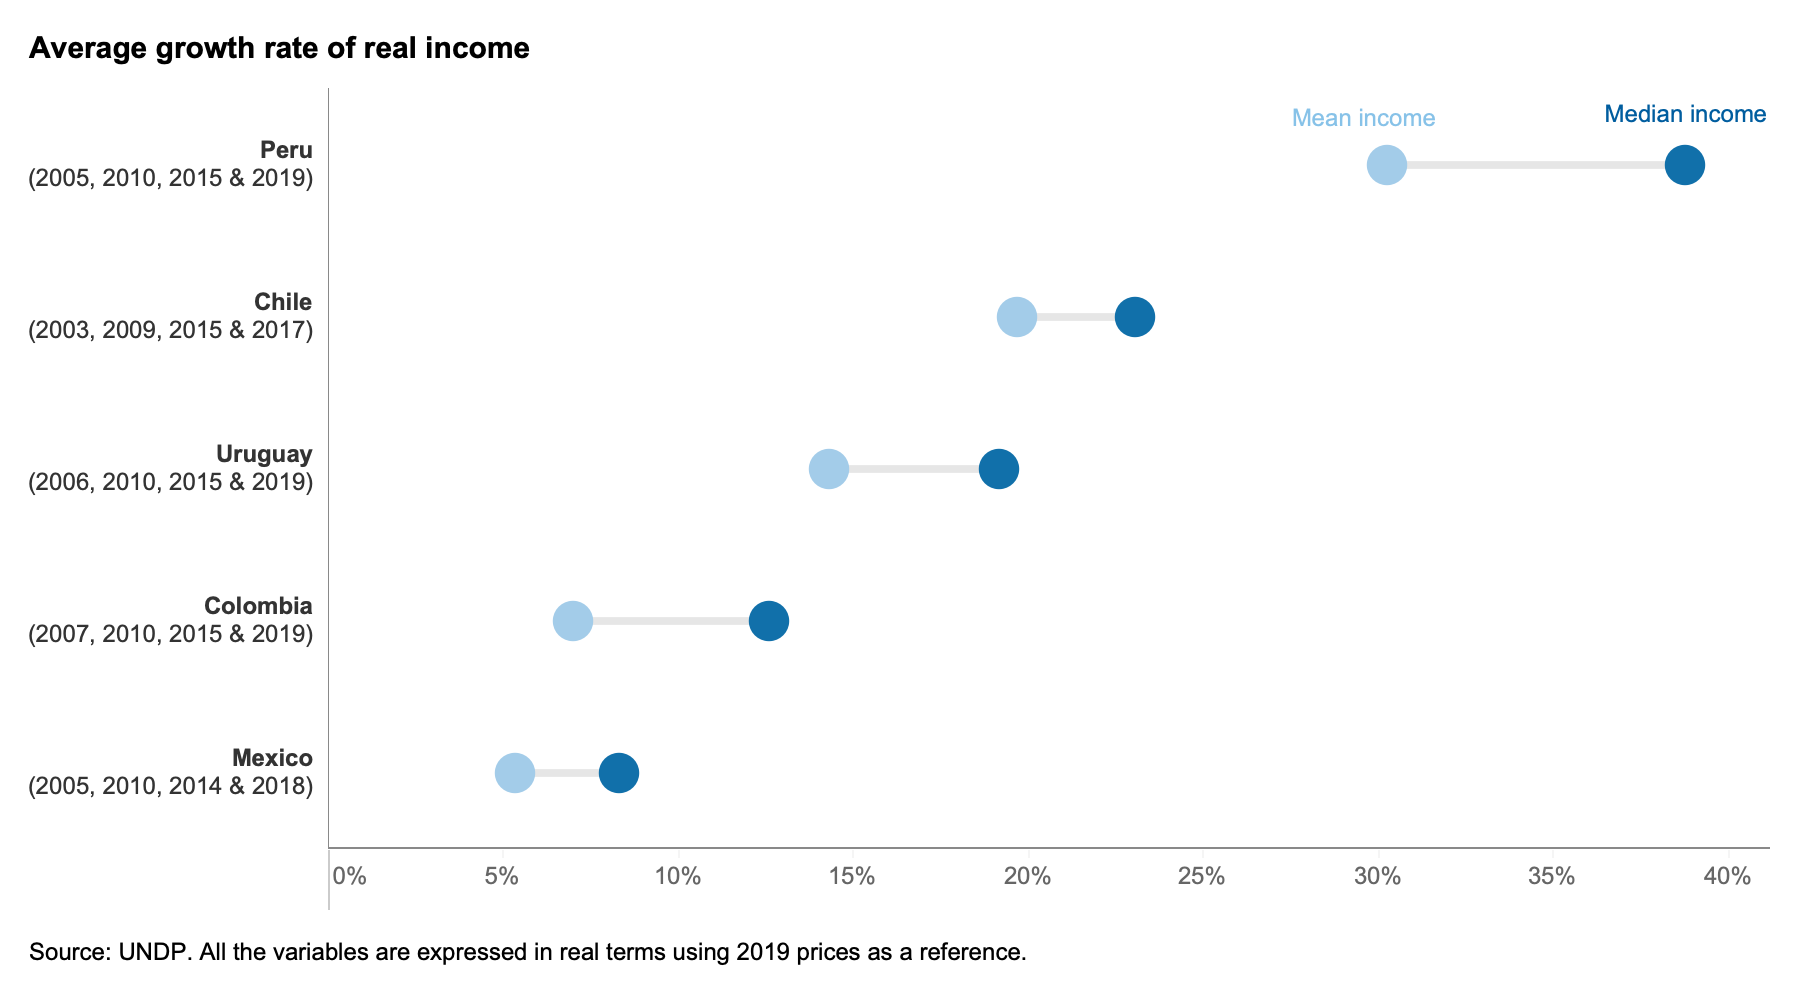
Figure 3. Following from the previous point, the ratio of mean to median income has fallen in all countries
What these findings imply for economic policy—and politics
While there are different possible interpretations of these patterns, the most obvious interpretation is that growth is being “shared” in LAC. Overall increases in income are not only being driven by increasing gains for those at the top, but also by gains for the ‘typical’ person. This could reflect, for example, that the shape of the distribution is becoming more like a normal distribution (in a normal distribution, the mean and median income are the same—which would result in a mean to median income ratio of 1). In all countries, we see this ratio slowly inching closer to that threshold.
Moving from a positively skewed distribution toward a more normal-shaped distribution would imply a shift from a society where there are a lot of low earners and a few high earners to a society where more people are middle earners. It is, in principle, a less “polarized” (or unimodal) distribution in that characteristic. This is important because building a strong middle class can help foster more stable and cohesive societies over time.
Understanding what is happening with those in the middle is not only relevant for economics, but also for politics—for example, in the context of understanding the preferences of the median voter or concerns over polarization. Another interpretation could be linked to productivity, incentives, and aspirations. A “race” between an increasing mean income and a growing median income could show a positive productivity dynamic, as a higher mean income could be an “aspirational milestone” for the “average” individual. The median income per se cannot tell us a full story about inclusive growth or inequality, but neither can any other income standard per se.
Arguably, there are already too many development indicators to track (the Sustainable Development Goals alone include 231 indicators), it is important to stop and reflect on what we are measuring, what these indicators are telling us, and what they are not. Median income is a measure that has been surprisingly absent in the mainstream development dialogue. While it is not an “ideal” measure by any means, its unique properties can offer us a different perspective on how the income distribution is changing—particularly when used in comparison with other measures such as mean income. Arguably again, median income measures are particularly relevant for middle-income societies where absolute income thresholds may be less meaningful in the context of improving living standards. For example, countries in the European Union use median income as a benchmark to define poverty thresholds (currently set at 60 percent of national median income). As Nancy Birdsall and Christian Meyer argued in 2014, combining median income with measures such as mean income (e.g., through a simple ratio as illustrated above) can offer a more “distribution-aware” perspective on changes in material well-being—referring to median income as “a good-enough measure.”
So, should we be using median income more? It depends. Ultimately, the most relevant indicator will be the one that can be more helpful to address the policy question in mind. Median income is obviously a useful measure that can help to complement what we see happening to income at the mean, at the bottom, and at the top. On its own, no single measure tells the full story.
Related Content


Authors


The Brookings Institution is committed to quality, independence, and impact.
We are supported by a diverse array of funders. In line with our values and policies, each Brookings publication represents the sole views of its author(s).


Commentary
Eliciting welfare information from both the tails and the middle of income distributions
November 19, 2021