In 2013, economists Christoph Lakner and Branko Milanovic published a graph—quickly dubbed the “elephant chart”—to depict changes in income distribution across the world between 1988 and 2008. The chart has been used to support numerous reports of rising inequality fueled by increased globalization. Every time a populist movement rises, every time the elite gather in Davos, every time Oxfam publishes a new report on inequality, the elephant chart resurfaces.
We examine how four parts of the elephant chart—tail, torso, trough, and trunk—hold up to new data and new methods. We caution that, while elements of the original story have certainly been confirmed by other data in other contexts, the elephant shape itself may be an overburdened and inaccurate depiction of what is really going on in the world economy.
Revisiting the original elephant chart
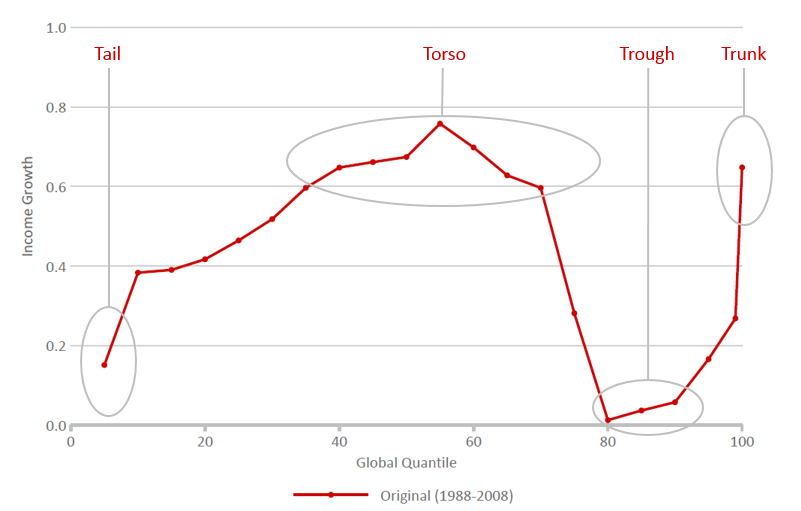
The original elephant chart, reproduced in Figure 1, records the income growth of each ventile of the global income distribution over the course of 20 years. It has been used as evidence to support four stylized facts about who has benefited from globalization:
- The Trunk: The global elite, in particular the top 1 percent, have enjoyed massive income growth over the past decades. Their high income growth, coupled with a high initial share of income, implies that they continue to capture a large share of global income growth.
- The Trough: The global upper middle class, interpreted as the rich world’s middle classes in 1988, has seen its income stagnate. This appears to corroborate other data showing stagnant real wage growth and other frustrations fueling populist politics in advanced economies.
- The Torso: The global middle class has risen rapidly as select developing countries converge toward rich countries. Countries like China have lifted large impoverished populations into the middle class. This can be seen in the graph’s peak at the elephant’s torso.
- The Tail: The global extreme poor have largely been left behind, with several countries stuck in a cycle of poverty and violence. This can be seen in the elephant’s slumped tail.
Figure 1. Original elephant chart
We show that these stylized facts do not all hold up when the data are updated and when new methodologies, that more closely apply to the way in which the chart is interpreted, are applied.
Updating the data
We first use the same methodology as Lakner and Milanovic but with updated data to generate a new elephant chart. The updates, described further in our paper, include:
- Adding more countries to the sample, so that we now cover 98 percent of the global population compared to around 80 percent in the original.
- Moving from 2005 purchasing power prices to the more accurate 2011 version.
- Shifting the period under consideration from 1988-2008 to 1993-2013 to capture the post-Great Recession period.
Figure 2 compares the original and the updated curves, yielding a somewhat different interpretation of trends in the global income distribution.
Figure 2. Revised elephant chart with consistent expanded sample in 2011 PPP
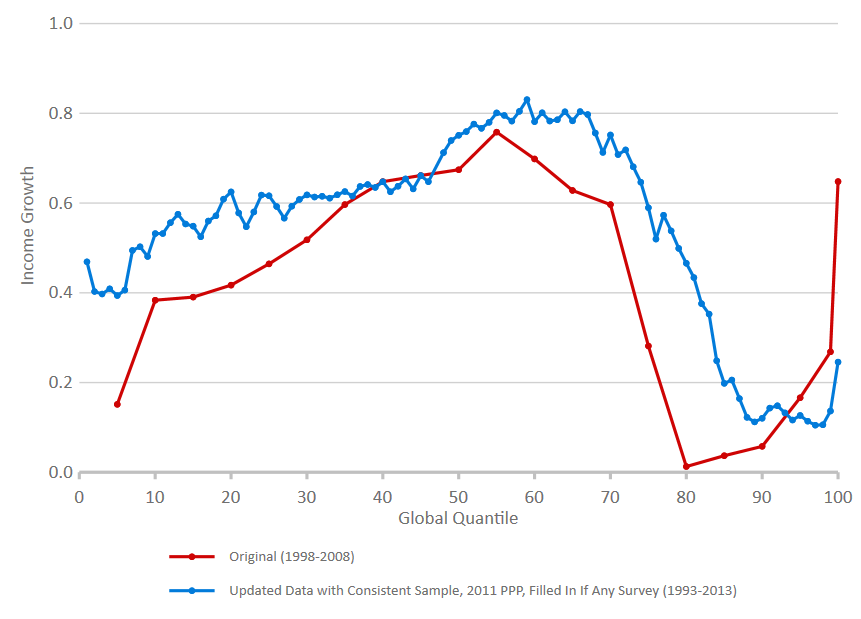
In the updated version, there is limited evidence that the global poor have been seriously left behind. The slumped tail on the original elephant appears to be largely an artifact of a shift in the sample of countries used in the original chart between the initial and final year. Our updated version, which provides the best available coverage of low-income countries and holds the country coverage the same across periods, shows that incomes at the bottom of the global distribution grew at least 40 percent over 20 years. This is consistent with other efforts to measure poverty, which show a major reduction in the extreme poverty rate over the past three decades.
The torso of the elephant, which shows the rise of the global middle class, is unchanged. Most Chinese and Indians do indeed fall in the middle of the global income distribution, and their income growth is largely responsible for the torso’s height.
The trough, however, is much less extreme. This section of the chart is perhaps the most misunderstood: It contains large populations from Japan, Eastern Europe, and Latin America in addition to the poor of the Western world. It comes as no surprise that income growth in these places was poor—recall Japan’s Lost Decade after 1991, the collapse of Eastern European economies after the fall of the Berlin Wall, and repeated crises and even hyperinflation in Brazil. Importantly, this trough does not actually contain many people from, say, the U.S. middle class. When placed in a global context, 60 percent of the U.S. population falls in the top five percent of the global distribution.
The updates also reveal a far smaller trunk for the elephant. This occurs in part because the rich fared poorly in the post-recession period, especially in Europe where recovery has lagged. We caveat this finding by noting that other methods—notably those used by the World Wealth and Income Database project—find greater income growth for the rich, albeit under quite restrictive assumptions. Here, we simply note that using the same methodology but with different time periods, prices, and a more complete country sample results in a very distinct change in the interpretation of the original graph.
Changing methodology: The quasi-non-anonymous growth incidence curve
We next present a methodology that aligns more closely with the way the elephant chart has often been interpreted. The original elephant chart is anonymous, meaning that the country-decile composition of the world income distribution changes from the initial period to the final period. For example, 35 percent of Japanese were in the top 1 percent of the global distribution in 1993, but only 20 percent were in that bracket in 2013. The original methodology therefore does not show changes in incomes of specific groups of people..
An alternative approach is to identify the country-decile composition in the base year, and assign to each income bracket a growth rate that is the population weighted average of the country–decile income growth rates. In other words, if the global 60-65th percentile bracket has 40 percent Chinese from their second richest decile, and 20 percent Indians from their second richest decile, and so on, then we can calculate a weighted average of how each of these country-decile incomes have grown. This sort of chart, which Lakner and Milanovic term a quasi-anonymous growth incidence curve, is shown in Figure 3 below. It allows us to more closely describe what happened to the income growth of those people who were in each ventile of the global income distribution in 1993.
Figure 3. Anonymous growth incidence curve versus quasi-non-anonymous growth incidence curve
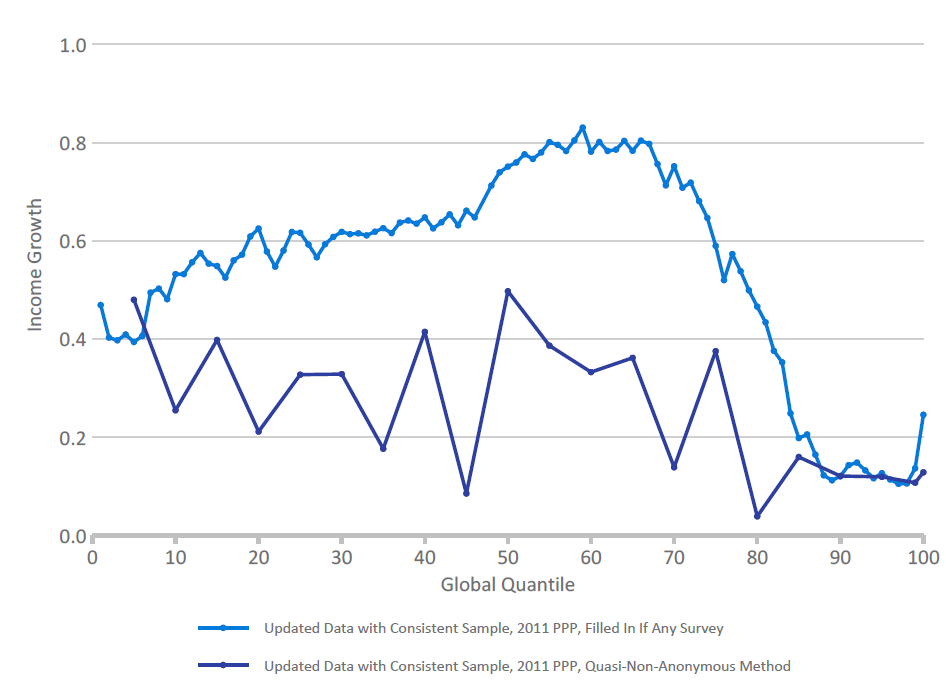
The shape of this chart is quite different. It suggests that people who were extremely poor in 1993 actually had, on average, reasonable income growth rates. This is unsurprising given that many rural Chinese and Indians are in this group.
More generally, the figure’s downward-sloping trend shows that there has been considerable global convergence: People who were poorer at the start of the 1990s had more rapid income growth than those who were richer. At the upper end of the distribution, the stagnation in Japan and Europe has meant that the global rich have not been leaving everyone else behind. Of course, these are large aggregates, and within the global rich, the ultra-rich may have had handsome income growth.
Conclusions
We conclude with three observations.
First, we remain optimistic that the world is a better place for more and more people, and that the real global story is now one of improvement in global income distribution; between-country and within-country convergence both appear to be widespread in the global economy. In the household survey data, interestingly, far more countries show improvements in the Gini coefficient this century than a worsening. Only in developed countries is there systematic worsening of income distribution. We conclude from this that major structural forces in the world economy, such as globalization or technology change, are not driving income distribution outcomes in an unfair way in all countries, but have a differential impact according to country policies and institutions. We remain particularly concerned about prospects for the very poor in fragile states, for those in middle-income countries that seem trapped and unable to grow and for those in countries where income distribution is shifting rapidly to the top.
Second, our research has sensitized us to the difficulties in comparing distributional data across countries. We would encourage the use of national data, not global data, when attempting to explain any individual country’s social and political trends. This is especially important because most individuals evaluate their socioeconomic status by comparing themselves to their neighbors and countrymen, not to the global population. Arguing about whether the middle class in one country is being out-performed by those in another country seems to be a distraction from the real issue of why the middle class in some places is feeling so vulnerable. The world is not yet so integrated that global trends matter more than national policies—quite the reverse.
Third, we advise extreme caution in interpreting what has happened to top incomes and in mixing data between surveys and tax administration sources. Both have limitations and are of different quality and relevance in different parts of the world. They also address different questions. We are only starting to develop methods that can reliably give a sense of what is really happening at these extremes.
As we unpacked the elephant chart, it became clear that the distributional gains from the past 30 years of growth and globalization are far from clear. The lack of comparable data means this will continue to be a debate that can be endlessly argued but perhaps never satisfactorily settled.
Related Content


Authors


The Brookings Institution is committed to quality, independence, and impact.
We are supported by a diverse array of funders. In line with our values and policies, each Brookings publication represents the sole views of its author(s).


Commentary
New insights into the distribution of world income
April 9, 2018