

The COVID-19 pandemic has introduced uncertainty into major aspects of national and global society, including for schools. For example, there is uncertainty about how school closures last spring impacted student achievement, as well as how the rapid conversion of most instruction to an online platform this academic year will continue to affect achievement. Without data on how the virus impacts student learning, making informed decisions about whether and when to return to in-person instruction remains difficult. Even now, education leaders must grapple with seemingly impossible choices that balance health risks associated with in-person learning against the educational needs of children, which may be better served when kids are in their physical schools.
Amidst all this uncertainty, there is growing consensus that school closures in spring 2020 likely had negative effects on student learning. For example, in an earlier post for this blog, we presented our research forecasting the possible impact of school closures on achievement. Based on historical learning trends and prior research on how out-of-school-time affects learning, we estimated that students would potentially begin fall 2020 with roughly 70% of the learning gains in reading relative to a typical school year. In mathematics, students were predicted to show even smaller learning gains from the previous year, returning with less than 50% of typical gains. While these and other similar forecasts presented a grim portrait of the challenges facing students and educators this fall, they were nonetheless projections. The question remained: What would learning trends in actual data from the 2020-21 school year really look like?
With fall 2020 data now in hand, we can move beyond forecasting and begin to describe what did happen. While the closures last spring left most schools without assessment data from that time, thousands of schools began testing this fall, making it possible to compare learning gains in a typical, pre-COVID-19 year to those same gains during the COVID-19 pandemic. Using data from nearly 4.4 million students in grades 3-8 who took MAP® Growth™ reading and math assessments in fall 2020, we examined two primary research questions:
- How did students perform in fall 2020 relative to a typical school year (specifically, fall 2019)?
- Have students made learning gains since schools physically closed in March 2020?
To answer these questions, we compared students’ academic achievement and growth during the COVID-19 pandemic to the achievement and growth patterns observed in 2019. We report student achievement as a percentile rank, which is a normative measure of a student’s achievement in a given grade/subject relative to the MAP Growth national norms (reflecting pre-COVID-19 achievement levels).
To make sure the students who took the tests before and after COVID-19 school closures were demographically similar, all analyses were limited to a sample of 8,000 schools that tested students in both fall 2019 and fall 2020. Compared to all public schools in the nation, schools in the sample had slightly larger total enrollment, a lower percentage of low-income students, and a higher percentage of white students. Since our sample includes both in-person and remote testers in fall 2020, we conducted an initial comparability study of remote and in-person testing in fall 2020. We found consistent psychometric characteristics and trends in test scores for remote and in-person tests for students in grades 3-8, but caution that remote testing conditions may be qualitatively different for K-2 students. For more details on the sample and methodology, please see the technical report accompanying this study.
In some cases, our results tell a more optimistic story than what we feared. In others, the results are as deeply concerning as we expected based on our projections.
Question 1: How did students perform in fall 2020 relative to a typical school year?
When comparing students’ median percentile rank for fall 2020 to those for fall 2019, there is good news to share: Students in grades 3-8 performed similarly in reading to same-grade students in fall 2019. While the reason for the stability of these achievement results cannot be easily pinned down, possible explanations are that students read more on their own, and parents are better equipped to support learning in reading compared to other subjects that require more formal instruction.
The news in math, however, is more worrying. The figure below shows the median percentile rank in math by grade level in fall 2019 and fall 2020. As the figure indicates, the math achievement of students in 2020 was about 5 to 10 percentile points lower compared to same-grade students the prior year.
Figure 1: MAP Growth Percentiles in Math by Grade Level in Fall 2019 and Fall 2020
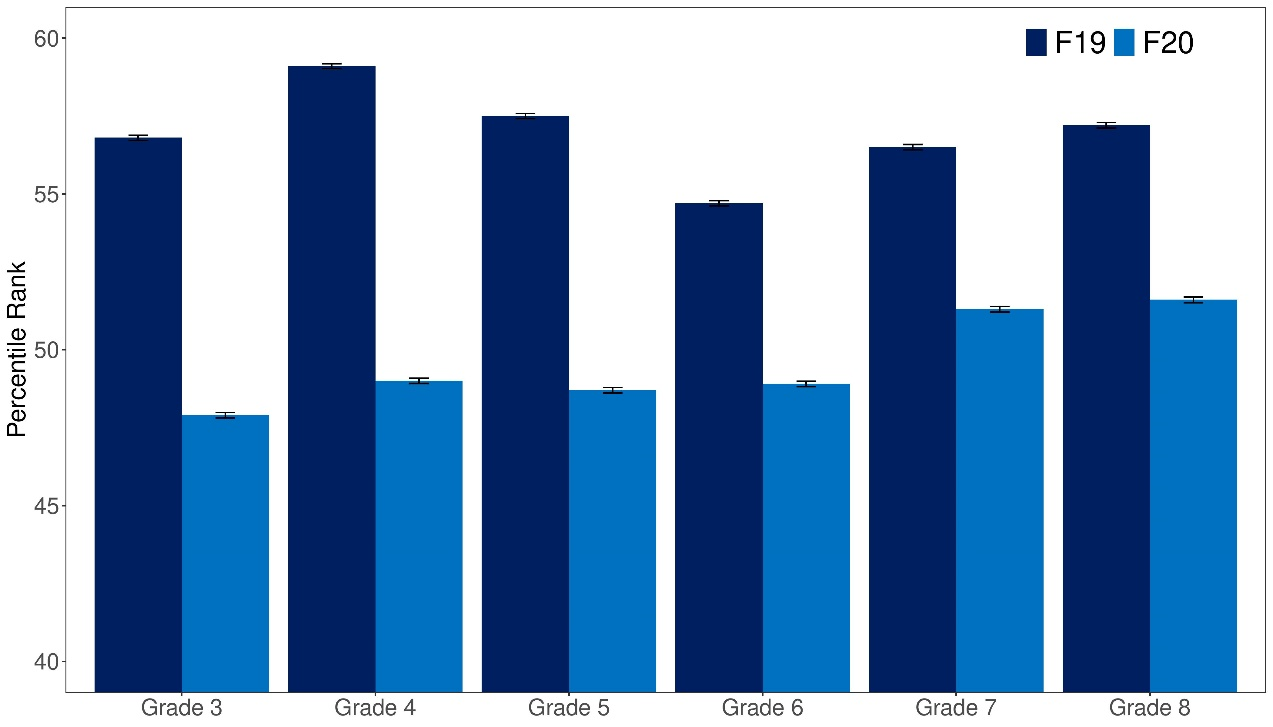
Source: Author calculations with MAP Growth data.
Notes: Each bar represents the median percentile rank in a given grade/term.
Question 2: Have students made learning gains since schools physically closed, and how do these gains compare to gains in a more typical year?
To answer this question, we examined learning gains/losses between winter 2020 (January through early March) and fall 2020 relative to those same gains in a pre-COVID-19 period (between winter 2019 and fall 2019). We did not examine spring-to-fall changes because so few students tested in spring 2020 (after the pandemic began). In almost all grades, the majority of students made some learning gains in both reading and math since the COVID-19 pandemic started, though gains were smaller in math in 2020 relative to the gains students in the same grades made in the winter 2019-fall 2019 period.
Figure 2 shows the distribution of change in reading scores by grade for the winter 2020 to fall 2020 period (light blue) as compared to same-grade students in the pre-pandemic span of winter 2019 to fall 2019 (dark blue). The 2019 and 2020 distributions largely overlapped, suggesting similar amounts of within-student change from one grade to the next.
Figure 2: Distribution of Within-student Change from Winter 2019-Fall 2019 vs Winter 2020-Fall 2020 in Reading
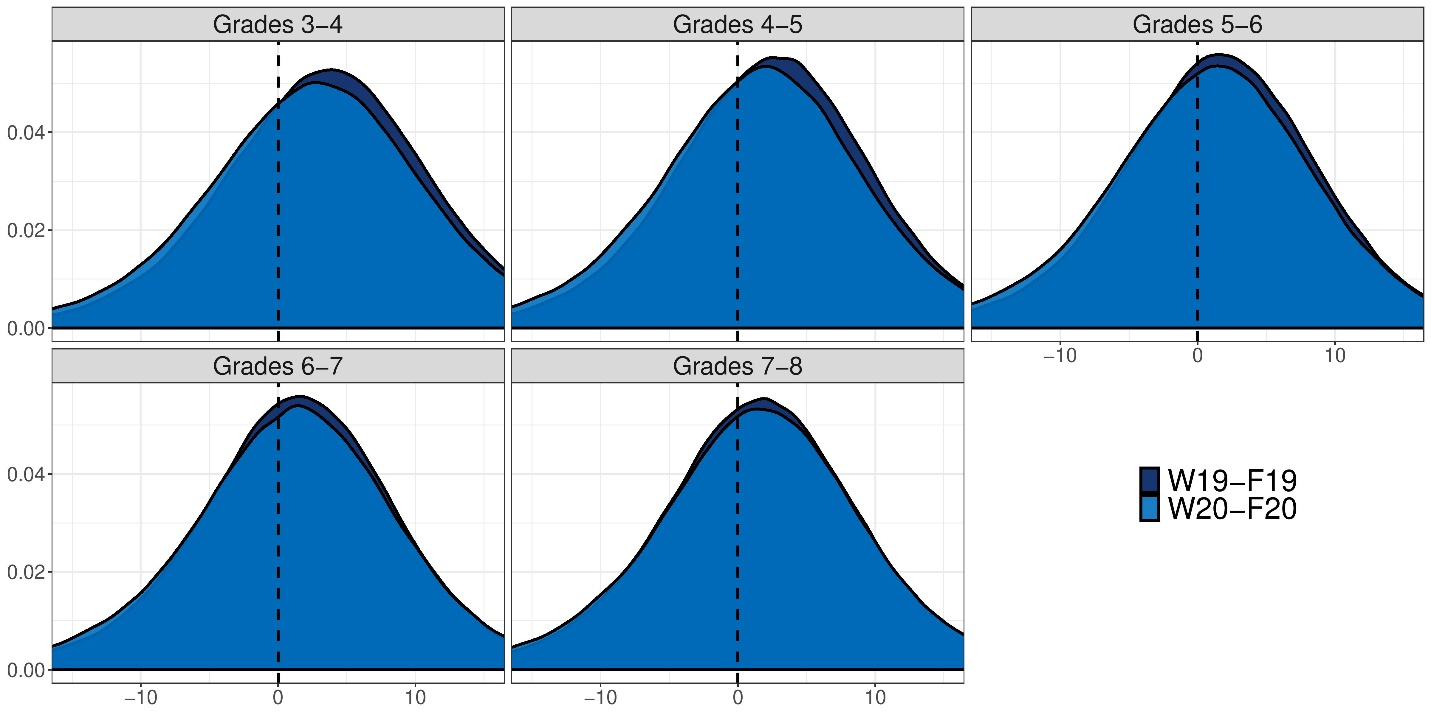
Source: Author calculations with MAP Growth data.
Notes: The dashed line represents zero growth (e.g., winter and fall test scores were equivalent). A positive value indicates that a student scored higher in the fall than their prior winter score; a negative value indicates a student scored lower in the fall than their prior winter score.
Meanwhile, Figure 3 shows the distribution of change for students in different grade levels for the winter 2020 to fall 2020 period in math. In contrast to reading, these results show a downward shift: A smaller proportion of students demonstrated positive math growth in the 2020 period than in the 2019 period for all grades. For example, 79% of students switching from 3rd to 4th grade made academic gains between winter 2019 and fall 2019, relative to 57% of students in the same grade range in 2020.
Figure 3: Distribution of Within-student Change from Winter 2019-Fall 2019 vs. Winter 2020-Fall 2020 in Math
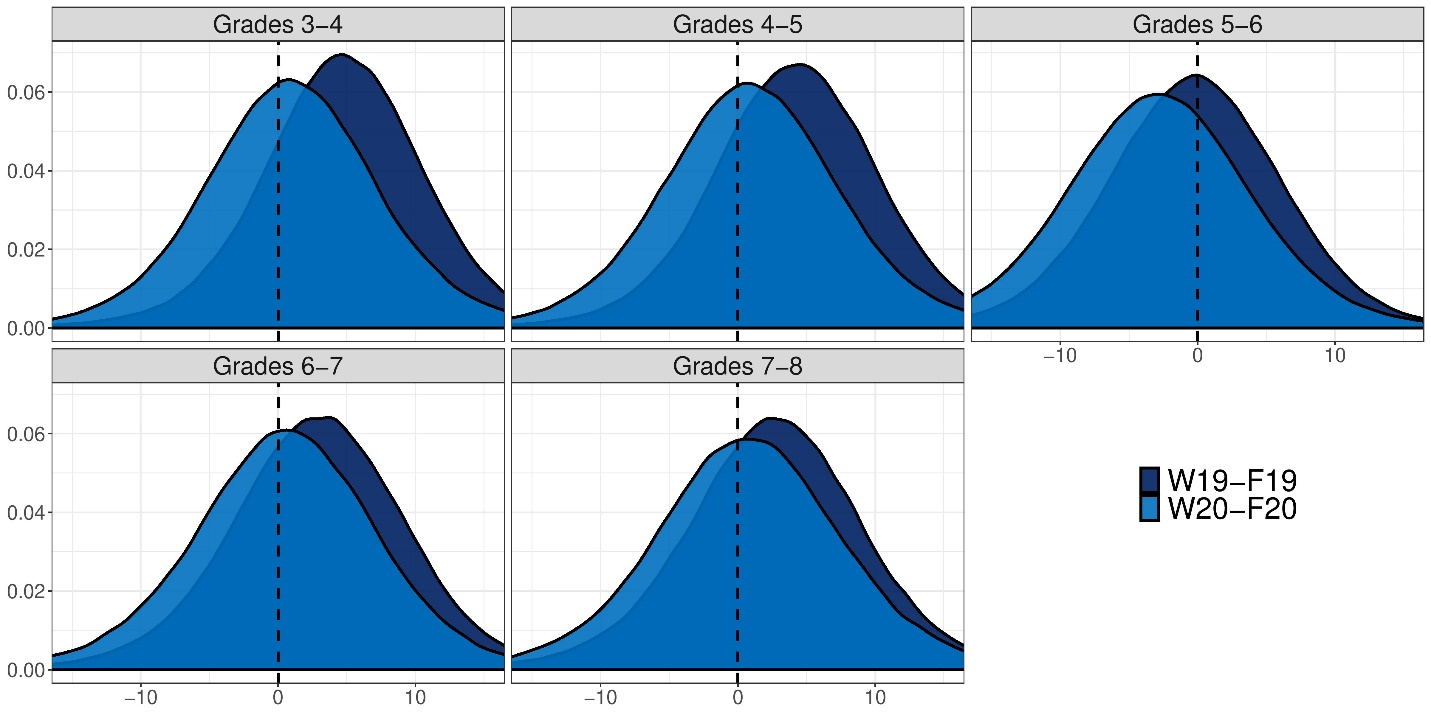
Source: Author calculations with MAP Growth data.
Notes: The dashed line represents zero growth (e.g., winter and fall test scores were equivalent). A positive value indicates that a student scored higher in the fall than their prior winter score; a negative value indicates a student scored lower in the fall than their prior winter score.
It was widely speculated that the COVID-19 pandemic would lead to very unequal opportunities for learning depending on whether students had access to technology and parental support during the school closures, which would result in greater heterogeneity in terms of learning gains/losses in 2020. Notably, however, we do not see evidence that within-student change is more spread out this year relative to the pre-pandemic 2019 distribution.
The long-term effects of COVID-19 are still unknown
In some ways, our findings show an optimistic picture: In reading, on average, the achievement percentiles of students in fall 2020 were similar to those of same-grade students in fall 2019, and in almost all grades, most students made some learning gains since the COVID-19 pandemic started. In math, however, the results tell a less rosy story: Student achievement was lower than the pre-COVID-19 performance by same-grade students in fall 2019, and students showed lower growth in math across grades 3 to 8 relative to peers in the previous, more typical year. Schools will need clear local data to understand if these national trends are reflective of their students. Additional resources and supports should be deployed in math specifically to get students back on track.
In this study, we limited our analyses to a consistent set of schools between fall 2019 and fall 2020. However, approximately one in four students who tested within these schools in fall 2019 are no longer in our sample in fall 2020. This is a sizeable increase from the 15% attrition from fall 2018 to fall 2019. One possible explanation is that some students lacked reliable technology. A second is that they disengaged from school due to economic, health, or other factors. More coordinated efforts are required to establish communication with students who are not attending school or disengaging from instruction to get them back on track, especially our most vulnerable students.
Finally, we are only scratching the surface in quantifying the short-term and long-term academic and non-academic impacts of COVID-19. While more students are back in schools now and educators have more experience with remote instruction than when the pandemic forced schools to close in spring 2020, the collective shock we are experiencing is ongoing. We will continue to examine students’ academic progress throughout the 2020-21 school year to understand how recovery and growth unfold amid an ongoing pandemic.
Thankfully, we know much more about the impact the pandemic has had on student learning than we did even a few months ago. However, that knowledge makes clear that there is work to be done to help many students get back on track in math, and that the long-term ramifications of COVID-19 for student learning—especially among underserved communities—remain unknown.
Related Content
The Brookings Institution is committed to quality, independence, and impact.
We are supported by a diverse array of funders. In line with our values and policies, each Brookings publication represents the sole views of its author(s).