 Could the U.S. save $700 billion in health care spending waste and inefficiency if high-cost states were to emulate the practices of low-cost states? “The conventional wisdom,” says Louise Sheiner, is that “We’d save a lot of money if we would just adopt the practices of the low-cost states. If we could, for example, turn Mississippi into Minnesota, we’d save a lot of money.” Yet, according to Sheiner, a Brookings senior fellow and policy director of the Hutchins Center on Fiscal and Monetary Policy, “geographic variation in health spending does not provide a useful way to examine the inefficiencies of our health system.”
In her new paper for the Brookings Panel on Economic Activity, Sheiner contradicts the widely-held view from the Dartmouth Atlas of Health Care that the variance in health care spending across states is due to “practice styles”—the extent and intensity of medical interventions in a given area. Instead, she finds that the variation is linked to socioeconomic and demographic factors connected to population characteristics.
Unlike in the Dartmouth approach, which takes an individual-level view, Sheiner’s research focuses on the state-level. For example, she writes: “A comparison of health spending in Mississippi with health spending in Minnesota is not likely to provide a useful metric of the ‘inefficiencies’ of the health system in isolation; rather, the difference in spending likely mirrors broader societal problems unrelated to the health system per se.” Relative to Minnesota, Mississippi is a high-health spending, less-healthy state.
Justin Wolfers, co-editor of the Brookings Papers on Economic Activity, explains the paper in this video:
Learn more about the paper, “Why the Geographic Variation in Health Care Spending Can’t Tell Us Much About the Efficiency or Quality of Our Health Care System,” and read more about what she had to say about the paper and research to the Washington Post.
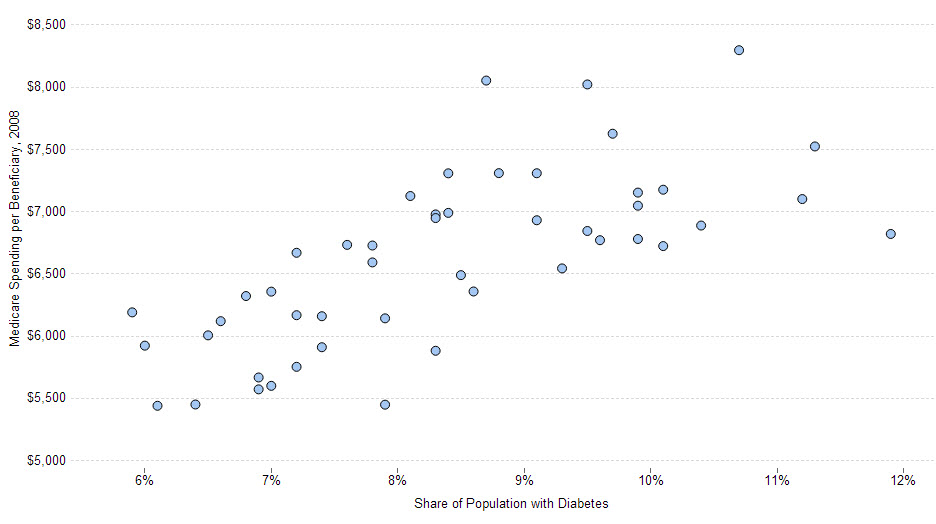
Also, visit this interactive chart, showing the relationship between Medicare spending and health for each state (using the proportion of the state’s population with diabetes as a proxy for general health).
The Brookings Institution is committed to quality, independence, and impact.
We are supported by a diverse array of funders. In line with our values and policies, each Brookings publication represents the sole views of its author(s).


Commentary
Overturning Conventional Wisdom on Health Care Spending
September 15, 2014