“[W]hether our political system will self-correct in the coming years remains an open question,” observes Sarah Binder in her new paper on congressional gridlock, “Polarized We Govern?“
In the paper, Binder identified every policy issue on Congress’s legislative agenda “based on the issues discussed in the unsigned editorials in the New York Times,” regardless of whether the Times favored or opposed action on the issue. She determined for each of these issues, based on news coverage and congressional documents, whether or not Congress and the president took action. “The measurement strategy produced a denominator of every major legislative issue raised by elite observers of Capitol Hill and a numerator that captured Congress’s record in acting on those issues. The resulting gridlock score captures the percentage of agenda items left in limbo at the close of the Congress.”
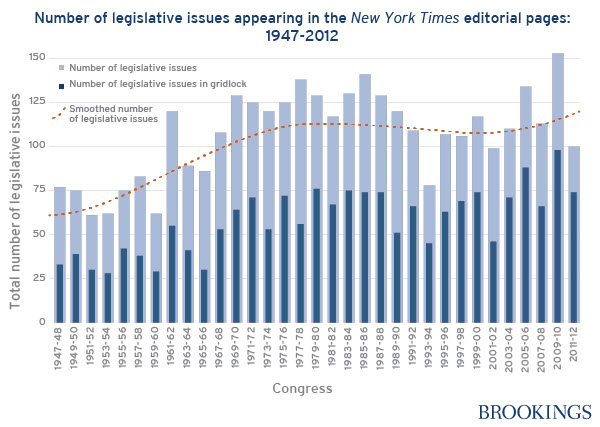
Explaining the above chart, Binder writes:
Looking first at the smoothed trend line in the overall number of legislative issues mentioned each Congress in the Times editorials, the size of the overall agenda increases as expected with the return of large liberal majorities during the mid-1960s and stays at this expanded level through the advent of the civil rights, environmental and women’s movements of the 1970s. Only in recent years do we see a slight increase in the size of the agenda, no doubt reflecting both later efforts to renew the spate of landmark laws of the earlier, activist period and newer issues brought to the fore by the war on terror, global climate change and so on.
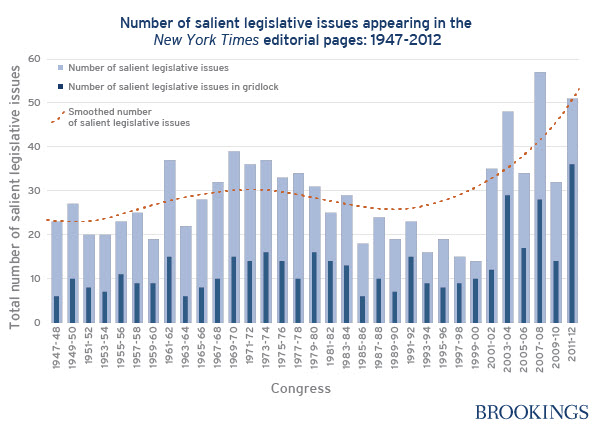
Salient issues are those, in Binder’s methodology, on which the New York Times wrote four or more editorials in a Congress. For the salient issues chart, below, Binder points to the rise in such issues in the 108th (2003-04), the 110th (2005-06), and the 112th (2011-12) Congresses, and explains that “the elite policy agenda has simply grown and become more complicated–not surprising given the introduction of new issues (e.g. the war on terror and homeland security) and more complex ones (e.g. global warming) over the course of the last decade.”
Finally, Binder demonstrates in the chart below the “updated time series of the degree of legislative deadlock on salient issues in each Congress” from 1947 to 2012.
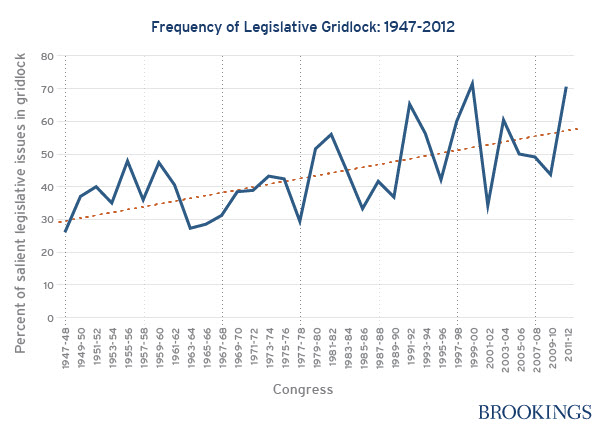
Her conclusions from this chart are: the frequency of deadlock increases over time and that the 112th Congress shares the title for the “worst Congress ever” with the last Congress of the Clinton administration (1999-2000).
Binder writes that “Half-measures, second bests, and just-in-time legislating are the new norm, as electoral, partisan and institutional barriers limit Congress’s capacity for more than lowest common denominator deals.”
Download the paper to get her complete analysis, background and methodology.
The Brookings Institution is committed to quality, independence, and impact.
We are supported by a diverse array of funders. In line with our values and policies, each Brookings publication represents the sole views of its author(s).


Commentary
3 Charts that Capture the Rise in Congressional Gridlock
May 30, 2014