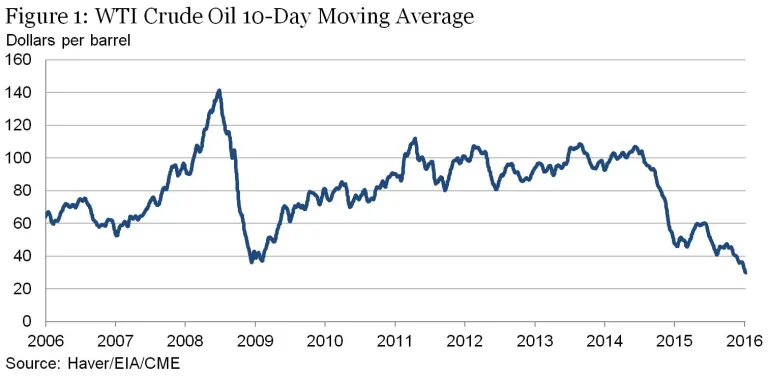
The past decade has been a roller coaster for oil prices, one that market participants have probably not much enjoyed riding (Figure 1). The period includes much volatility and two sharp crashes. One crash, in 2008, was associated with the financial crisis and the Great Recession. The second may still be going on: Oil prices have fallen from over $100 per barrel in mid-2014 to around $30 per barrel recently.
Stock prices have also been falling recently, and these moves have generally followed the course of oil prices, a development much commented on by the financial press (for example, see here and here). On the surface, the tendency for stocks to fall along with oil prices is surprising. The usual presumption is that a decline in oil prices is good news for the economy, at least for net oil importers like the United States and China. [1]
One plausible explanation of the tendency for stocks and oil prices to move together is that both are reacting to a common factor, namely, a softening of global aggregate demand, which hurts both corporate profits and demand for oil. As a recent Wall Street Journal article put it: “Oil and stock markets have moved in lockstep this year, a rare coupling that highlights fears about global economic growth.”
In this post we first confirm the positive correlation between stocks and oil prices, noting that it is not just a recent phenomenon. We then investigate the hypothesis that underlying changes in aggregate demand explain the oil-stocks relationship. We find that an underlying demand factor does account for much of the positive relationship, and that if, in addition, we account for shifts in market risk preferences, we can explain still more. However, even with these two factors included, a significant part of the oil-stocks correlation remains unexplained.
To set the stage, let’s look at the raw correlations of (the percentage changes in) stocks and oil prices. Using daily data, my research assistant Peter Olson and I calculated those correlations for the past five years (Figure 2 below). To capture short-term variations, we estimated correlations using a rolling window of 20 business days.
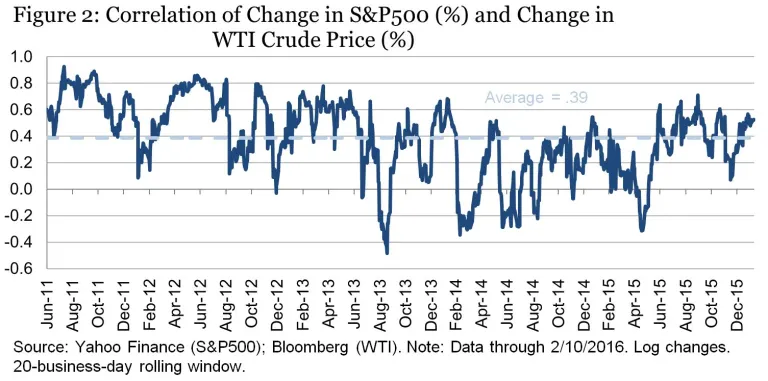
The impression from Figure 2 is that the relationship between stocks and oil is itself volatile, with the correlation between the returns to stocks and to oil swinging between positive and negative values. In other words, sometimes the prices of stocks and oil move in the same direction, sometimes in opposite directions. On average, however, the correlation is positive (stocks and oil move in the same direction). Interestingly, although the correlation has ticked up in the past few months, it has not been unusually high recently, compared to the rest of the five-year sample.
As we mentioned earlier, the positive correlation of stocks and oil might arise because both are responding to underlying shifts in global demand. For a simple test of that hypothesis, we apply a decomposition suggested by James Hamilton, a macroeconomist and expert in oil markets at the University of California-San Diego. In a post from the end of 2014, Hamilton proposed estimating an equation relating changes in oil prices to changes in copper prices, changes in the ten-year Treasury interest rate, and changes in the dollar, then using the value of the oil price predicted by that equation to measure the effect of demand shifts on the oil market. [2] The premise is that commodity prices, long-term interest rates, and the dollar are likely to respond to investors’ perceptions of global and US demand, and not so much to changes in oil supply. For example, when a change in the price of oil is accompanied by a similar change in the price of copper, this method concludes that both are responding primarily to a common global demand factor. While this decomposition is not perfect, it seems reasonable to a first approximation.
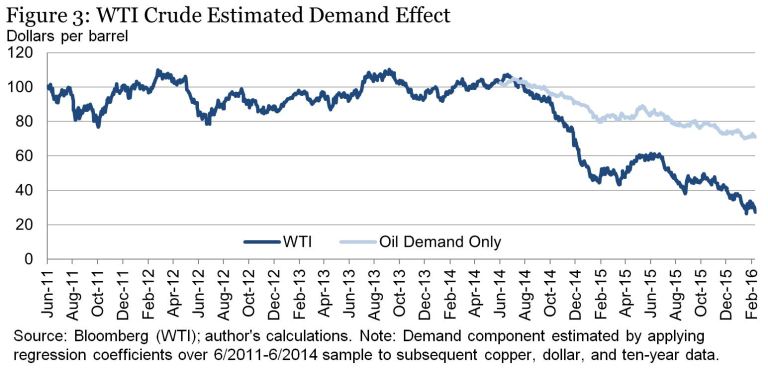
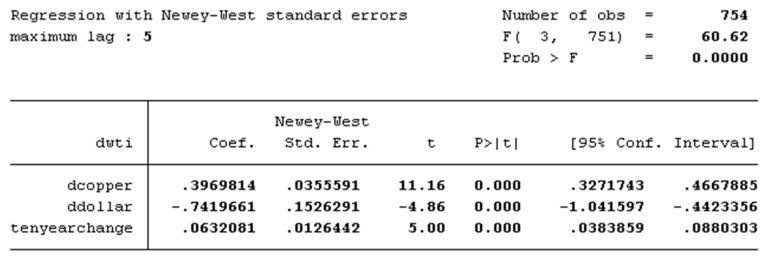
We apply Hamilton’s method, using daily data. For reasons of data availability, we start the sample in mid-2011. Data are in percentage changes (more precisely, log changes), except for the change in the ten-year rate, which is a simple difference. We estimate the equation for data through mid-2014, then use that equation to predict the oil price that would have obtained if the only shocks to the oil market had been on the demand side (the light blue line in Figure 3). The estimated coefficients on all variables (see Appendix 1 at end of post) are highly significant, both economically and statistically.
Comparing the predicted and actual decline in oil prices, we find that something in the range of 40-45 percent of the decline in oil prices since June 2014 can be attributed to unexpectedly weak demand. (This range is very similar to that obtained by Hamilton in a different sample.) The results are not much affected if we drop changes in the value of the dollar from the equation, or if we replace the ten-year Treasury yield with the slope of the yield curve (the difference between the two-year Treasury yield and the ten-year yield).
Using this breakdown, we can also re-examine the correlations of changes in stock prices with changes in oil prices. This time we break the changes in oil prices into the part associated with demand (according to this method) and the residual portion (which presumably includes most supply factors). The correlations of stocks and demand-related changes in oil prices are shown in Figure 4, and the correlations of stocks and the residual are shown in Figure 5.
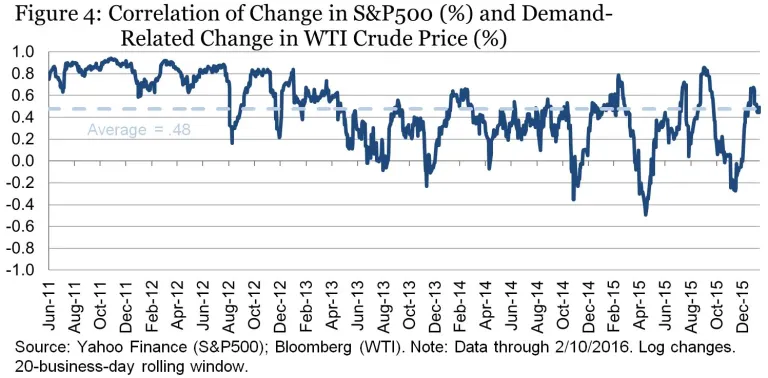
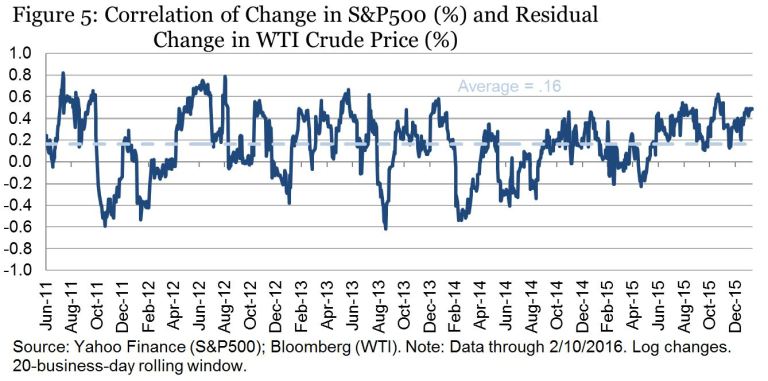
As expected, the correlation between stock prices and the demand component of oil is higher (about 0.48, on average) than the correlation between stock prices and the oil price overall (0.39). Both of these sets of correlations in turn are higher on average than the correlations between stock prices and the residual component of the oil price (which averages about 0.16 in our sample). That’s consistent with the idea that when stock traders respond to a change in oil prices, they do so not necessarily because the oil movement is consequential in itself, but because fluctuations in oil prices serve as indicators of underlying global demand and growth.
On the other hand, since even the residual component of oil prices is positively correlated (on average) with stock prices movements, we have to conclude that the demand explanation (at least, given our admittedly noisy measure of demand) is not the full story.
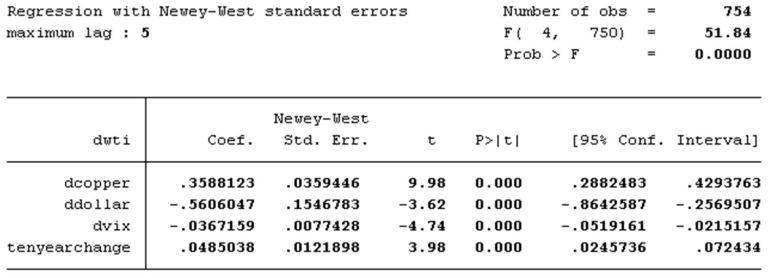
A second possible reason for the positive stocks-oil correlation is based on the observation that recent market moves have been accompanied by elevated volatility. If investors retreat from commodities as well as stocks during periods of high uncertainty and risk aversion, then shocks to volatility may be another reason for the observed tendency of stocks and oil prices to move together. To test whether changes in risk can help explain the oil-stocks relationship, we augmented the Hamilton-style equation for oil prices with daily percentage changes in the VIX, which measures the volatility of stock indexes. [3] The VIX enters the estimated equation with the expected negative sign (oil prices tend to fall when volatility is high) and with high statistical significance (see Appendix 2 at end of post for details).
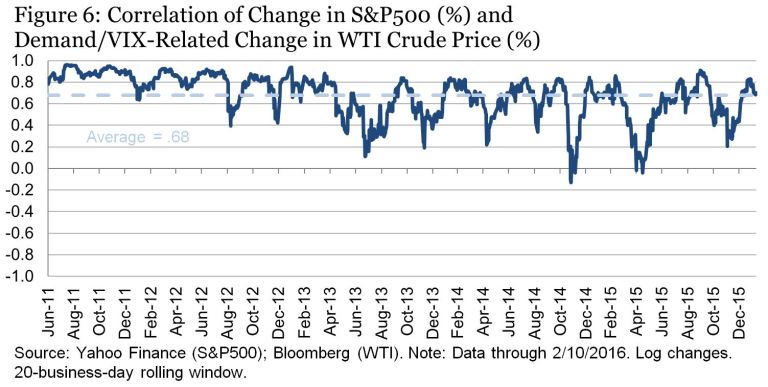
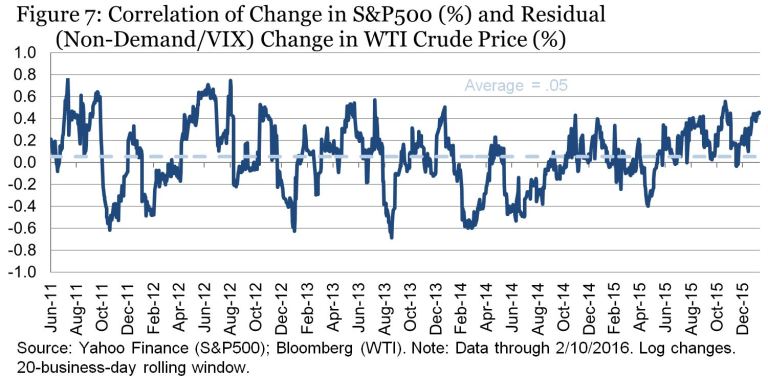
Figures 6 and 7 show the rolling correlations of stock prices with the predicted component of oil (the part associated with both demand and risk) and the residual component, respectively. The average correlation in Figure 6 is 0.68, compared to 0.05 in Figure 7. Accounting for risk does improve our ability to explain why oil prices and stocks tend to move together. However, the correlation of the residual component with stocks is not negative, as would be expected if it reflected only the beneficial effects of supply shocks.
Our bottom line: The tendency of stocks and oil prices to move together is not a new development; it goes back nearly five years (the limits of our sample) and probably more. Much of this positive correlation can be explained by the tendency of stocks and oil prices to react in the same direction to common factors, including changes in aggregate demand and in overall uncertainty and risk aversion. However, even accounting for these factors, the residual correlation is close to zero, not negative as we would expect if it were capturing only beneficial supply shocks. There are several other explanations that could be investigated: for example, the possibility that declines in oil prices, even if initially caused by higher supply, affect global financial conditions by damaging the creditworthiness of oil-producing companies or countries. This topic is one well worth revisiting.
Appendix 1: Regression of log changes in oil prices against log changes in copper prices, log changes in the dollar, and raw changes in the ten-year Treasury yield.
Appendix 2: Regression that adds the log change in the VIX (an index of stock volatility) to the right-hand side.
[1] Energy-related stocks have a larger weight in broad stock indices than energy production does in the economy, which helps explain why stocks might respond adversely to oil price declines, even if those declines are on net good for the economy. However, as we have confirmed, even changes in the transportation subcomponent of the S&P 500, which one would think might especially benefit from cheaper oil, are positively correlated with changes in oil prices.
[2] Sources: Bloomberg/CME (copper); Bloomberg (dollar spot index); Board of Governors via Fred (Ten-year Treasury rates).
[3] Source: WSJ/Haver (VIX).
Comments are now closed for this post.
Related Content


Author

The Brookings Institution is committed to quality, independence, and impact.
We are supported by a diverse array of funders. In line with our values and policies, each Brookings publication represents the sole views of its author(s).


Commentary
The relationship between stocks and oil prices
February 19, 2016