Developing countries are home to roughly 80 percent of the world’s population, 98 percent of humanity’s hungry people, and 78 percent of harvested croplands. Their farming systems have an essential role to play in addressing global food needs, ending extreme poverty, tackling climate change, protecting biodiversity, safeguarding water systems, and many other crucial challenges. But agriculture itself is a complex and vibrant sector, characterized by huge diversity. Therefore analysts and practitioners working on these big picture global issues can all benefit from a basic understanding of what the global distribution of crops actually looks like.
To that end, we recently worked together on a paper, “What does ‘agriculture’ mean today? Assessing old questions with new evidence,” which provides a simple overview of crop types around the developing world. The analysis draws from Food and Agriculture Organization (FAO) data for crops harvested across 140 low- and middle-income countries. Full data tables are also available for download here.
Below we highlight five basic insights:
1. Cereals are central in most (but not all) countries
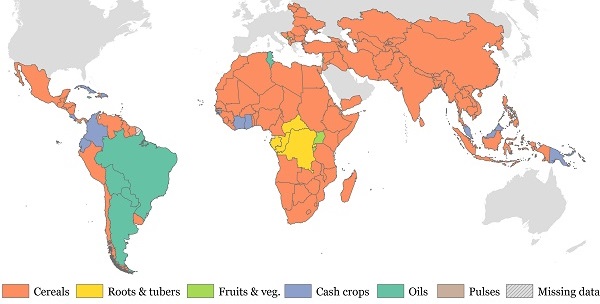
Figure 1 illustrates the extent to which, across developing countries, cereals account for the largest share of area harvested, often the majority. Indeed 59 countries have more than half their cropland harvested to cereals. In some developing regions the category accounts for nearly two-thirds of harvested areas, including 65 percent in Europe and Central Asia and 64 percent in the Middle East and North Africa. However, there is regional variation. Cereals account for only 34 percent of area harvested in Latin America and the Caribbean. In some countries with large agricultural land areas, such as Argentina and Brazil, oil crops like soy are more prominent.
Figure 1: Crop with largest share of area harvested, 2010
Source: Authors’ calculations based on FAO data
2. The type of cereal grown is often tied to geography
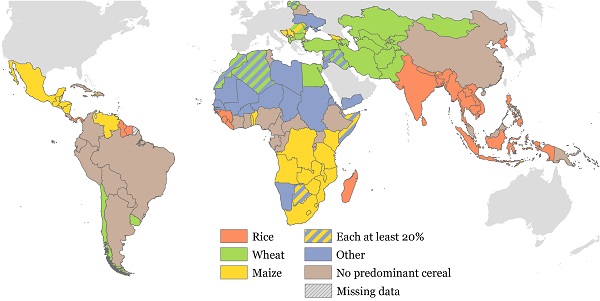
Different plants grow in different places. This is a key reason why patterns of technology diffusion in agriculture are distinct from those in other economic sectors. Figure 2 shows clear geographic patterns for cereal crops. Wheat grows best in temperate environments and is prevalent in parts of Europe and Central Asia, but almost entirely absent in sub-Saharan Africa. Paddy rice flourishes in lowland tropical environments, as are found in much of South and Southeast Asia. Maize can grow in both temperate and tropical areas, although its germinating properties are highly place-specific. It grows commonly in Central America and also Southern and Eastern Africa. In the Sahelian region of Africa, other cereals like millet and sorghum are most prominent.
Figure 2: Predominant Cereal, 2010
(where each accounts for at least 20 percent of area harvested)
Source: Authors’ calculations based on FAO data
3. Only a minority of countries are major cash crop producers
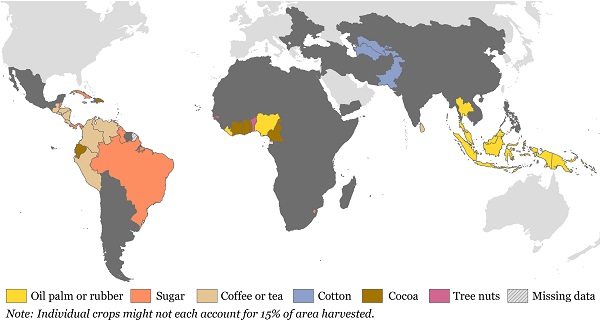
In most developing countries, export-oriented cash crops account for only a small share of area harvested, even if they might account for a larger percentage of agricultural value added. Overall, only 12 percent of the cropland in developing countries is harvested to cash crops. Moreover, cash crops only account for 15 percent or more of the relevant area in 47 out of 140 countries. This includes small island developing states that are less visible in Figure 3. Cash crops are most prominent in the Latin America and Caribbean region, where 20 of 29 countries cross the same 15 percent threshold, driven primarily by sugar, coffee, and cocoa. The corresponding figure in sub-Saharan Africa is only 12 of 46 countries, concentrated in West Africa and the island economies. South East Asia stands out for its high prevalence of cash crops, including Malaysia, where 65 percent of its cropland is used for oil palm. No country in the Middle East and North Africa crosses the 15 percent threshold.
Figure 3: Lead Cash Crop, 2010
(where total cash crops account for at least 15 percent of area harvested)
 Source: Authors’ calculations based on FAO data
4. Cropland area is expanding quickly, particularly in Africa
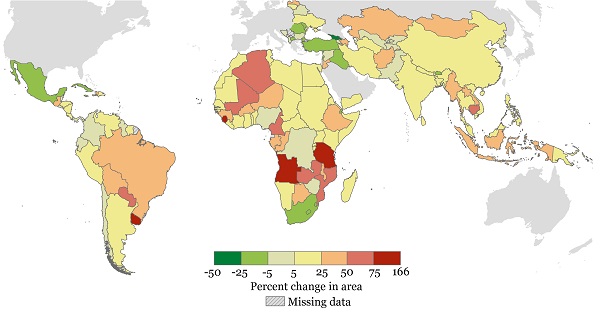
Between 2000 and 2010, the net area harvested across 140 developing countries grew by 14 percent. Twelve countries, including eight in Africa, saw an increase of 50 percent or more. For example, Tanzania saw an extraordinary expansion, increasing its cropland by 6.1 million hectares (ha), or 82 percent. Only four countries saw a greater amount of absolute expansion over the decade: India (16.4 million ha, 9 percent), Brazil (16 million ha, 31 percent), China (11.4 million ha, 7 percent), and Indonesia (8.2 million ha, 26 percent). However, not all countries expanded, and 35 countries saw a contraction in area harvested over the same period. This included three countries with declines of more than 1,000,000 ha each: Mexico, South Africa, and Turkey.
Figure 4: Percent change in area harvested, 2000 to 2010
Source: Authors’ calculations based on FAO data
5. Crop mixes are generally stable, even when crop area is increasing
Between 2000 and 2010, most developing countries saw only modest shifts in the share of land area harvested to each crop category. Even among the five countries mentioned above with the greatest amount of area expansion, none of them saw any category of crops change by more than 10 percentage points. In Indonesia, for example, there was a shift away from cereals (-5 percentage points) and oils (-3) alongside growth in cash crops (+10). Meanwhile India saw a relative decline in cereals (-6) accompanied by balanced expansion in oils (+1), pulses (+2), fruits and vegetables (+2), and cash crops (+1). Conversely, Tanzania’s growth was slightly weighted toward cereals (+8) and somewhat evenly away from the other crop categories.
South America offers a notable exception to general stability across crop shares. Between 2000 and 2010, Argentina, Brazil, and Uruguay all experienced rapid increases in the share of land harvested to oils, particularly soybeans, and declines in area for cereals. In Uruguay, land for soybeans grew from only 1 percent of area harvested in 2000 to a whopping 42 percent by 2010. Meanwhile, soybeans grew from 35 to 56 percent share in Argentina and from 26 to 34 percent share in Brazil.
The future of agriculture
These quick facts offer a brief overview of agriculture’s diversity across the developing world. They also underscore the complex nature of ongoing agricultural change. Harvested areas and crop mixes are continuing to evolve in distinct patterns around the globe. As the world confronts a new generation of economic, social, and environmental challenges, we must pay close attention to the shifting contours of where food actually grows.
The Brookings Institution is committed to quality, independence, and impact.
We are supported by a diverse array of funders. In line with our values and policies, each Brookings publication represents the sole views of its author(s).


Commentary
Where does the world’s food grow?
March 21, 2016