This chapter is part of USMCA Forward 2026.
Introduction
Developments over the past year have made the USMCA more central to the international trade and manufacturing of the three North American economies, reinforcing the stakes for the 2026 USMCA review.
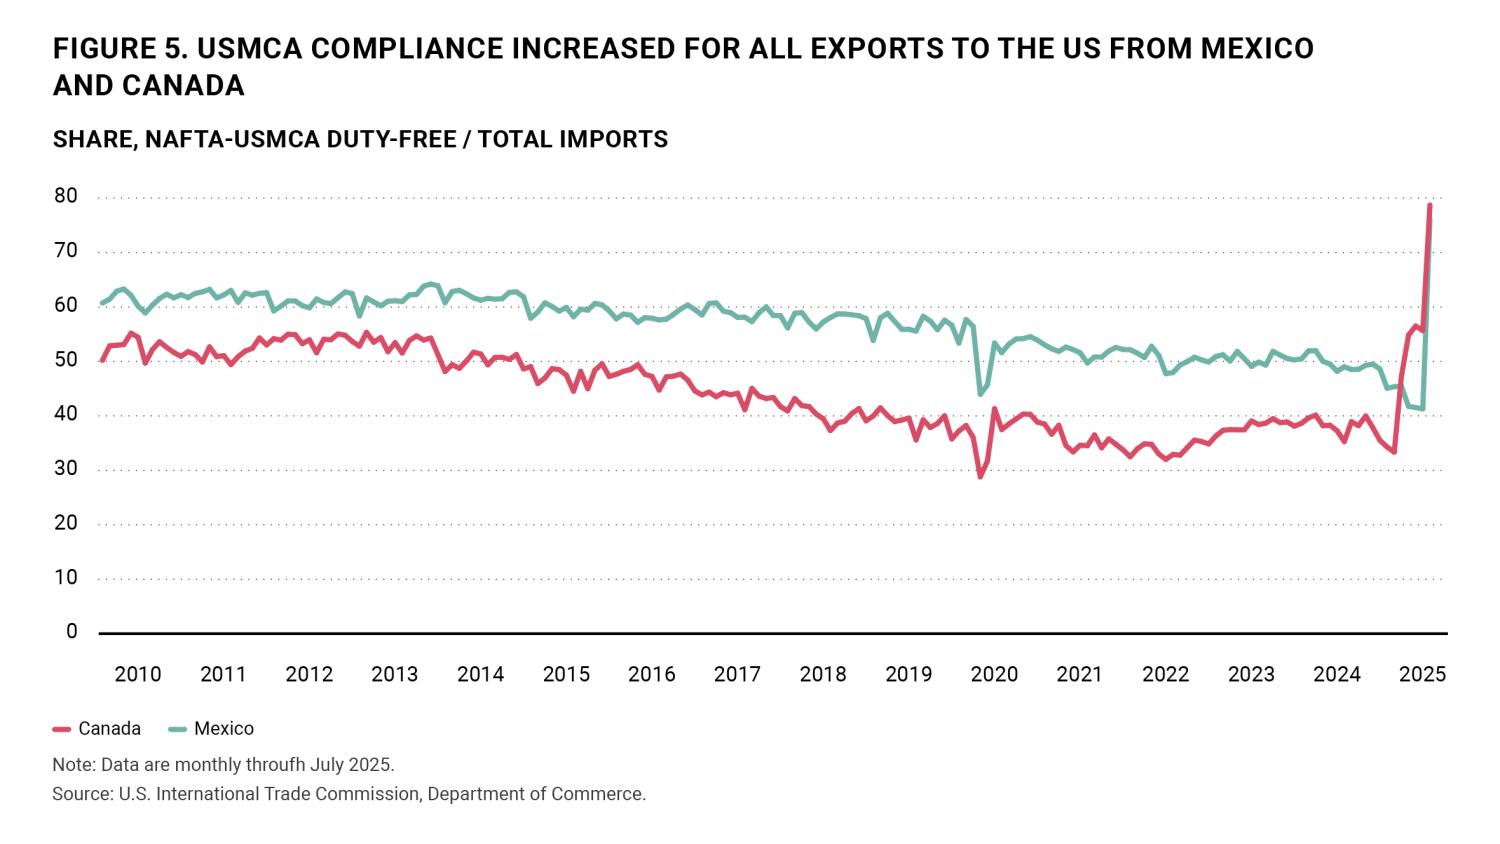
The USMCA compliance of Mexican and Canadian exports to the U.S. rose substantially in 2025—from less than one-half to almost 80% of trade value—as higher U.S. tariff rates for non-USMCA goods incentivized greater use of the trade agreement.1 Mexico continues to grow its lead as the top source of imports into the U.S., with Canada ranking second. And in 2025, Mexico closed in on Canada as the United States’ top export market.
As U.S. direct imports from China continue to fall, this has increased attention on trade diversion of these Chinese exports and transshipment through third countries to the U.S. Such diversion or transshipment were not apparent in Mexico and Canada in 2025 trade data, however, with both countries also raising tariffs on select goods from China—and China’s export growth was directed to other regions.
Uncertainty around the future of the USMCA contributed to subdued investment in Canada2 and Mexico3, with manufacturing employment also weak on both sides of the U.S.-Mexico border in 2025. An enduring theme, however, is the continued growth and diversification of Mexican manufacturing. Analysis of the latest value-added trade data underscore the strong integration of North American manufacturing. This growth and integration increasingly apply to industries beyond the auto sector, such as computers and electronics and medical devices. As mandated wage increases in Mexico have made some labor-intensive manufacturing less competitive, growth in higher value-added manufacturing areas point to one way in which USMCA may evolve.
Mexico solidifies role as principal US trading partner
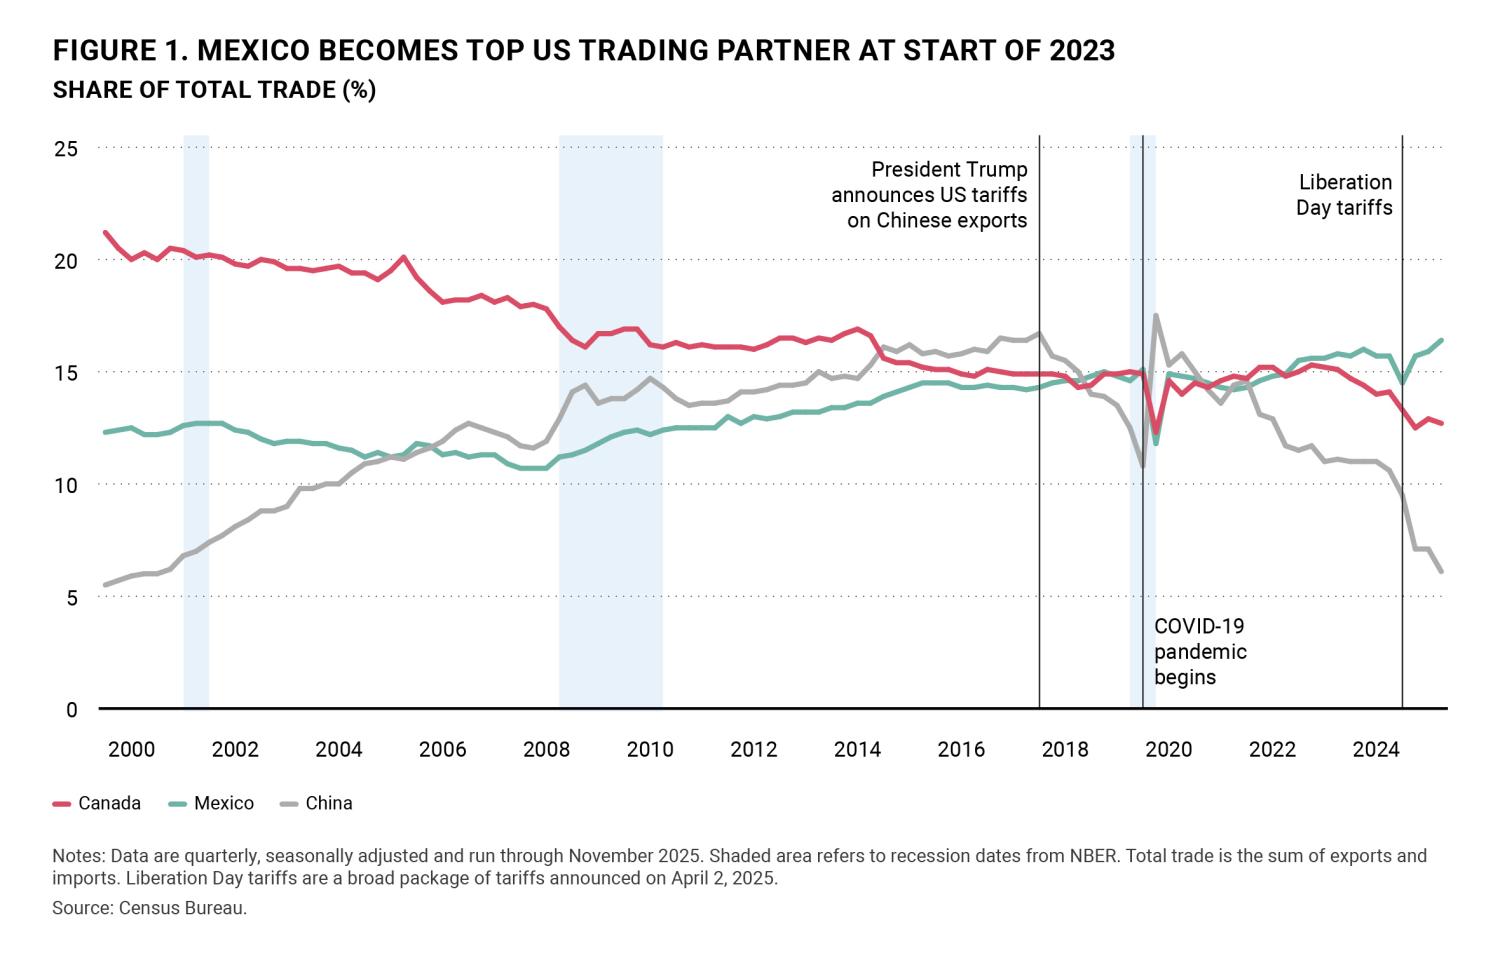
Mexico became the top U.S. trading partner at the beginning of 2023, with total bilateral trade totaling $873 billion in 2025. Canada is the U.S.’ second-largest trading partner, with $719 billion worth of trade during the same period. Both countries have surpassed China, which fell to third place, recording $419 billion of trade with the U.S.4 In 2025, Mexico–U.S. trade represented 15.6% of all the goods exported and imported by the U.S.; the Canada–U.S. share followed at 12.8%, and with the China–U.S. share slumping to 7.5% (Figure 1).
While Mexico has been the United States’ largest source of imports since 2023, in 2025 Mexico was very close behind Canada as the United States’ top export market. Together, Mexico and Canada absorb roughly one-third of U.S. goods exports—reinforcing the importance of North American markets and the USMCA for U.S. exporters.
Mexico’s emergence as the U.S.’ top trading partner followed, increasing U.S. trade tensions with China during the first Trump administration, prior to which China had moved past Canada to claim the top trading spot in 2014. The shift in U.S. trade back towards North America and away from China was reinforced by pandemic global supply chain disruptions that incentivized companies to build resiliency by moving operations closer to home.
Manufacturing drives rise in US-Mexico trade
Mexico’s gains in U.S. import share have been driven by manufacturing as Mexico’s expanding manufacturing base has offered an alternative to producing in China.5 Sourcing or producing goods in a nearby country is sometimes referred to as “nearshoring.” While data on nearshoring-based new foreign investment is thin and evidence is mainly anecdotal,6 there has been a reinvestment of earnings by already established enterprises leading to an expansion of existing operations. The increased U.S. protectionism and related industrial policy are consistent with less global trade, more regional trade, nearshoring, and reshoring (the return of production to the home country).
Total trade of manufactured goods between Mexico and the U.S. reached $791 billion in 2025. Canada and China were second and third, with $524 billion and $387 billion, respectively, in manufacturing trade, with the U.S. bilateral manufacturing trade between Mexico and the U.S. accounting for 16.6% of all U.S. manufacturing trade; the Canada–U.S. share followed at 11.0%, and then the China–U.S. share at 8.1%.7
Growing US-Mexico trade in computing equipment and electronics
While the motor vehicles sector continues to dominate U.S.-Mexico trade, accounting for 40% of U.S. goods imports from Mexico, more notable is the rapid rise in U.S. imports of Advanced Technology Products (ATPs) from Mexico, as measured by the U.S. Census Bureau (Figure 2).8

Mexico eclipsed China as the United States’ principal source of ATPs in 2025. With these advanced technology sectors including many of the most sensitive products in focus for U.S. economic and national security, this data points to the role and potential for further integration and complementarity of the North American manufacturing sector as U.S. “de-risking” from China proceeds.
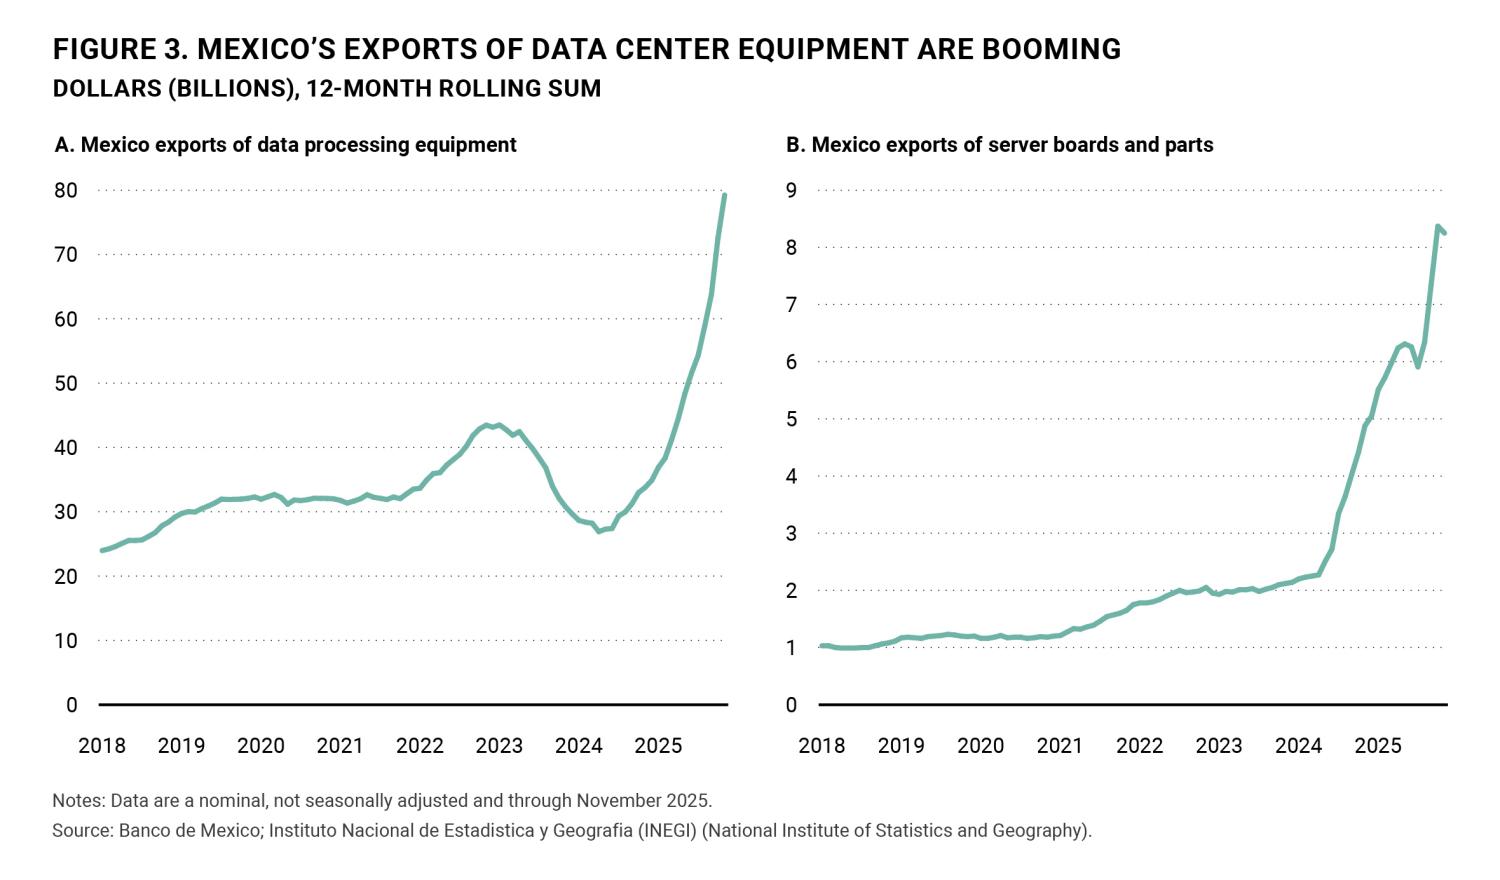
This trend has been particularly apparent in data servers and related equipment at the heart of the U.S. artificial intelligence (AI) data center buildout. Mexico’s overall exports of automatic data processing machines (HS code 8471), particularly data servers, motherboards and components for data centers, have more than doubled over the past year, exceeding $79 billion in the 12 months ended in November 2025 (Figure 3A). Mexico’s exports of server boards and other parts for data servers (HS code 8473) are growing even faster (Figure 3B).
Mexico has also seen steady, if less rapid, growth in medical device exports, rising from $9.0 billion in 2017, to $20.6 billion over the 12 months ended in November 2025. U.S. imports of advanced technology products from Canada rose more modestly, reaching $22.1 billion over the 12 months ended in November 2025. Aerospace products accounted for almost two-thirds of these imports, at $13.7 billion.9
Mexico’s integration into global value chains
Mexico’s manufacturing trade with the U.S.,10 including ATPs, is part of global value chains in which intermediate goods are produced and traded between multiple countries before reaching the final U.S. consumer.11
Measuring value added is the best way to estimate each country’s contribution to exported goods, since it accounts for inputs or previous production stages occurring outside its borders12. Estimating Mexico’s export value added allows assessment of the economic integration in North America and the degree of specialization in the region, as well as the extent to which goods from outside North America contribute to the region’s trade.
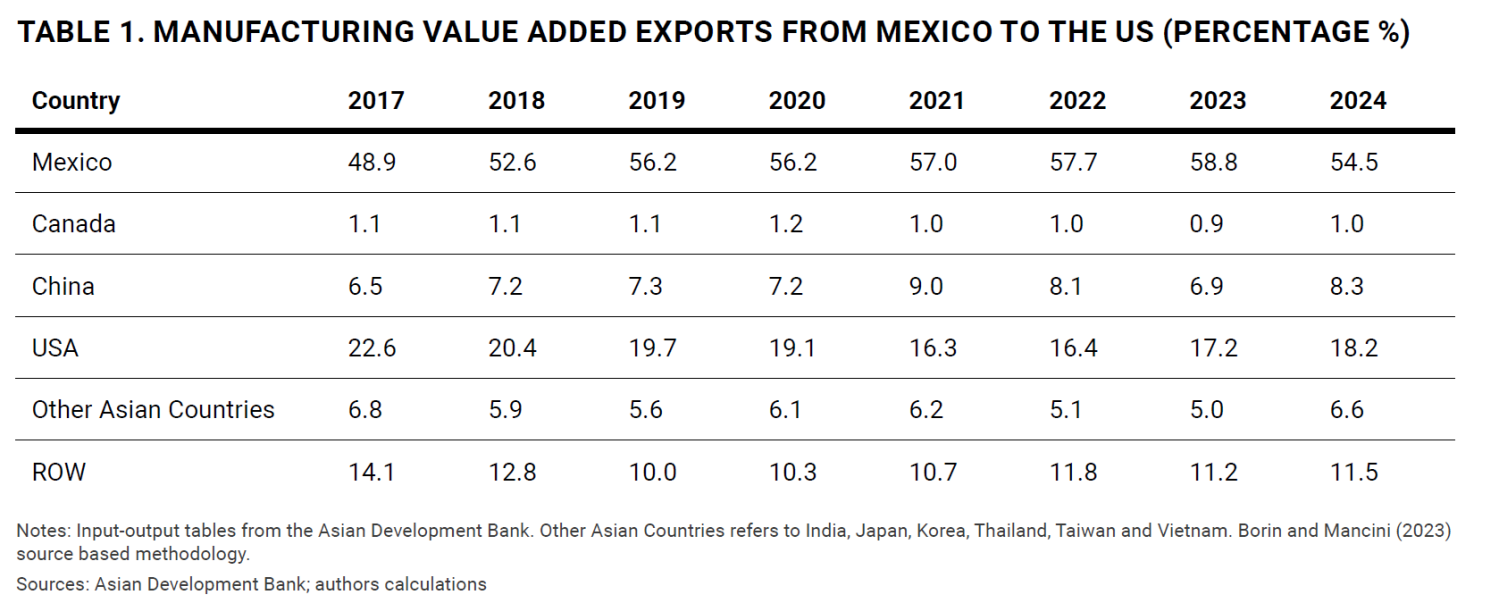
USMCA country partners’ value added in Mexican manufacturing exports to the U.S. increased modestly from 72.6% in 2017 to 73.7% in 2024, meaning that almost 74 cents of each dollar of manufactured goods exported to the U.S. from Mexico comes from North America (Table 1). The numbers reflect the strong intra-industry trade linkages in manufactured goods between the U.S. and Mexico, which are stronger than those with other countries. Mexican value added represents the majority share and has increased over this period, showing the movement of manufacturing activity towards Mexico due to the U.S.-China tariffs and post-pandemic supply chain shift. Also, the tariffs and supply chain changes have increased the participation of Chinese value added at the cost of U.S. being further spurred by the rise of trade in computer and electronics.
The shift in U.S. trade policy and supply chain resilience led to a sharper increase in Mexican value added in the transportation sector, given the particularly deep manufacturing integration between the U.S., Mexico, and Canada, with almost 77 cents of each dollar exported from Mexico to the U.S. originating inside of North America (Table 2). The changes in tariffs and supply chains also led to a decrease in U.S. value added and increase in Chinese value added.
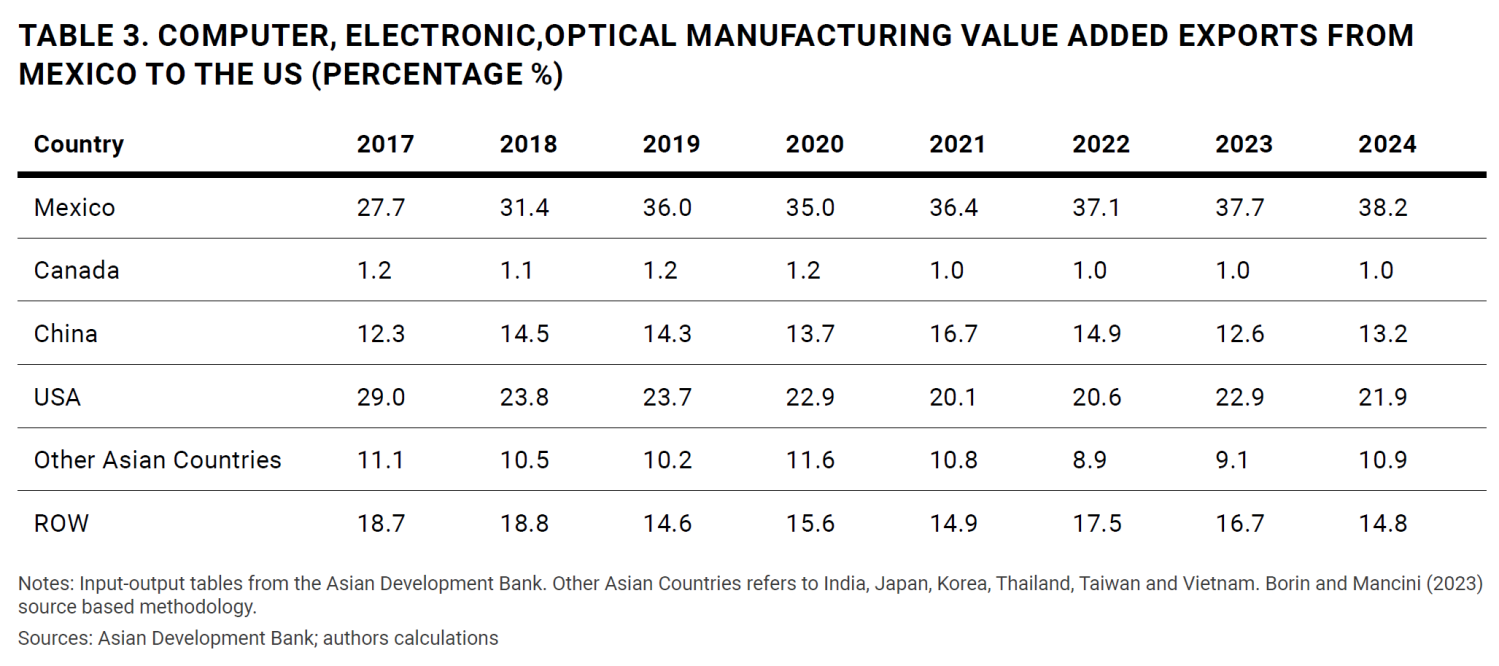
The differences in value chain linkages can be seen in the value added heterogeneity across sectors, such as in Mexican exports of computer and electronics goods to the U.S. The share of U.S. value added is higher than that in other sectors, 22.9% in 2023, indicating greater use of U.S. inputs (Table 3).
Value added contribution from outside of North America—particularly East Asia—is higher than in other manufacturing sectors. However, Mexican value added has steadily increased, signaling an increase in manufacturing operations in Mexico in these sectors.
Data on intra-industry trade between the U.S. and Mexico also highlight the close integration of manufacturing production between the two countries. This is observed by the fact that Mexico and the U.S. are exporting and importing the same types of products. For example, the No. 1 U.S. export to Mexico, computer, and electronic products (21% share), is also the No. 2 U.S. import from Mexico (26% share). The No.2 U.S. export to Mexico, transportation equipment (13% share), is the No.1 U.S. import from Mexico (30% share) (Table 4).
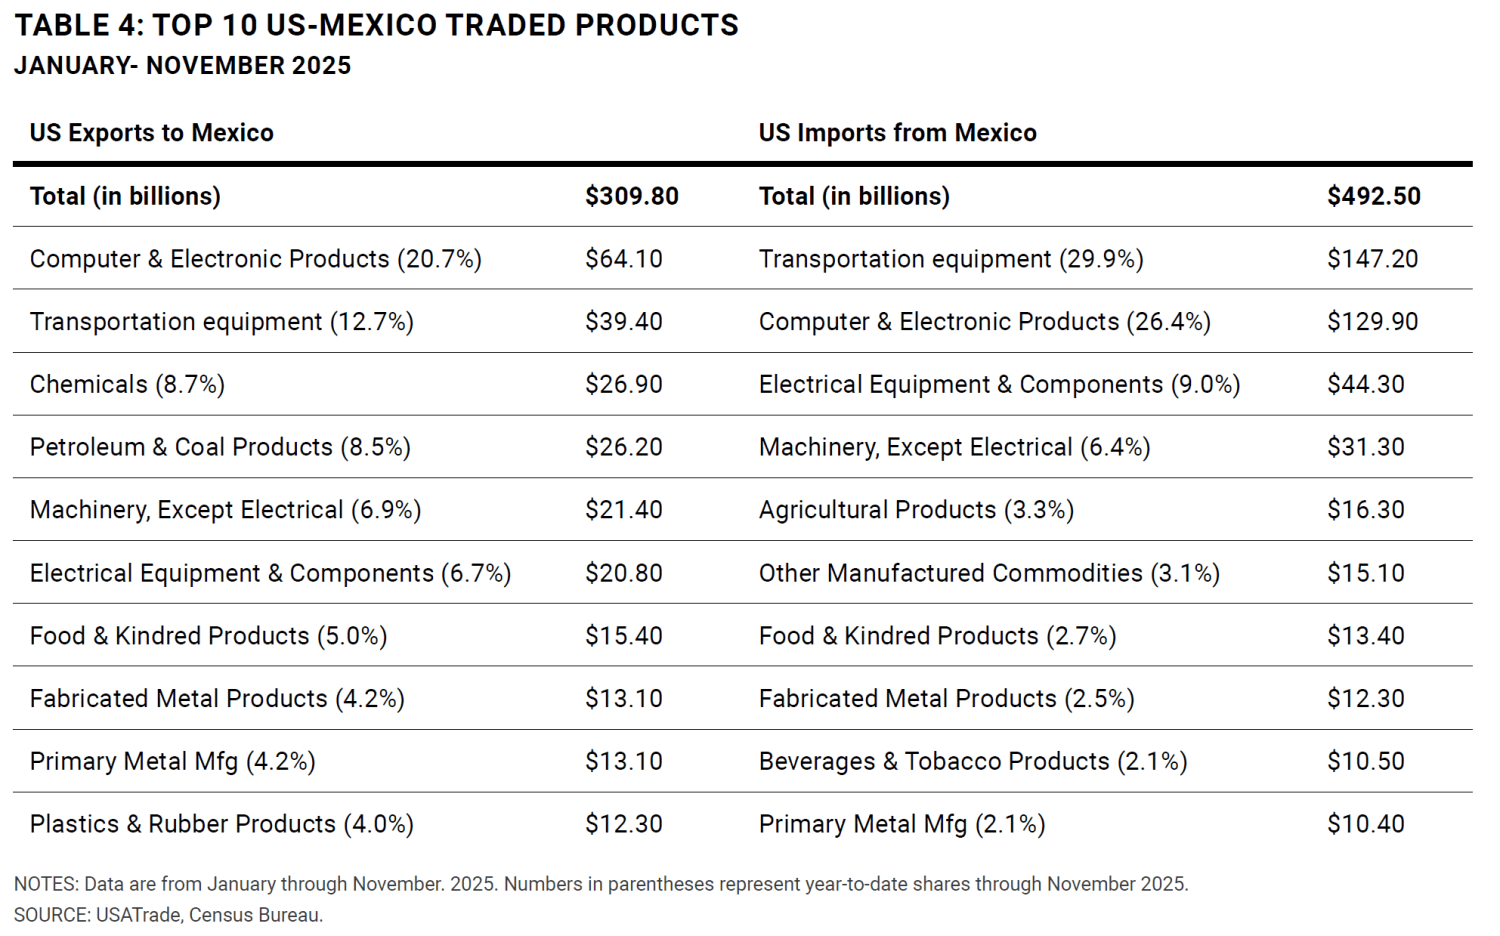
Intra-industry trade or “production sharing” allows both countries to trade the same goods at different stages of the production process, utilizing their comparative advantage, which is relatively capital-intensive production for the U.S. and labor-intensive for Mexico. Thus, the manufacturing process is efficient, allowing the region to consume at the lowest possible prices domestically while remaining competitive outside North America.
Some limited evidence of tariff circumvention, though little sign of new trade diversion in 2025
Some attention has focused on the growth of Mexico’s imports from China, including of intermediate goods, as a form of circumvention of the U.S. 2018-2019 tariffs on China. Circumvention is commonly viewed as arising when there is a change in the pattern of trade by businesses for the purpose of avoiding the payment of duties. A Brookings analysis found some circumvention occurring via Mexico, but at low level, and little evidence of circumvention through Canada.13 Increased China-Mexico trade has played a relatively modest role in Mexico’s export growth to the U.S., however, with the value-added data highlighting increased domestic content in Mexico’s exports.14
Another key issue is the redirection of Chinese exports to other markets following U.S. imposition of additional tariffs on China in 2025. With China’s overall exports continuing to grow rapidly, yet its exports to the U.S. declining a further 20% in 2025, a key question has been which countries will absorb this Chinese export surge.15 The U.S. government has also focused on potential transshipment of Chinese goods and content through third countries to the U.S.
China’s exports have shifted most notably to developing economies, continuing a recent trend—increasing 13.4% to the Association of Southeast Asian Nations (ASEAN) bloc and 25.83% to Africa. Among developed economies, the European Union has played the biggest role in absorbing China’s export surge, with China’s exports to the EU rising 8.4% in 2025 (Figure 4).
Thus far, there is little sign in the aggregate trade data of Chinese exports being redirected to the rest of North America, either for “transshipment” to the U.S. or as end markets. China’s exports to Mexico actually fell 1.2% in 2025 based on China customs data—after a steady rise over the past several years. China’ exports to Canada increased 3.2% in 2025, below China’s overall export growth of 5.5%.

Canada and Mexico have also imposed tariffs on China, which may be playing a role.16 In 2024, Canada became the first economy to emulate U.S. tariffs on electric vehicles (EVs),17 steel, and aluminum from China18—adding to these in 2025 to address trade diversion concerns and proposed additional tariffs that have not yet been implemented.19 Mexico has steadily raised tariffs over the past two years on non-free trade agreement partners, including China, and approved significant additional tariffs in December 2025, taking effect at the start of 2026, ahead of the scheduled review of the USMCA.20 Mexico’s latest measures increased tariffs by around 35% on the imports of auto parts, textiles, clothing, plastics, and steel, and 50% on autos, from non-free trade agreement partners, including China, India, South Korea, Thailand, and Indonesia.21
USMCA trade rose following 2025 US trade policy shift
U.S. trade policy changed significantly in 2025. The average effective tariff rate for imports increased from 2.4% in 2024 to 16.9% in January 2026.22 For Mexico and Canada, the average effective tariff rate increased to 12.8% and 8.1%, respectively. Goods from China are facing a much higher average effective tariff rate of 37%.23
One key impact of these changes is that the use of the USMCA has increased considerably as firms look to avoid U.S. tariffs imposed on goods from Mexico and Canada that do not meet the rules of origin of the trade agreement as most products traded under the USMCA remain tariff-free. Tariffs on non-USMCA imports from Mexico are currently around 25%,24 while Canada faces 35% tariffs on non-USMCA goods.25 A 25% tariff has been applied on passenger vehicles and light trucks from Canada and Mexico, while automotive parts qualifying for USMCA preferential treatment were granted a temporary exemption from the 25% tariff.26 If a vehicle is USMCA compliant (meeting 75% regional value content, 70% steel/aluminum, etc.), the 25% tariff applies only to the value of the non-U.S. content.
USMCA compliance on all Mexican goods imported increased from 49.5% in December of 2024 to 76.1% in July of 2025 (Figure 5), while for all Canadian goods imported, compliance went from 35.5% to 78.7% during the same period.
In manufactured goods, compliance for Mexican-manufactured imported goods rose to 71.7% in July of 2025, and for Canadian goods to 48.9%. The increase in USMCA compliance can be observed across manufacturing industries except for transportation equipment, which has registered a decline due to the sector-specific U.S. tariffs on automobiles of 25% on non-U.S. content of USMCA compliant imports, and of 50% on the steel and aluminum content of imports.27
The automotive industry is facing a multitude of challenges from the tariffs and related supply chain concerns that have led to higher costs, fragmenting supply networks, and uncertainty. In addition, the transportation sector faces additional compliance costs to meet increasing complex trade regulations and reporting requirements. The transportation industry is Mexico’s leading industry representing 40% of total trade with the U.S.
Tariff uncertainty has restrained investment in Mexico, amid nascent pickup
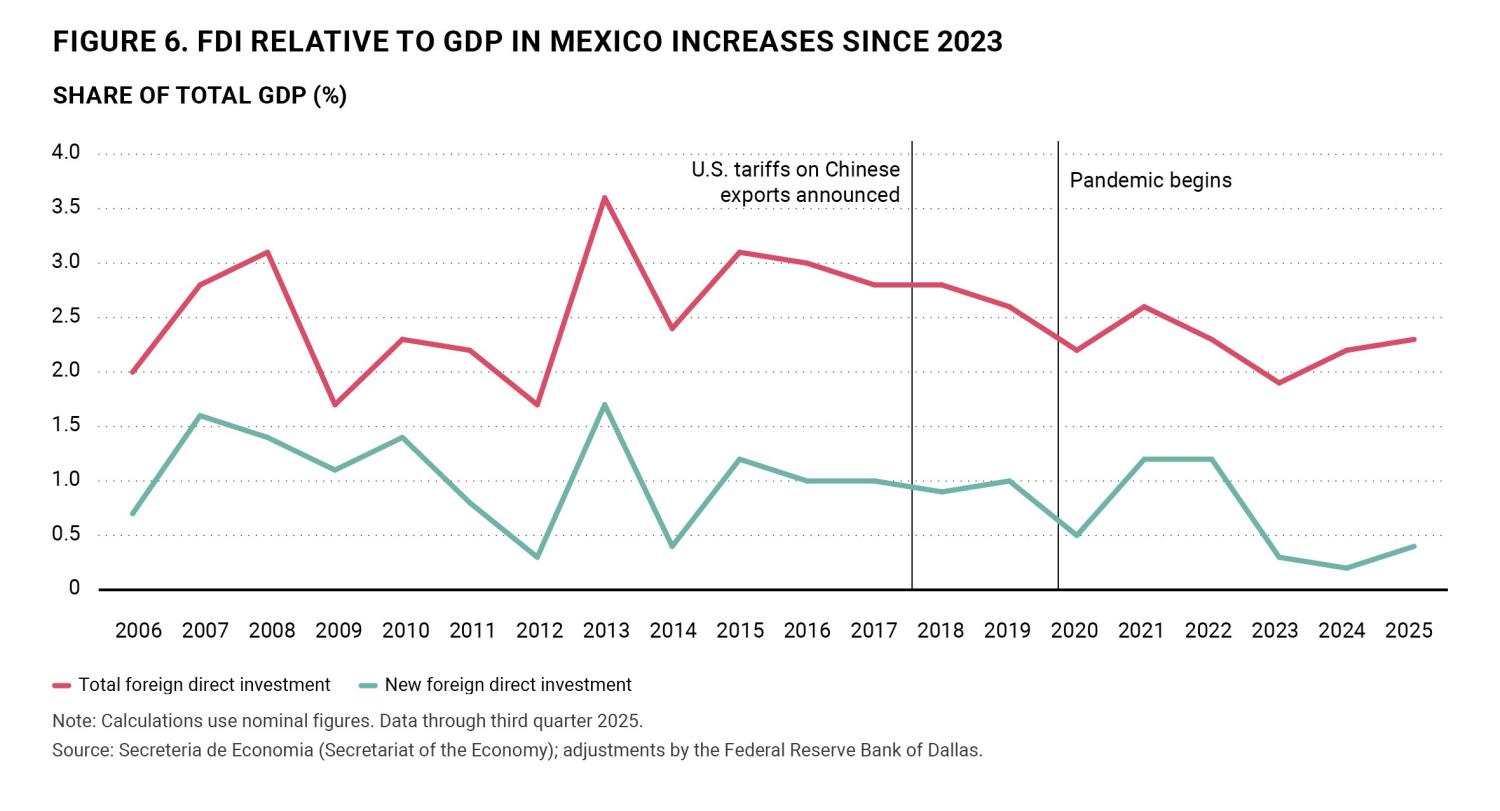
Foreign direct investment (FDI) into Mexico has been relatively weak28 the past few years amid political uncertainty and questions surrounding the future of the USMCA.29 FDI relative to Mexico’s GDP increased in 2025 after reaching a trough in 2024. However, the 2025 pickup in FDI was mainly due to the reinvestment of profits as new FDI remains subdued (Figure 6).
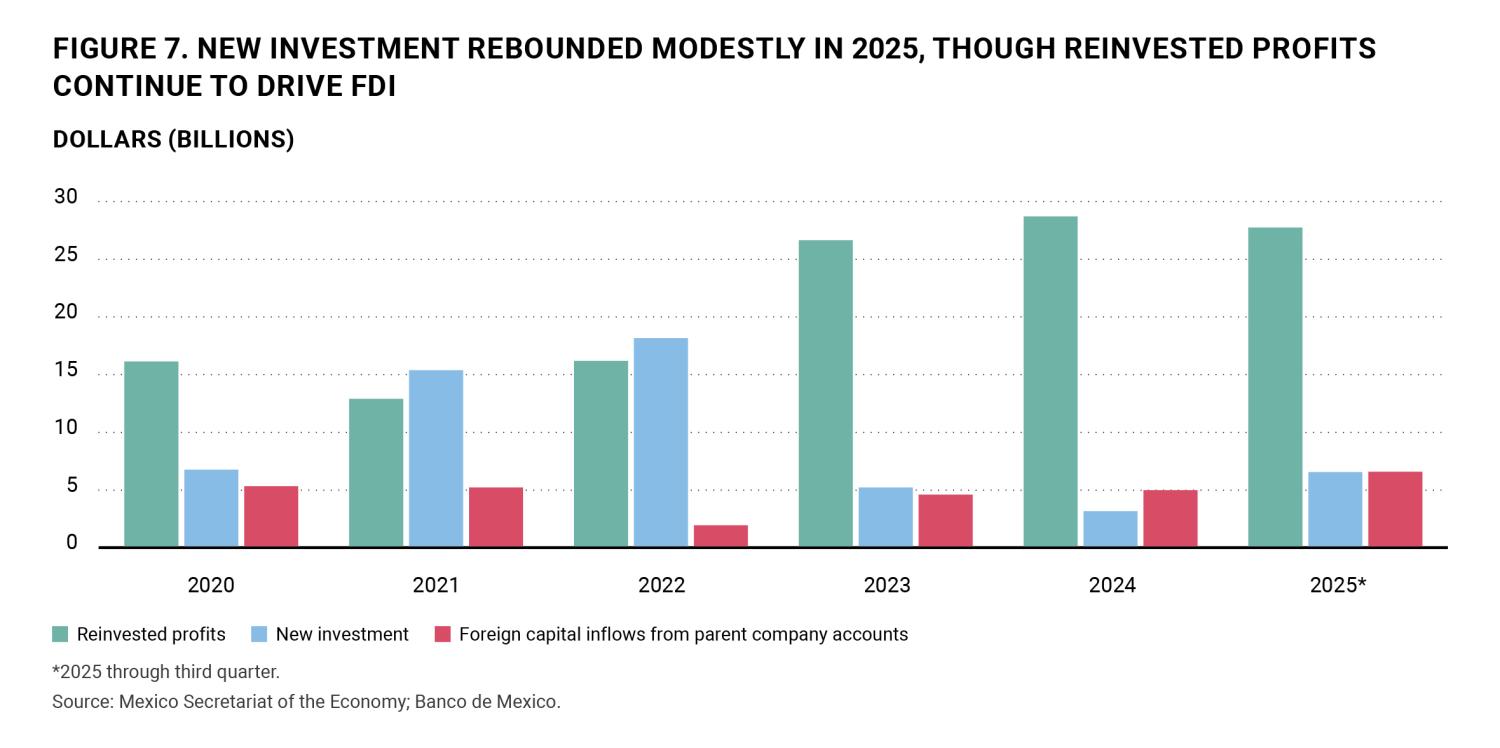
Mexico experienced a moderate increase in new investment in 2021 to 2022, following the 2018 to 2019 U.S.-China trade war and USMCA taking effect in 2020. Since then, most activity has involved reinvested profits (brownfield investment), with relatively little new (greenfield) investment—the building of new production facilities (Figure 7).
Overall FDI reached $40.9 billion over the first three quarters of 2025, a 14.5% increase from the full-year 2024 level. Significantly, Mexico has seen modest recovery in new investment to $6.6 billion in the 2025 period—a tentative indication of renewed momentum for nearshoring, though still well below average 2015 to 2022 levels of $13 billion.30
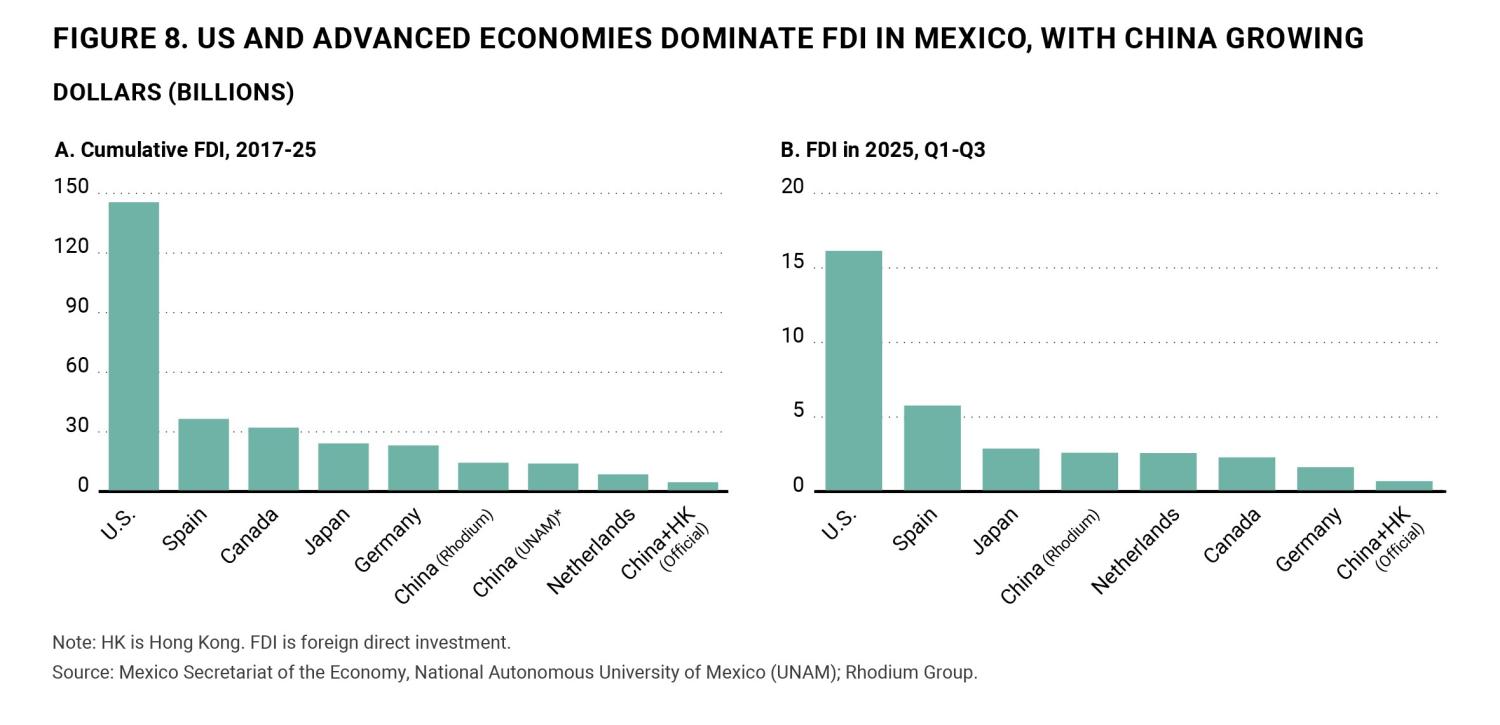
The U.S. remains by far Mexico’s largest source of FDI, totaling over $145 billion since 2017, more than 45% of total FDI during this period. Spain was the second largest investor over the period, with $36.5 billion in net FDI. Reinforcing the strong USMCA economic ties, Canada has been the third largest investor, at $32 billion.
Investment from China—and how accurately it has been measured—has attracted significant attention.31 China has been the fastest growing source of investment into Mexico in recent years from a low level. Cumulatively, Mexico received $2.9 billion in net FDI from China from 2017 to 2025, according to Mexican government statistics.32 This amount rises to $4.6 billion when including Hong Kong, a special administrative region of China.
Alternate sources estimate Chinese FDI in Mexico to be considerably larger than official figures show—in part due to different methodologies.33 However, even if relying on the higher alternate estimates, FDI from China into Mexico significantly trails that of the U.S. and also that of Canada, Spain, Japan, and Germany (Figure 8). Chinese FDI has been weighted heavily (almost two-thirds) towards new investment, which could partly explain the relatively high visibility and media attention on Chinese investment in Mexico.
The U.S. remained the largest source of FDI in 2025, at $16.5 billion, 38% of this manufacturing and 32% in financial services. Spain was second at $5.8 billion, mostly in financial services, with Japan third at $2.9 billion, nearly all in manufacturing. Steady investment from China appears to have continued, with Rhodium estimating $2.6 billion in completed transactions in 2025,34 particularly in the auto parts sector, even as some Chinese investors are reportedly becoming more cautious about Mexico, given increased U.S. and Mexican government skepticism toward Chinese investments.35
In the tariff environment Mexican manufacturing production rises but employment falls below 2018 levels
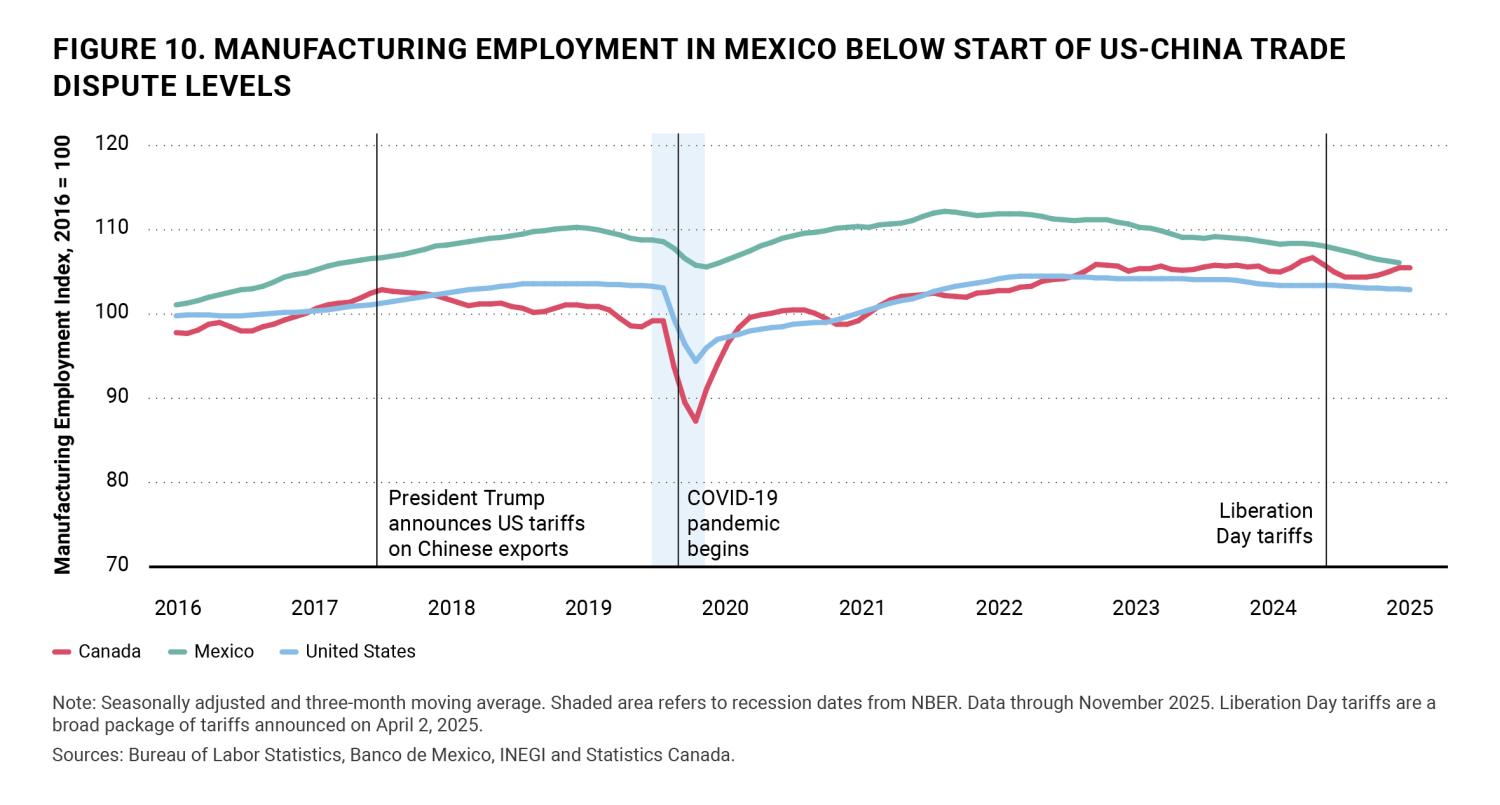
After the start of the U.S.-China trade dispute in 2018, manufacturing activity increased in all three USMCA countries, peaking in 2019 and subsequently slowing before the pandemic. All three recorded a post-pandemic rebound, but the U.S. and Canada never returned to pre-pandemic levels. Mexico’s manufacturing activity exceeded post-pandemic levels (Figure 9).
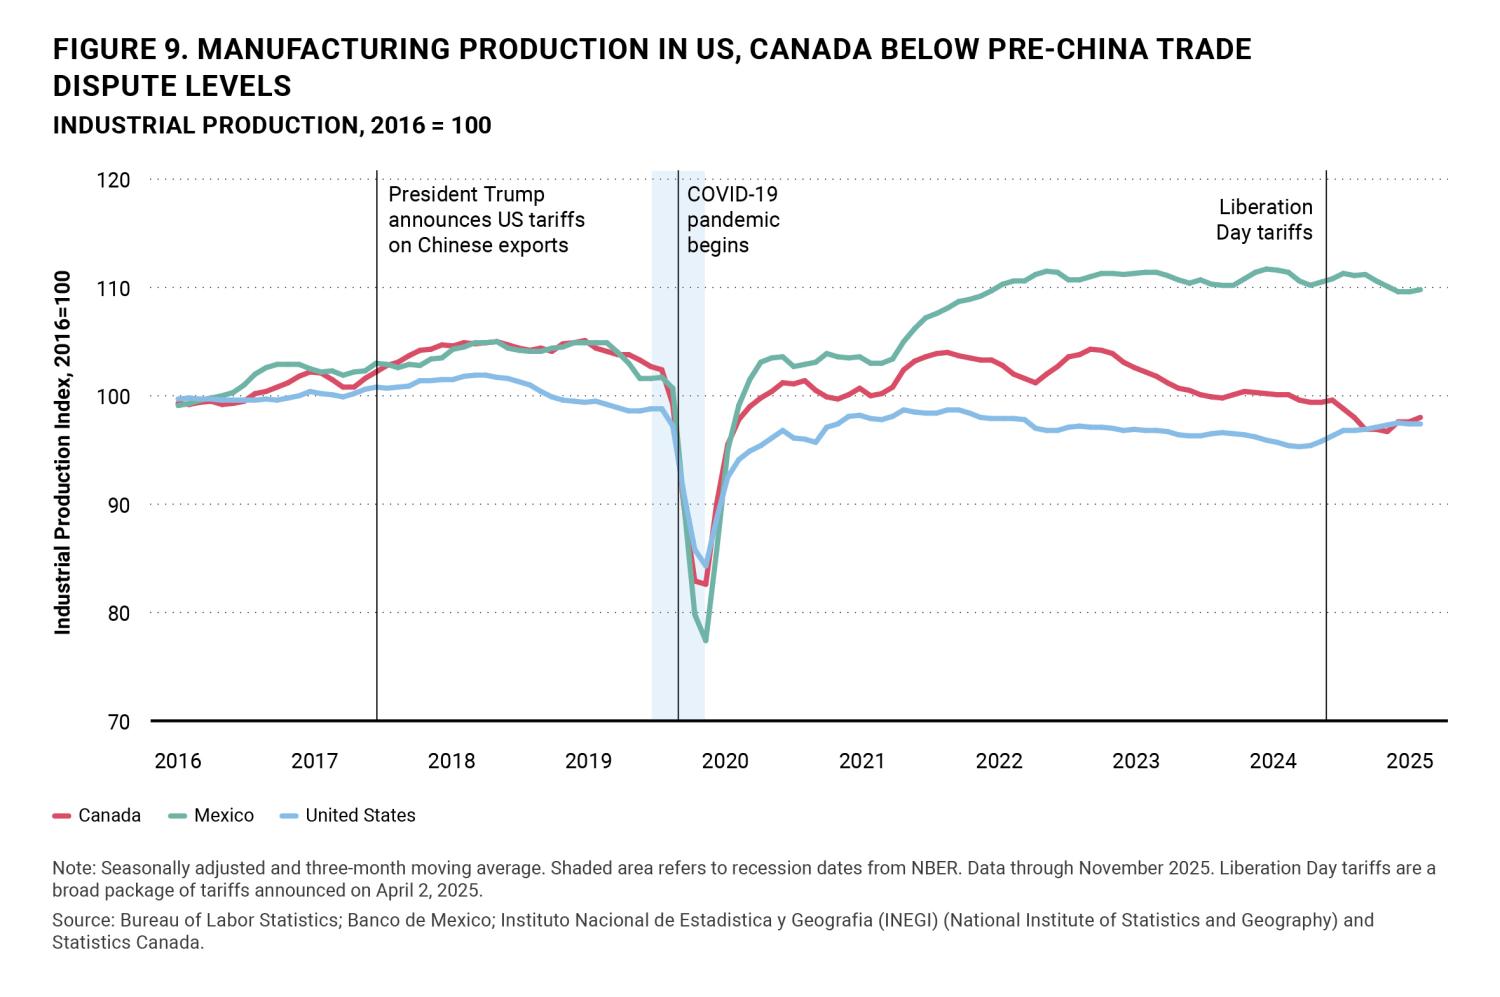
Manufacturing production appears to have peaked in 2023 in both Mexico and Canada, subsequently stabilizing in Mexico while falling in Canada. The U.S.’ manufacturing activity reached its peak in 2022 and trended lower until 2024.
Employment has followed a somewhat different path. Mexican manufacturing employment is below 2018 levels and has been following a downward trend since 2022. Similarly, U.S. manufacturing employment trails 2018 numbers and has been losing jobs ever since 2022. In contrast, Canadian manufacturing employment was on an upward trajectory since the pandemic until 2023, stabilizing after that (Figure 10).
Outlook: Manufacturing employment in Mexico facing headwinds from tariff uncertainty and increased labor costs
The manufacturing sector plays an essential role in Mexico’s economy. IMMEX facilities (maquiladoras) are an important source of manufacturing activity and employment, particularly in northern Mexican border states. Three out of five IMMEX jobs are located in the border states of Baja California, Coahuila de Zaragoza, Chihuahua, Nuevo León, Sonora, and Tamaulipas. These facilities’ goods exports represent 60% of Mexico’s total manufacturing exports.36
Firms that are part of the IMMEX (Programa de la Industria Manufacturera, Maquiladora y de Servicios de Exportación) program are mostly foreign-owned plants engaging in labor intensive assembly of intermediate and final goods for export.37 IMMEX firms import inputs temporarily duty-free from the U.S. or other countries. Tariffs are applied only to the value added by assembly on manufacturing products exported back to the U.S. IMMEX firms are highly integrated into global value chains.38
The IMMEX sector reached its post-pandemic employment peak in June 2023 when it employed 3 million workers. However, employment has since steadily declined, dropping to 2.8 million as of November 2023, while output did not similarly fall. These job losses are significant as IMMEX jobs represent a major source of employment in Mexico, accounting for more than 12.5% of formal employment as of November 2023.
Several factors are behind the substantial reduction in IMMEX jobs.
Due to the strong regional value chain linkages between the U.S. and Mexico, falling U.S. manufacturing activity has caused a decrease in demand for IMMEX manufactured goods.
Rising labor costs due to increases in Mexico’s federal minimum wage have outpaced labor productivity gains. The government increased the minimum wage by 129% in real terms during annual adjustments over the past six years.
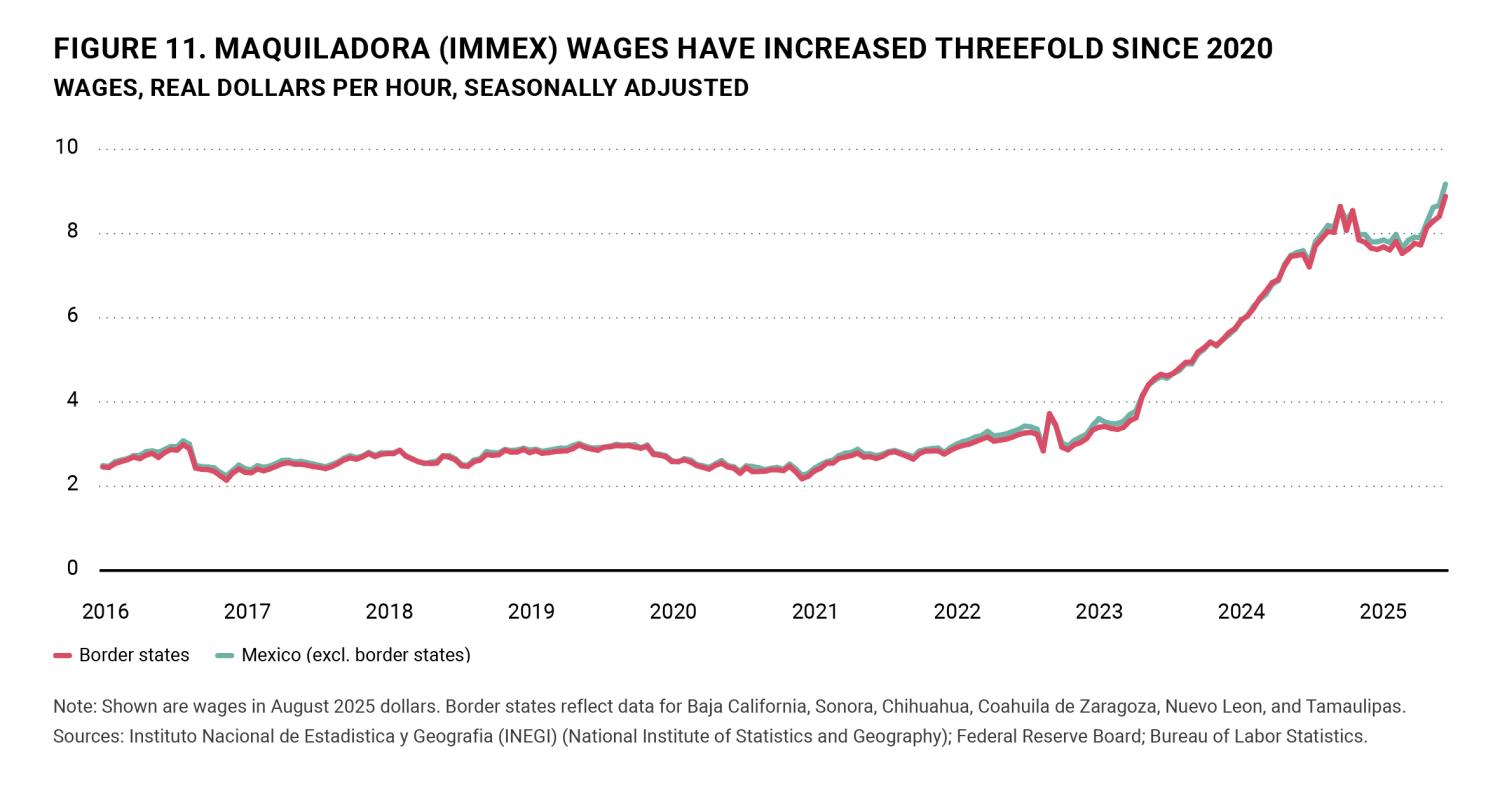
While the majority of workers in the formal sector, including IMMEX industries, earn more than the minimum wage, it serves as a reference wage that drives other labor costs and can push up prices. As a result, the average daily salary in the formal sector increased 27.7% in real terms between 2018 and 2025, while IMMEX wages jumped in real terms by 198% from August 2020 to August 2025 (Figure 11).
The resulting structural shift toward more high-skill and capital-intensive industries employing fewer workers—industries such as server and medical equipment manufacturing—has affected the demand for maquila workers. Meanwhile, firms have also grown hesitant to expand operations in an environment of unpredictable trade policies and potentially changing tariff regimes between Mexico and the U.S.
A pickup in U.S. manufacturing activity, accompanied by USMCA agreement continuity, would bolster employment growth, but the changing manufacturing dynamics from labor-intensive to more high-skilled production would probably not lead to a massive expansion in manufacturing jobs.
Conclusion
U.S. tariff changes in 2025 reinforced the growing importance of intra-North American trade and production linkages, and of the USMCA itself, with higher tariff rates on non-USMCA trade motivating a sharp increase in USMCA compliance.
With potential strengthening of rules-of-origin requirements proposed by U.S. stakeholders for the USMCA review,39 this goal is largely consistent with the Sheinbaum administration’s Plan México, focused on increasing national and regional content in Mexico’s manufacturing.40 However, identifying achievable regional content requirements will be important to maintaining strong USMCA compliance, and research highlights sizeable compliance costs of stringent content requirements.41
Evolving North American trade and investment ties with East Asia present both risks and opportunities. With U.S. imports from China falling a further 20% in 2025, continuing a multiyear trend, this points to further potential for nearshoring, particularly for Mexico. Meanwhile growing investment in both Mexico42 and Texas43 from Taiwan, as well as from Japan and Korea, appear to be supporting growth in higher value manufacturing and further de-risking from China.
A structural shift appears underway in Mexico’s manufacturing towards more specialized high-skill jobs that complement the U.S. economy and points to a potential rebound in nearshoring investment and production if USMCA uncertainty is removed. Such capital-intensive manufacturing will require continued efforts towards developing Mexico’s skilled labor force, as well as trained labor on the U.S. side to take advantage of such reshoring opportunities. Growing nearshoring production in Mexico will also require addressing energy bottlenecks, with increased U.S. natural gas exports a key opportunity for both countries in the USMCA review.44
Case Study
Juarez’s manufacturing transition
Ciudad Juarez is emblematic of both the challenges facing Mexico’s manufacturing sector and the attendant opportunities. Juarez, on the Mexico-Texas border across the Rio Grande from El Paso, is the birthplace of the Mexican maquiladora manufacturing sector and remains a center in terms of employment.
It is also an area of transition, marked by significant job losses, increased automation, rising labor cost, and uncertainty surrounding trade and political environments. However, this is not the first time the city has experienced this kind of industry shock. Juarez went through a similar maquiladora transition in 2002 when the city lost about 60,000 maquiladora jobs after China joined the World Trade Organization. Low value-added and labor-intensive jobs went to Asia, such as the production of diodes, transistors, and simple capacitors, while relatively higher value-added production remained and evolved in the region such as the production of high-end flat screen TVs, metal mechanics, medical instruments, and supplies. In addition, automotive manufacturing consolidated.
To explore Juarez’s transition, we use cluster analysis.45 An area typically has an economic base that consists of several dominant industry clusters. These clusters typically exceed the national average in their share of employment, output, or earnings. Location quotients (LQs), which compare the relative concentration of industry clusters locally and nationally, are one way of assessing key drivers in an area’s economy.
An LQ exceeding 1 indicates that a specific industry cluster is more dominant locally than nationally. LQ cluster growth is measured by the percentage point change in its share of local employment between 2015 and 2025.
Figure 12 plots industry cluster LQs and growth for Juarez maquiladora employment. Clusters in the top half of the chart, such as computer and electronic products, medical instruments and transportation equipment, are referred to as base clusters. They have a larger share of local employment relative to the nation and, thus, an LQ exceeding 1. A base cluster is usually vital to an area’s economy and can be expanding relatively rapidly (star) or growing slowly or declining (mature). Those in the bottom half are less dominant locally than nationally and hence have an LQ below 1. “Emerging” clusters, such as machinery are relatively fast growing, while those growing slowly or declining are termed “transitioning.” Average hourly compensation is shown in parentheses.
Juarez is transitioning away from low value-added transportation equipment manufacturing such as basic lighting components, wiper motors, wiring harnesses and connectors, and simple plastic interior and exterior panels. These products are often highly sensitive to price competition and tariffs, and their manufacturing is sometimes considered destined for a cost-cutting relocation.46
Despite these challenges, the city remains a manufacturing hub, with continued investment in more advanced facilities, in some cases for nearshoring production. The local economy is evolving towards higher value-added electronics manufacturing, including semiconductors, integrated circuits, central processing units (CPUs), and networking equipment despite higher costs/wages. In addition, Juarez continues solidifying its medical instruments manufacturing base.
Geographically, clusters of firms are concentrated based on the technologies they employ, the markets they serve, the goods they produce, and the labor skills they require.
Going forward, the Juarez region should adapt quickly to the new requirements of its emerging manufacturing base, implying less labor intensive and greater skills manufacturing processes.
Authors


Related Viewpoints


-
Acknowledgements and disclosures
The views expressed are those of the authors and should not be attributed to the Federal Reserve Bank of Dallas.
Special thanks to Pia Orrenius, Isabel Brizuela, Isabel Dhillon, Michael Weiss, and Diego Morales-Burnett at the Federal Reserve Bank of Dallas for their contribution to the chapter.
-
Footnotes
- U.S. International Trade Commission, “DataWeb: U.S. Trade & Tariff Data,” database, https://dataweb.usitc.gov/
- International Monetary Fund, “Canada: Staff Concluding Statement of the 2025 Article IV Mission,” December 5, 2025, https://www.imf.org/en/news/articles/2025/12/05/cs-canada-staff-concluding-statement-of-the-2025-article-iv-mission
- International Monetary Fund, Mexico: 2025 Article IV Consultation—Press Release; Staff Report; and Statement by the Executive Director for Mexico, IMF Country Report no. 25/286 (Washington, DC: International Monetary Fund, October 2025), https://www.imf.org/-/media/files/publications/cr/2025/english/1mexea2025001-source-pdf.pdf; https://doi.org/10.5089/9798229025140.002
- U.S. International Trade Commission, “DataWeb: U.S. Trade & Tariff Data,” database, https://dataweb.usitc.gov/
- Hâle Utar, Alfonso Cebreros Zurita, and Luis Bernardo Torres Ruiz, “The US-China Trade War and the Relocation of Global Value Chains to Mexico,” The Review of Economics and Statistics (2025), https://doi.org/10.1162/REST.a.1682
- Federal Reserve Bank of Dallas, “Mexico nearshoring yet to yield big investment despite global trade tensions,” Dallas Fed Economics, December 5, 2024, https://www.dallasfed.org/research/economics/2024/1205
- U.S. Census Bureau, Foreign Trade Division, USA Trade Online, “NAICS Sector 31–33 (Manufacturing): U.S. Trade by Partner, Annual 2025,” https://usatrade.census.gov/
- ATP imports account for 27% share of U.S. imports from Mexico in 2025.
- Banco de México, “Cubo de Información de Comercio Exterior,” Series por Producto (Valor en dólares), https://www.banxico.org.mx/CuboComercioExterior/ValorDolares/seriesproducto. Instituto Nacional de Estadística y Geografía (INEGI), “Balanza Comercial de Mercancías de México (BCMM),” https://www.inegi.org.mx/programas/comext/
- Jesus Cañas, “Maquiladoras, Mexico’s Engine of Trade, Driven to Navigate Evolving Demand,” Southwest Economy, Third Quarter 2022 (Federal Reserve Bank of Dallas), https://www.dallasfed.org/research/swe/2022/swe2203/swe2203b
- Hâle Utar, Alfonso Cebreros Zurita, and Luis Bernardo Torres Ruiz, “The US-China Trade War and the Relocation of Global Value Chains to Mexico,” CESifo Working Paper no. 10638 (Munich: CESifo, 2023), https://www.ifo.de/DocDL/cesifo1_wp10638.pdf
- Alessandro Borin and Michele Mancini, “Measuring What Matters in Global Value Chains and Value-Added Trade,” Policy Research Working Paper no. 8804 (Washington, DC: World Bank, April 2019), http://hdl.handle.net/10986/31533.
- Joshua P. Meltzer and Maricarmen Barron Esper, “Is China circumventing US tariffs via Mexico and Canada?,” Brookings Institution, September 23, 2025, https://www.brookings.edu/articles/is-china-circumventing-us-tariffs-via-mexico-and-canada/
- Brendan Kelly, “China remains modest player in U.S.–Mexico trade despite growing scrutiny,” Federal Reserve Bank of Dallas, July 9, 2025, https://www.dallasfed.org/research/pubs/25trade/a1
- General Administration of Customs of the People’s Republic of China, “China’s Total Export & Import Values by Country/Region, Dec 2025 (in USD),” January 8, 2026, http://english.customs.gov.cn/Statics/3a0a3d5b-7a93-4be7-876a-e0f3b79b4e8c.html
- Federal Reserve Bank of Dallas, “Higher tariffs in U.S., Mexico part of global response to China export surge,” by Brendan Kelly, October 31, 2025, https://www.dallasfed.org/research/pubs/25trade/a3
- Department of Finance Canada, “Surtax on Chinese-made Electric Vehicles,” backgrounder, August 26, 2024, https://www.canada.ca/en/department-finance/news/2024/08/surtax-on-chinese-made-electric-vehicles.html
- Department of Finance Canada, “Canada acts to support its steel producers and workers,” news release, June 27, 2025, https://www.canada.ca/en/department-finance/news/2025/06/canada-acts-to-support-its-steel-producers-and-workers.html
- In January 2026, Canada replaced its 100% on EVs from China, with a tariff rate quota—applying a 6.1% tariff rate on these imports, but limiting to 49,000 imports per year—roughly 3% of Canada’s annual auto sales—and rising to 70,000 over time. Emily Chung, “Is Canada Equipped to Handle Chinese EVs?,” CBC News, January 27, 2026, https://www.cbc.ca/news/science/chinese-evs-charging-grid-infrastructure-9.7061631
- Presidencia de la República (México), “Versión estenográfica | Conferencia de prensa de la presidenta Claudia Sheinbaum Pardo del 10 de septiembre de 2025,” September 10, 2025, https://www.gob.mx/presidencia/articulos/version-estenografica-conferencia-de-prensa-de-la-presidenta-claudia-sheinbaum-pardo-del-10-de-septiembre-de-2025
- Diario Oficial de la Federación, “Decreto por el que se reforman diversas fracciones arancelarias de la Tarifa de la Ley de los Impuestos Generales de Importación y de Exportación,” Poder Ejecutivo, Presidencia de la República, December 29, 2025, https://sidof.segob.gob.mx/notas/5777376
- The Budget Lab at Yale, “State of U.S. Tariffs: January 19, 2026,” January 19, 2026, https://budgetlab.yale.edu/research/state-us-tariffs-january-19-2026
- Penn Wharton Budget Model, “Effective Tariff Rates and Revenues (Updated December 23, 2025),” December 23, 2025, https://budgetmodel.wharton.upenn.edu/issues/2025/12/23/effective-tariff-rates-and-revenues-updated-december-23-2025
- The White House, “Fact Sheet: President Donald J. Trump Proceeds with Tariffs on Imports from Canada and Mexico,” March 3, 2025, https://www.whitehouse.gov/fact-sheets/2025/03/fact-sheet-president-donald-j-trump-proceeds-with-tariffs-on-imports-from-canada-and-mexico/
- The White House, “Amendment to Duties to Address the Flow of Illicit Drugs Across Our Northern Border,” Presidential Actions, July 31, 2025, https://www.whitehouse.gov/presidential-actions/2025/07/amendment-to-duties-to-address-the-flow-of-illicit-drugs-across-our-northern-border-9350/
- “Adjusting Imports of Automobiles and Automobile Parts into the United States,” Federal Register 90, no. 65 (April 3, 2025): 23947–23955, https://www.federalregister.gov/documents/2025/04/03/2025-05930/adjusting-imports-of-automobiles-and-automobile-parts-into-the-united-states
- U.S. International Trade Commission, “DataWeb: U.S. Trade & Tariff Data,” database, https://dataweb.usitc.gov/
- Federal Reserve Bank of Dallas, “Mexico nearshoring yet to yield big investment despite global trade tensions,” Dallas Fed Economics, December 5, 2024, https://www.dallasfed.org/research/economics/2024/1205
- Eduardo García, Alfredo Corchado, and Alyda Muela, “The looming threat of tariffs and judicial reform in Mexico are freezing investments along the US border,” EL PAÍS (English edition), July 25, 2025, https://english.elpais.com/economy-and-business/2025-07-25/the-looming-threat-of-tariffs-and-judicial-reform-in-mexico-are-freezing-investments-along-the-us-border.html
- Secretaría de Economía (México), “Inversión Extranjera Directa,” Acciones y programas (Competitividad y Normatividad), https://www.gob.mx/se/acciones-y-programas/competitividad-y-normatividad-inversion-extranjera-directa?state=published
- Brendan Kelly, “China expands Mexico investment but notably lags U.S., other G7 economies,” Federal Reserve Bank of Dallas, September 26, 2025, https://www.dallasfed.org/research/pubs/25trade/a2
- Secretaría de Economía, “Inversión Extranjera Directa,” https://www.gob.mx/se/acciones-y-programas/competitividad-y-normatividad-inversion-extranjera-directa?state=published
- Brendan Kelly, “China expands Mexico investment but notably lags U.S., other G7 economies,” Federal Reserve Bank of Dallas, September 26, 2025, https://www.dallasfed.org/research/pubs/25trade/a2
- Rhodium Group, “Mexico,” China Cross-Border Monitor (data portal), database v1.2.6, https://cbm.rhg.com/data/north-america/mexico
- Pak Yiu, “China Inc. rethinks investment in Mexico under Trump’s tariff threats,” Nikkei Asia, February 17, 2025, https://asia.nikkei.com/Economy/Trade-war/China-Inc.-rethinks-investment-in-Mexico-under-Trump-s-tariff-threats
- Instituto Nacional de Estadística y Geografía (INEGI), “Banco de Información Económica (BIE): Manufacturas—Industria manufacturera, maquiladora y de servicios de exportación (IMMEX)—Por entidad federativa—Establecimientos manufactureros—Personal ocupado por calificación de mano de obra y condición de contratación según entidades federativas y municipios,” Tabulados Interactivos (base: IMMEX; tabla IMMEX_1), https://www.inegi.org.mx/app/tabulados/interactivos/?bd=IMMEX&px=IMMEX_1; INEGI, “Síntesis metodológica de la estadística del programa de la industria manufacturera, maquiladora y de servicios de exportación (IMMEX),” https://www.inegi.org.mx/contenidos/productos/prod_serv/contenidos/espanol/bvinegi/productos/nueva_estruc/889463919902.pdf
- Jesus Cañas, “Maquiladoras, Mexico’s Engine of Trade, Driven to Navigate Evolving Demand,” Southwest Economy, Third Quarter 2022 (Federal Reserve Bank of Dallas), https://www.dallasfed.org/research/swe/2022/swe2203/swe2203b
- Hâle Utar, Alfonso Cebreros Zurita, and Luis Bernardo Torres Ruiz, “The US-China Trade War and the Relocation of Global Value Chains to Mexico,” The Review of Economics and Statistics (2025), https://doi.org/10.1162/REST.a.1682
- Jamieson Greer, “Opening Statement for House Ways and Means and Senate Finance Committees,” Office of the United States Trade Representative, December 16–17, 2025, PDF, https://ustr.gov/sites/default/files/files/Press/Releases/2025/Ambassador%20Greer%20Reported%20to%20Congress%20on%20the%20Operation%20of%20the%20USMCA.pdf
- Gobierno de México, Mexico’s Plan: Strategy for Equitable and Sustainable Economic Development for Shared Prosperity (First Draft), https://embamex.sre.gob.mx/trinidadytobago/images/Cargar/turismocomercialesyculturales/English_Version_Plan_Mexico_2030-compressed.pdf
- Spencer Bowdle and Fariha Kamal, “Trade Compliance at What Cost? Lessons from USMCA Automotive Trade,” FEDS Notes (Board of Governors of the Federal Reserve System), July 18, 2025, https://www.federalreserve.gov/econres/notes/feds-notes/trade-compliance-at-what-cost-lessons-from-usmca-automotive-trade-20250718.html
- Jorge F. Vuelvas Lomeli, “Taiwan Is Rewiring North America’s AI Hardware Chain,” The Diplomat, August 21, 2025, https://thediplomat.com/2025/08/taiwan-is-rewiring-north-americas-ai-hardware-chain/
- Hailea Schultz, “Houston Leads U.S. Manufacturing Reshoring With Taiwanese Investments Surge,” Greater Houston Partnership, October 23, 2025, https://houston.org/news/houston-leads-u-s-manufacturing-reshoring-with-taiwanese-investments-surge/
- Jesse Thompson, Luis Torres, and Diego Morales-Burnett, “Overflowing U.S. Shale Gas Increasingly Streams to Mexico and onto Global Markets,” Southwest Economy (Federal Reserve Bank of Dallas), October 31, 2025, https://www.dallasfed.org/research/swe/2025/swe2514
- Federal Reserve Bank of Dallas, “Appendix,” in At the Heart of Texas: Cities’ Industry Clusters Drive Growth (Federal Reserve Bank of Dallas, December 2025), 100–101, https://www.dallasfed.org/-/media/Documents/research/heart/appendix.pdf
- Mariana Hernandez and Jose Luis Gonzalez, “In Mexican Border Town, Thousands of Jobs Lost Due to Trump Tariffs,” Reuters, September 1, 2025, https://www.reuters.com/business/world-at-work/mexican-border-town-thousands-jobs-lost-due-trump-tariffs-2025-09-01/
The Brookings Institution is committed to quality, independence, and impact.
We are supported by a diverse array of funders. In line with our values and policies, each Brookings publication represents the sole views of its author(s).