Introduction
Interest in the exposure of U.S. drug supply chains to China surged during the COVID-19 pandemic, as Chinese manufacturing plant closures underscored the risks of relying on China for critical medicines and ingredients. In that context, President Trump issued an executive order in August 2020 directing the Food and Drug Administration (FDA) to create a list of essential medicines and critical inputs, to aid in prioritizing domestic production and reducing dependence on foreign suppliers for those products. More recently, the Trump administration launched a so-called Section 232 investigation to assess whether imports of pharmaceuticals and their ingredients pose a national security risk.
Much of the concern is focused on the reliance of U.S. drug supply chain on Chinese producers of active pharmaceutical ingredients (APIs), which are the ingredients in medications that produce the intended therapeutic effect.
Disconcertingly, the reported U.S. drug supply chain exposure to Chinese-made products has varied widely. One estimate shows current U.S. reliance on Chinese-made API as low as 8%, while another suggests 47% exposure because of an indirect impact stemming from India’s apparent reliance on China for API. Some reports have even claimed that China controls 80-90% of the global supply of API. Our review suggests that Chinese API is included in perhaps a quarter of drug volume sold in the U.S.
Understanding the scope and characteristics of supply chain exposure to China has important policy implications. It matters for efforts to improve supply chain resilience because it is much harder to switch API suppliers than suppliers of ingredients for API. It also matters for onshoring efforts because onshoring the API production stage alone has a limited impact on derisking from China if the precursors needed for API production come from China. It also matters for tariff policy because the tariff rate is generally tied to API location, but not the location of API precursors.
In this paper, we discuss the exposure that U.S. drug supply chains have to China, putting many of the circulating API exposure estimates in context. To do so, we first describe key stages in manufacturing drugs, focusing on small molecule drugs, which represent the lion’s share of drugs taken by U.S. patients. We then follow with a discussion of various approaches to estimating the exposure and where they can falter. As part of that discussion, we provide new original analysis to highlight areas of vulnerability. We conclude with a discussion of policy implications.
Typical drug supply chain
The prescription drugs dispensed in hospital and retail pharmacies, known as finished dosage form (FDF) products, combine one or more APIs with excipients that have no therapeutic effect but either serve as fillers, diluents, or otherwise affect functionality of the product, such as drug release, stability, or dissolution rate (see Figure 1).
Figure 1: Typical drug supply chain for small molecule drugs
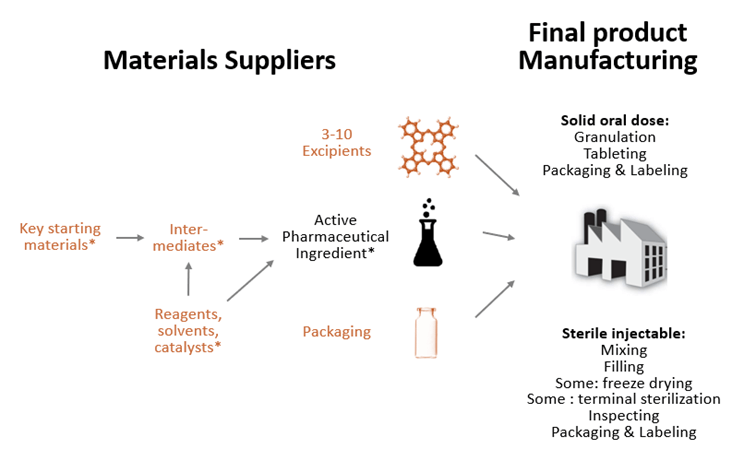
Note: Items marked in orange are not used exclusively in drug supply chains. For biologics, steps marked with * would be replaced with cell culture and purification, all done in one facility.
Source: Wosińska (2025)
APIs differ across drugs in their complexity. Active ingredients for highly complex biologic drugs cannot be synthesized chemically but are instead grown in living cells. However, the drug products that U.S. patients overwhelmingly use are small molecule drugs that are chemically synthesized, either fully or partially.
API production for small molecule drugs involves a multistep process that begins with preparing key starting materials and carrying out controlled chemical synthesis through a series of reactions that use auxiliary chemicals. In some cases, the raw materials are first turned into intermediate compounds called intermediates. The process then requires purifying and isolating the API from impurities, filtering and drying the API, and conducting quality control and analytical testing to ensure purity and compliance with regulatory standards.
To ensure that the resulting product is made to specification, the API and FDF steps must be tightly controlled. FDA, therefore, requires that API and FDF facilities register with FDA and undergo pre-approval inspections that verify that manufacturers can make the product as described in the drug application. (FDA may waive the inspection if it has assurance through other sources that the manufacturer can make the relevant product to specification.) Changes in the FDF or API process must be reported to the FDA, with some changes, such as FDF and API site changes, requiring additional FDA review.
While FDF and API steps are closely regulated by FDA, the regulation of direct and indirect inputs into API production (marked orange in Figure 1) varies. There is no requirement to register, but manufacturers of certain intermediates will be reported in the initial drug application. In some circumstances, companies that have the FDF approval may have to report changes to intermediate manufacturers if the supplier change in some way affects product characteristics. A change in source only, without a change in process, will not require amendments to the drug application.
How much API really comes from China?
We identified several explanations for the variability in API numbers: differences in the unit of measurement used, mischaracterization of India’s reliance on Chinese API, improperly extrapolating from examples, and blending upstream and API exposure. We describe these in more detail below, explaining why many of the statistics overstate the U.S. aggregate reliance on Chinese API and what that means for policy.
Determining the correct unit of measurement
One reason for differences in API exposure numbers is the unit of measurement. Some analyses measure the share of facilities in China or the share of APIs that are made in China, weighing each equally. Others apply weights to drugs: an analysis from Avalere Health weighed API exposure by dollar sales of the relevant FDF, while a recent U.S. Pharmacopeia analysis weighted APIs by unit volume.
How the different APIs are weighted matters. When APIs are weighted by dollar sales, the resulting figure will heavily skew towards brands because of the extensive gap between branded and generic drug prices. However, American patients overwhelmingly use chemically-synthesized generic drugs, making volume weights more relevant for assessing public health impact from a geopolitical shock. Identifying exposure through the share of APIs made in China is a better alternative, especially when the analysis is stratified by specific drug subcategories (e.g., essential medicines, most used). Exposure through the share of facilities would likely be an underestimate because of the reported economies of scale differential between Chinese and Indian manufacturers.
Constructing volume-based exposure measures is the best approach because of the public health focus of the policy discussion. But even here, there are several ways to measure volume. One is measuring by the number of units sold, be it tablets or vials. This will skew the picture towards chronic conditions. Another one is measuring by volume to measure it by weight of API. This will put more weight on drugs with low potency API, e.g., one tablet of 500mg amoxicillin would get the same weight as 10,000 tablets of 50mcg levothyroxine. Lastly, one could also count the number of patients taking specific drugs in a given time period. This kind of measurement would give more weight to acute conditions.
Weighing by volume has been a major challenge because of data availability. While FDF sales are available through sources like IQVIA, such data then must be mapped to specific API sources—not an easy task when FDF manufacturers do not disclose publicly who makes their API. Recently, the U.S. Pharmacopeia Medicine Supply Map made significant progress towards such mapping using various public and proprietary sources. In their analysis, they use IQVIA “extended units,” which represent individual tablets or capsules for oral solids and number of milliliters in injectable drugs. The analysis shows that 3% of branded extended units have Chinese API and 8% of generic extended units for drugs excluding IV fluids, with an additional 6% and 16% respectively, where the country is unclear (see Figure 2).
Differentiating between actual and potential exposure
Some API exposure statistics rely on certain publicly available FDA data, without differentiating between actual and potential reliance on Chinese API.
One such data source is the list of Drug Master Files (DMFs). DMFs, specifically Type II DMFs, include information about chemistry, manufacturing, and controls (CMC) for the API or its intermediate, including all the synthesis steps from key starting materials. By filing a DMF with FDA, a third-party API or intermediates manufacturer can submit the necessary CMC information to FDA without having to share the intellectual property information with the company applying for FDA approval of the FDF version. If the applicant plans to make the API in-house, the full CMC information may be directly included in the application, without a DMF.
FDA will not review a DMF’s content until it reviews the drug application that references it. With no review, listing DMFs is easy and can invite irrelevant DMF filings—an issue we return to later.
A recent U.S. Pharmacopeia analysis appropriately characterizes the DMF submission data as showing capability, not actual exposure, when discussing China’s share of DMF filings that rose from 5% in 2000 to 32% in 2024. However, it is easy to misinterpret DMF filings as actual reliance because FDA uses the term “active” when the DMF listing simply means that the DMF is available for reference in a new drug application.
Here, we further characterize the extent to which DMFs are not used in drug applications, focusing on API. This is easier done for generics because an API DMF must pay a fee under the Generic Drug User Fee Act (GDUFA) before a generic drug application referencing it is submitted. As such, the absence of a GDUFA fee is an indication that the API DMF is not referenced in a generic drug application. No such DMF fee exists for branded products, but a focus on generics is appropriate because of their prevalence and the small number of Chinese facilities involved in branded API production.
To identify which DMFs are for API in generics or soon-to-be generics, we eliminate biologics and DMFs for single source small molecule drugs filed at least two years before generic applications can be submitted. To separate out the API, we then cross-reference the DMF subject with the Orange Book. We find that close to 20% of DMFs filed between 2013 and 2024 do not have a reasonable match with approved drug substances. These DMFs include intermediates, as expected, as well as drugs that are not approved in the U.S. market. In speaking with FDA compliance experts, this appears to be a result of companies wanting to use a DMF filing for promotional purposes.
Figure 3a shows DMF API submissions for generics and soon-to-be generics by location. The figure shows an uptick in Chinese DMF filings since COVID. Part of that uptick is driven by Chinese DMFs filed in response to the compounding boom for GLP-1 drugs. But even with GLP-1 DMFs included, the increasing prominence of Chinese DMFs seen in Figure 3a (27% in 2024) is somewhat lower than the 32% in the recent U.S. Pharmacopeia analysis. This means Chinese firms are disproportionately filing DMFs for either more intermediates, unapproved molecules, or substances that are not prescription drugs (like cell culture).
When we look at the rate at which API DMFs have paid GDUFA fees (Figure 3b), we see two patterns. First is the much lower rate of GDUFA payments in the most recent years. This likely reflects the lag with which generic drug applications reference DMFs and the increased number of DMFs available for reference. Second is the lower uptake rate of Chinese DMFs. Part of the gap in 2023 and 2024 is due to 17 Chinese GLP-1 DMFs that were likely filed to market GLP-1s for compounding. But more broadly, the gap may be driven, according to industry executives we spoke with, by the general hesitance with sourcing from China because of a history of unreliable manufacturing practices. However, it may just be a matter of time before, as China advances technologically, firms eliminate that hesitance.
Just as DMF filings can be mischaracterized as actual API sources, FDA’s facility registration data contained in the electronic Drug Registration and Listing System (eDRLS) can be mischaracterized as a set of facilities making prescription drug products for the U.S. market. However, eDRLS is much broader, with registration requirements for facilities making over-the-counter products, unapproved prescription drug products, and facilities making API for research purposes. As with the DMF file, there are no restrictions to registering, so facilities listed in eDRLS may not be making product for the U.S. market.
To narrow down the list of API facilities making API for prescription drugs intended for the U.S. market, we limit the 2024 eDRLS list to those that either pay GDUFA API facility fees or have FDA compliance records indicating branded drug production (data courtesy of Redica Systems). The impact is substantial: out of the 1,867 facilities listing API manufacture in their operations description, 46% have neither FDA compliance records suggesting branded drug production nor have they paid GDUFA fees. Among the 417 registered Chinese API facilities, 53% have neither paid GDUFA fees nor have FDA compliance records suggesting branded drug production.
Properly interpreting Chinese API exports to India
In lieu of product-level API-FDF mapping, a reasonable back-of-the-envelope approach to estimating U.S. drug exposure to Chinese API is by adjusting FDF market shares of certain countries by their exposure to Chinese API. In particular, India’s exposure to China matters greatly because of its high share of generic drugs sold in the U.S., 65% of solid oral dose generics. If we know what share of India’s API needs are supplied by China, then we can adjust India’s 65% share of solid oral dose generics by that number, approximating the exposure U.S. has to China via India.
How much India imports from China is well documented through India’s import statistics, which show that the dollar share of Chinese imports (relative to all imported API) has been hovering around 68% plus or minus 2%. But between 2018 and 2023, the share of imports, measured in tons of API (and therefore giving high weight to low potency APIs including antibiotics), has increased from 58% to 75%. This means that the average price of Chinese imports is declining, either because of the changing mix of imported drugs or because the price points for Chinese API are dropping faster than for API imported from other countries.
These import statistics are widely but incorrectly interpreted as indicative of India’s overall reliance on China for API, because India also has a robust domestic API industry that makes product for domestic consumption and for use in products Indian manufacturers export.
Assessing the scope of India’s domestic API production is much more difficult than its imports because India’s national accounts statistics do not break down pharmaceuticals into finished products and API. But India’s domestic drug production appears to be sizable according to India’s generic manufacturers association, which in 2019 assessed imports to India from all countries at only 32% of India’s API needs, a number later cited by a review of India’s reliance on China authored by Indian government officials. A more recent 2024 analysis from a credit rating agency affiliated with Moody’s put India’s annual API and bulk drug imports at ~35% of its total API requirement.
The omission of India’s domestic API production can make a substantial difference in the China-via-India exposure calculations. Adjusting for differences in domestic and export consumption is challenging, but if India’s aggregate domestic API production is indeed twice the size of India’s API imports, the India-via-China exposure is likely closer to a third of the often cited 70%.
This is not to say that there are areas where India’s exposure to China is not high. Next, we discuss two such areas.
Appropriately extrapolating from examples
One area known for its high exposure to Chinese API is antibiotics. However, in at least one case, (unverified) antibiotics statistics have turned into “China controls 80 to 90 percent of the global supply of active pharmaceutical ingredients,” without specifying for which active ingredients.
We can learn a lot about areas of China’s API dominance from the Indian government’s assessments of its exposure to China. Perhaps the most extensive analysis was published in 2020 by TIFAC, the Indian government’s version of MITRE. Using the Indian government’s data and extensive interviews with manufacturers, the report identified several APIs that India no longer makes (some antibiotics, vitamin C) and many where domestic API production is limited and imports primarily come from China (B vitamins, heparin, and erythromycin).
To obtain a more U.S.-centric picture, we analyze FDA DMF data for patterns. A DMF analysis alone will not give us a full picture because some manufacturers may be vertically integrated and not referencing a DMF, so we assume that if FDF is made by a Chinese firm, so is the API (e.g., we assume that Qilu makes API internally for its cisplatin FDF version).
We first explore which drugs might solely be sourced from China. We identify them as those molecules where all active API DMFs are from China, or all FDF versions are from China (per U.S. Pharmacopoeia Medicine Supply Map). We identify 36 such drugs, almost all through the DMF route. Perhaps not surprisingly, antibiotics feature prominently, with 12 drugs on the list, including streptomycin, tobramycin, and gentamicin. Two drugs on the list are cancer drugs (mitotane and abemaciclib), and three are on FDA’s essential medicine list (isoflurane, ipratropium bromide, and baloxavir marboxil). Other drugs on the list include dobutamine, iodixanol, and iopamidol.
This list is significantly longer than the list of drugs FDA identified in 2019 as solely sourced from China: capreomycin, streptomycin, and sulfadiazine. Further analysis is needed to determine how much of this difference is from China’s expansion in the API space versus our inability to observe whether inactive non-Chinese DMFs are still being used under drug applications approved in the past, or whether non-Chinese firms are vertically integrated with their API sources, and therefore the CMC data is directly included in the application. FDA can make this distinction much more readily than we can.
In our analysis, we stop short of characterizing the exposure to Chinese API for molecules where there is a mix of Chinese and non-Chinese DMFs. One could weigh DMFs equally, just as various analyses have done with API facilities. However, it is unlikely that production is uniformly distributed across API manufacturing sources, limiting how informative such analyses could be. The right analysis here would be to weigh the sources by volume of API. This kind of analysis will be possible once more manufacturers start reporting API volume to FDA in their annual reports, as required under the 2020 CARES Act.
But we can identify molecules where it appears there is no API stage exposure, with no Chinese DMFs nor Chinese FDF manufacturers that may do the API in-house. Under this scenario, we identify around 360 molecules that include 31 cancer drugs, 14 essential medicines, and all controlled substances (the latter by law).
That is not to say that these APIs have no exposure to China. We tackle that connection next.
Not differentiating between API stage and upstream components
Few would dispute that China’s grip on upstream drug supply chains is extensive. It is important, however, to differentiate between API exposure and other upstream component exposure to ensure that policy solutions effectively target the real problem—even if API suppliers for a given drug are or can be moved outside of China, the precursors for it might still be coming from China.
Visibility into upstream supply chains is extremely limited, making any existing numbers suspect. In fact, some of the circulating upstream exposure numbers are not actual statistics, but guesstimates. Any numbers would also need to be carefully interpreted—the share of all key starting materials (KSMs) made in China would not be as useful a measure as knowing how many drugs have at least one KSM sourced solely from China. Identifying single points of failure and common nodes in chemical synthesis is a better way to analyze exposure.
Common nodes is an approach explored in the TIFAC report mentioned earlier. The report clearly highlighted areas of vulnerability for specific KSMs, but also with common nodes created by shared technological processes to make intermediates, and shared auxiliary materials necessary for the synthesis of KSMs and intermediates. Table 1 characterizes some of these areas.
In speaking with industry experts, there is a common theme with what has been outsourced to China: chemical synthesis steps that are intrinsically more dangerous and require handling of highly toxic materials, and performing reactions which have the potential to run away. Over time, manufacturers in Europe and even in India have ceded such syntheses to Chinese producers. This is true for fluorination of intermediates and many chemicals needed for synthesis, including KSMs.
It is worth pointing out that much of Table 1—reagents, solvents, and fluorination—does not appear in other reports characterizing U.S. drug supply chain exposure to China. It could be that Europe is less exposed to China in the areas listed in this table, balancing out the heavy reliance on Indian firms. But it is more likely that these elements are simply not on the radar screen for those analyzing the U.S. drug supply chain exposure to geopolitical risks because of their focus on specific drugs and not common nodes in drug production.
Discussion
Historically, U.S. drug shortages have primarily been triggered by manufacturing quality problems at the FDF production stage for generic sterile injectables. In the last 20 years, no shortages appear to have been caused by export restrictions.
However, shortages due to geopolitical conflicts are a potential future shock. Not only does the risk exist, but it could affect a much wider set of drugs than drugs that have historically been at greatest risk of shortage.
With the potential exposure so wide and a limited government budget, it is critical to fully understand where the greatest vulnerabilities exist. This paper attempted to clarify some misconceptions about those vulnerabilities. Our analysis has four key takeaways:
- China’s share in API production of U.S.-bound drugs must be understood in the context of specific drug categories: it is high for some and low for others. The current aggregate exposure for complete API across all categories is much less than many reports suggest, likely a quarter of the U.S. drug volume, as measured in units.
- Exposure to China at the intermediates stage is significant for some drugs and is generally related to specific processes. U.S. reports analyzing exposure to China usually highlight their grip on drugs that require fermentation (antibiotics). However, reports do not appear to highlight the importance of China’s control of fluorination processes used in formulating intermediates for some of the largest therapeutic classes: statins, sartans, and SSRIs. Other classes of intermediates may also be highly dependent on China.
- China plays a critical role in auxiliary chemicals, such as the production of reagents and solvents. These chemicals are necessary for the chemical synthesis of API and intermediates yet are omitted from virtually all analyses.
- China is moving downstream in the drug supply chain, showing significant gains in their ability to make API. At this point, the recent increase in China’s ability to make API has not been reflected in a similar uptake from FDF manufacturers, but the persistent price point advantages and improving technical capabilities create a potential for ever-increasing exposure on the API level.
These findings have several implications for policy:
- Policy interest should be broadened from KSMs to auxiliary chemicals that are needed in the chemical synthesis of API or as excipients. Auxiliary chemicals should be included in vulnerability assessments for essential medicines and considered in any stockpiling programs of precursors.
- The significant upstream supply chain exposure means that policies to onshore API will have very limited effect on derisking from China unless those efforts are also coupled with derisking the upstream supply chain for drugs supported by onshoring incentives.
- Policymakers should consider ways to limit China’s expanding API production stage ability. As one of us described elsewhere, imposing and reinforcing through Congress tariffs on Chinese drugs would limit Indian FDF manufacturers’ uptake of Chinese API sources.
- The broad upstream exposure also reinforces the need for prioritizing how the U.S. government engages and what role foreign alliances play in solving the seemingly ever-increasing scope of China’s exposure to U.S. drug supply.
Related Content


Authors


-
Acknowledgements and disclosures
This paper reflects a collaborative effort. Wosińska was primarily responsible for the conceptual design, drafting, framing of the arguments, and formulating recommendations, while Shi led the modeling and analysis of FDA data.
This project was conducted with support from the Gary and Mary West Health Policy Center. We would like to thank numerous individuals for helpful comments and discussions: Carlo de Notaristefani, Ilisa Bernstein, Stephen Colvill, Ryan Conrad, Erin Fox, Richard Frank, Monica Gorman, Marty Shimer, Madhur Singhal, and Pradeep Srivastava. We would also like to thank U.S. Pharmacopeia Medicine Supply Map and Redica Systems for providing key data. We would also like to thank Sam Peterson and Ben Graham for their fact-checking assistance and Rasa Siniakovas for data visualization, editorial, and publishing assistance.
The Brookings Institution is committed to quality, independence, and impact.
We are supported by a diverse array of funders. In line with our values and policies, each Brookings publication represents the sole views of its author(s).