This tool will update daily shortly after 4 p.m. ET on weekdays, excluding federal holidays, for daily data from the Daily Treasury Statements. Weekend and holiday transactions accumulate to the next business day. Weekly data (totaled from the daily data) will update once the previous full week’s data are complete. Monthly data are updated once a month, shortly after the Monthly Treasury Statements are released on the eighth business day. Totals are the sum of outlay categories, excluding Public Debt Cash Redemptions.
The Trump administration’s conduct and statements with regard to spending freezes and impoundment, including the Department of Government Efficiency’s (DOGE) activities, have created uncertainty as to whether or not funding is flowing through Treasury’s Bureau of the Fiscal Service to particular programs, agencies, and departments in accordance with the law.
This data tool allows users to track the flow of federal funds in real time. It shows actual daily, weekly, monthly, and annual processed outlays to key programs and departments, as well as to states, Congress, and the Judiciary. This tool only reports outlays of federal funds, meaning the actual transmission of funds from the federal government to another entity.
This tool makes few to no adjustments to the data, meaning that cyclical, seasonal, idiosyncratic, and expected variation in patterns of outlays over time remain. Because this tool only reports outlays, one cannot discern directly whether there is a gap between obligated funds and their outlay. Furthermore, if federal agencies have changed the rate at which they are newly obligating funds (e.g., by declining to sign new contracts), those changes would only gradually be reflected in outlays. Some outlay recipients’ labels and abbreviations are adjusted for clarity and to reflect federal changes to category groupings or labeling conventions.
These data are downloadable and can be used for secondary analysis.
Step one: Select “Compare by year,” or “Outlays over time”
“Compare by year” tab
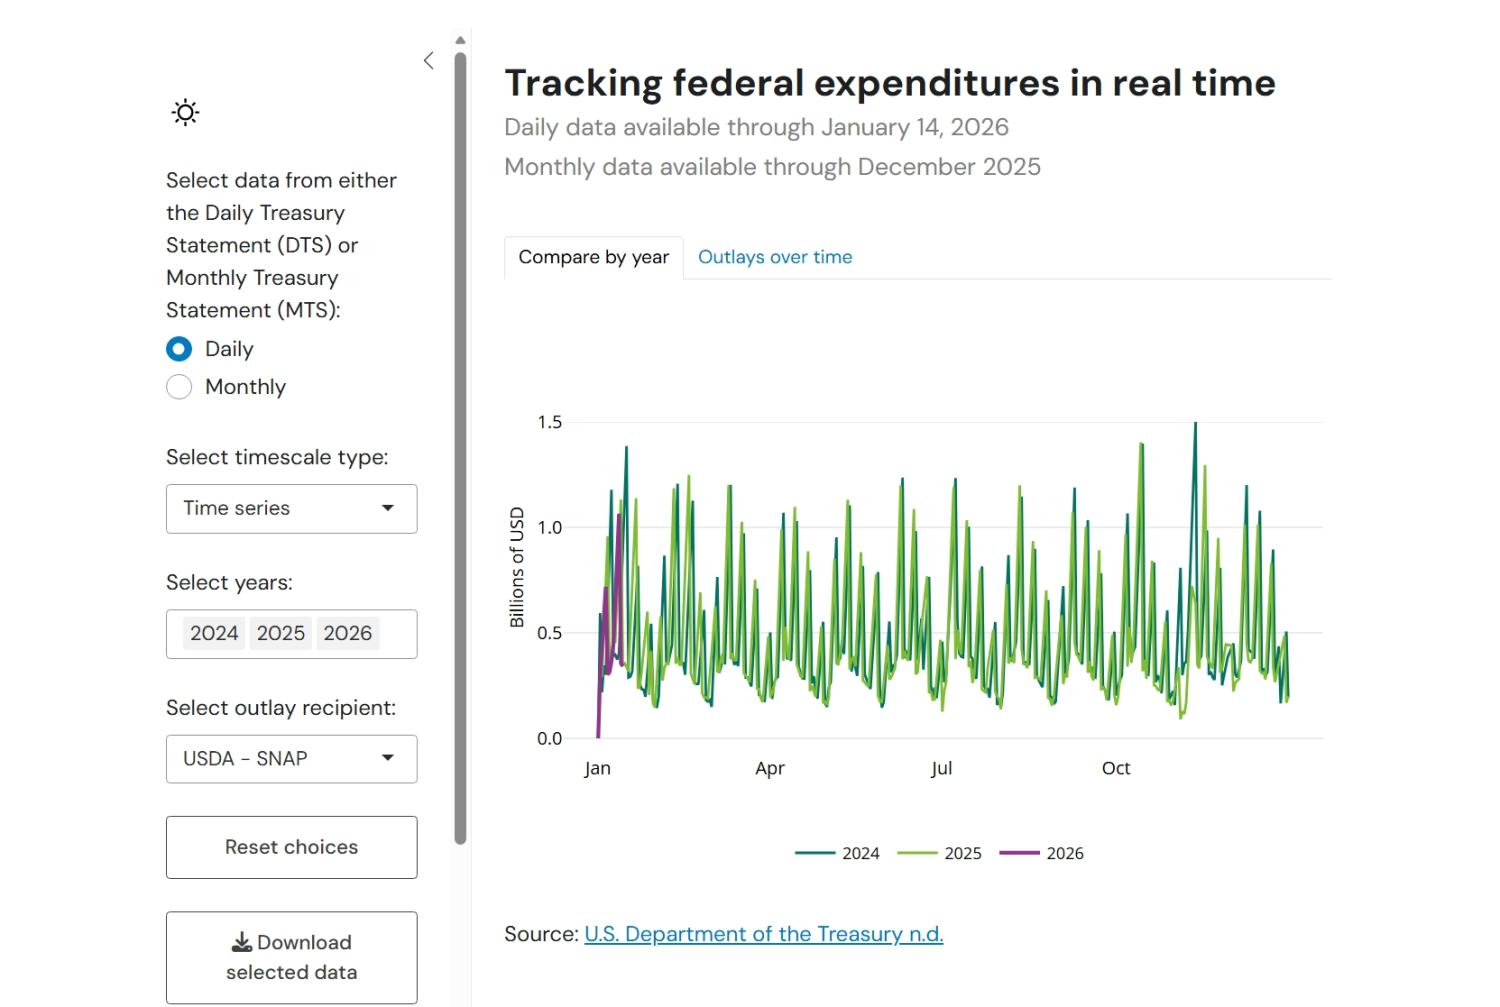
With the “Compare by year” tab, you can select one outlay recipient at a time to observe how year-to-date outlays (either as a time series or cumulative) compare to patterns in prior years. While the tool defaults to comparing 2026 to 2025 and 2024, users can change which years are shown using the “Select years:” box. Note that, in the cumulative data, we exclude years that do not have data starting in January as well as outlay recipients with no 2026 data.
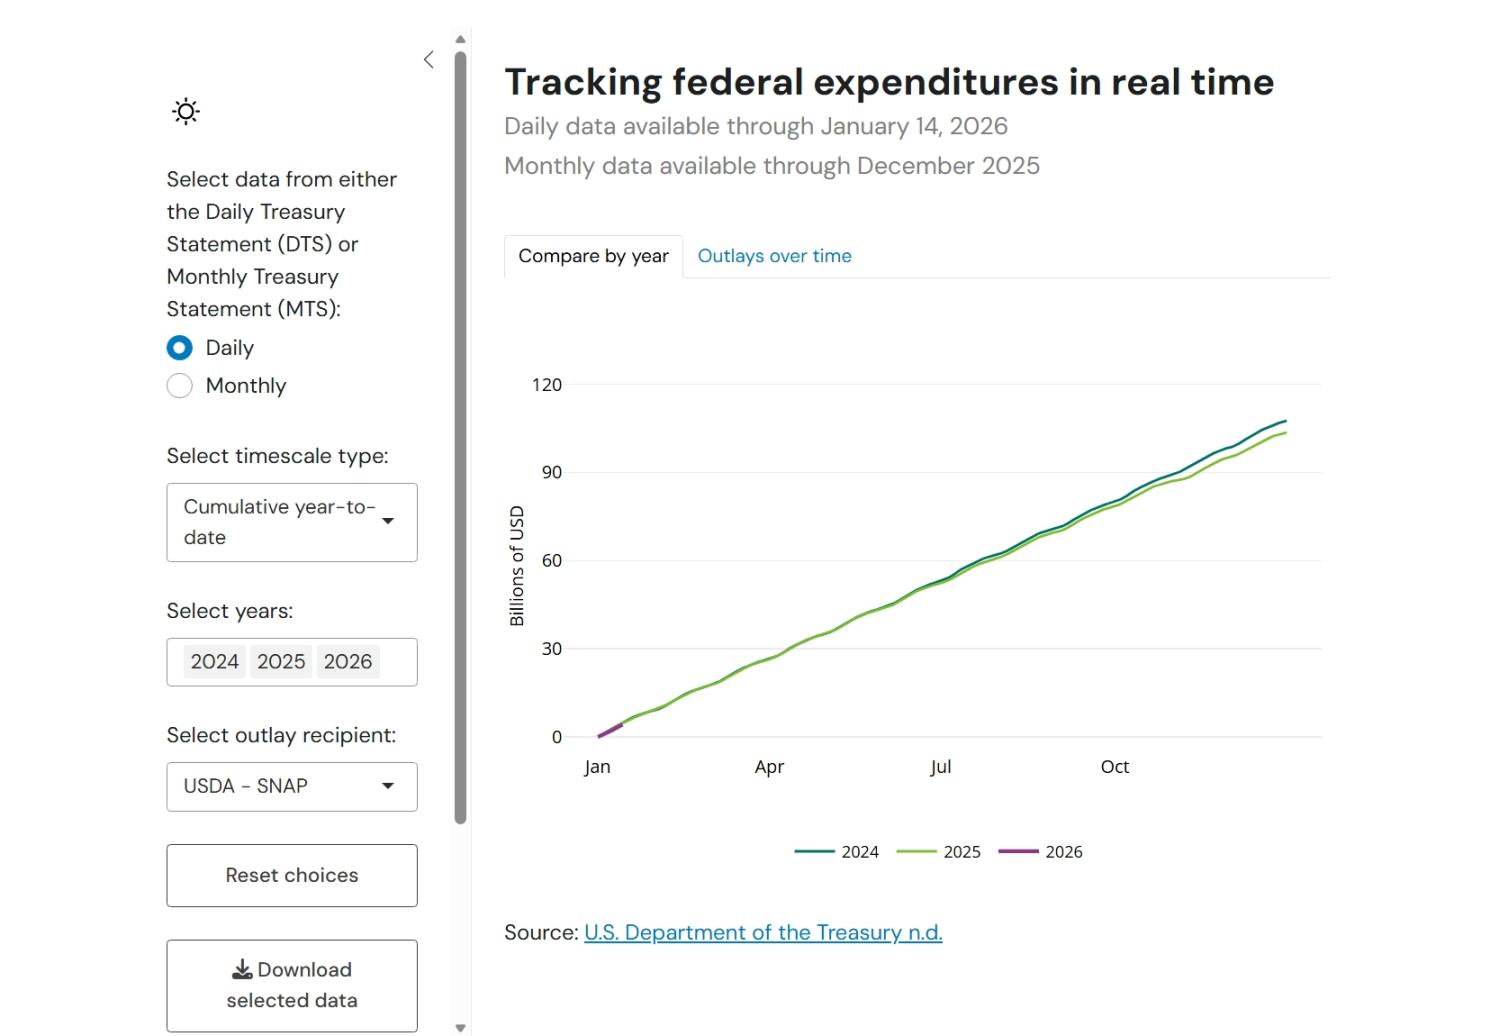
The below examples from the “Compare outlays by year” tab show daily outlays to the United States Department of Agriculture Supplemental Nutrition Assistance Program (SNAP) by “Time series” (above) and “Cumulative year-to-date” (below).
“Outlays over time” tab
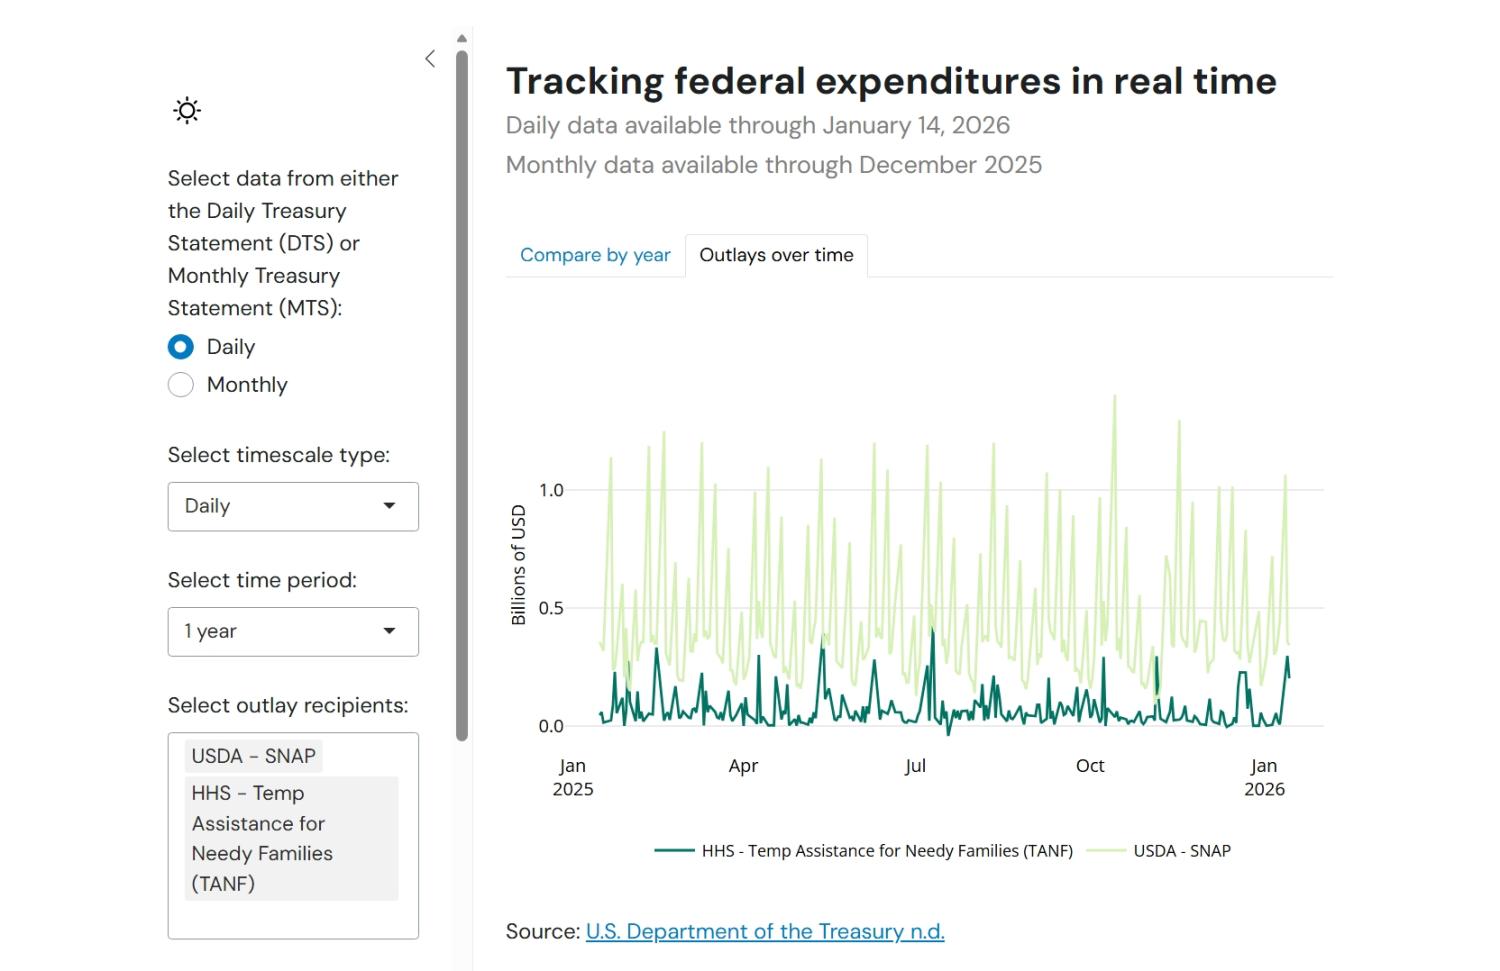
With the “Outlays over time” tabs, you can select your desired time period, outlay frequency, and outlay recipients. In these tabs, you can compare up to nine outlay recipients using the “Select outlay recipients” box.
Using daily data, you can select three months, one year, or three years for the time period, and daily, weekly, or a seven-day simple moving average for the outlay frequency. The below example from the “Outlays over time” tab shows daily outlays to SNAP and the Temporary Assistance for Needy Families (TANF) program in the past year.
Using monthly data, you can select one year or three years for the time period. The below example shows monthly outlays to SNAP (3.6.4), TANF (8.1.11), and Special Supplemental Nutrition Program for Women, Infants, and Children (WIC) (3.6.3) over the past year.

Step two: Select data from Daily or Monthly Treasury Statement
This interactive allows you to explore date from both Daily and Monthly Treasury Statements. Daily Treasury Statements have high frequency data for a more limited set of outlay recipients. Monthly Treasury Statements have lower frequency data for an extensive set of outlay recipients.
Step three: Select outlay recipient(s)
Once a tab is selected, one can select or search for outlay recipients using the “Select outlay recipient(s)” bar.
To use the “Compare by year” tool, select one outlay recipient at a time. Not every outlay recipient is present for the entire time series. If a particular outlay recipient is not present in 2026, then the “Compare by year” tab will not populate. To use the “Outlays over time” tool, select up to nine recipients by searching for an outlay recipient or by using the dropdown menu. Recipients can include programs like the Supplemental Nutrition Assistance Program [SNAP], agencies like the National Institutes of Health [NIH], and other recipients of federal funding.
Labels for the outlay recipients in this tool have been edited for clarity and consistency over time and may not directly match those found on the Daily or Monthly Treasury Statements. For daily outlays, we have added common abbreviations to help navigate the tool and made outlay recipient names consistent over time. The glossary lists the names of the outlay line items available in the tool, as reported in the Daily Treasury Statement, as shown in this tool and in full.
For monthly outlays, we have made very few changes to outlay recipient names and have not yet added common abbreviations to aid search. To help navigate the monthly outlays, recipients are labeled with numerical prefixes that reflect the nested structure of programs and are consistent over time. Top-level categories (for example, the Legislative Branch or the Department of Commerce) are designated with a single number (1–32), and each nested subcategory is designated with a decimal. For example, one top level category is “10 Department of Housing and Urban Development.” The first nested categories under housing programs include “10.1 Community Planning and Development,” “10.2 Government National Mortgage Association,” “10.3 Housing Programs,” and several others. To go another level down, under “10.1 Community Planning and Development,” you can find “10.1.1 Community Development Fund,” “10.1.2 Home Investment Partnership Program,” and several others. Totals for each category are calculated from each of its subcategories.
This tool was developed by Lauren Bauer, Noadia Steinmetz-Silber, Riki Matsumoto, and Eileen Powell. It is a work in progress; please contact Lauren Bauer ([email protected]) if you have questions or suggestions. For more information about the tool and its potential uses, listen to the Planet Money from NPR episode “The Big Government Money Pipe Freeze.”
Note that, as of May 2025, you can view outlays by year (time series and cumulative year-to-date) using data from the Monthly Treasury Statements.
The Brookings Institution is committed to quality, independence, and impact.
We are supported by a diverse array of funders. In line with our values and policies, each Brookings publication represents the sole views of its author(s).