Global greenhouse gas (GHG) emissions are projected to exceed 60 gigatonnes (GT) CO₂eq yet again in 2025. According to the latest update of the World Emissions Clock (WEC), global emissions will increase from 60.1 GT in 2024 to 67.2 GT by 2050 if the Business as Usual (BAU) trajectory continues. This spells out long-term temperature increases of substantially above 2°C, breaching the Paris Agreement’s central threshold.
Mixed signals: better promises require turning ambition into real-world results
However, a number of countries are now responding to the urgency to confront climate change. With 36 newly submitted Nationally Determined Contributions (NDCs), countries have revised and targeted their NDCs, and if they are fully implemented, global emissions could drop to below 45 GT by 2040, and by 2050, be 31 GT lower than under the current trajectory (BAU). This results in a shift of both the emission and implementation gaps. In the past, most countries lacked ambition, while implementation was also lagging. Now, as seen in Figure 1, countries are making better commitments. But translating those promises into real-world results is proving harder. This growing implementation gap—between pledges and actual policy delivery—is now the greatest obstacle to aligning global emissions with the Paris Agreement.
Figure 1. As the ambition gap shrinks, the implementation gap grows
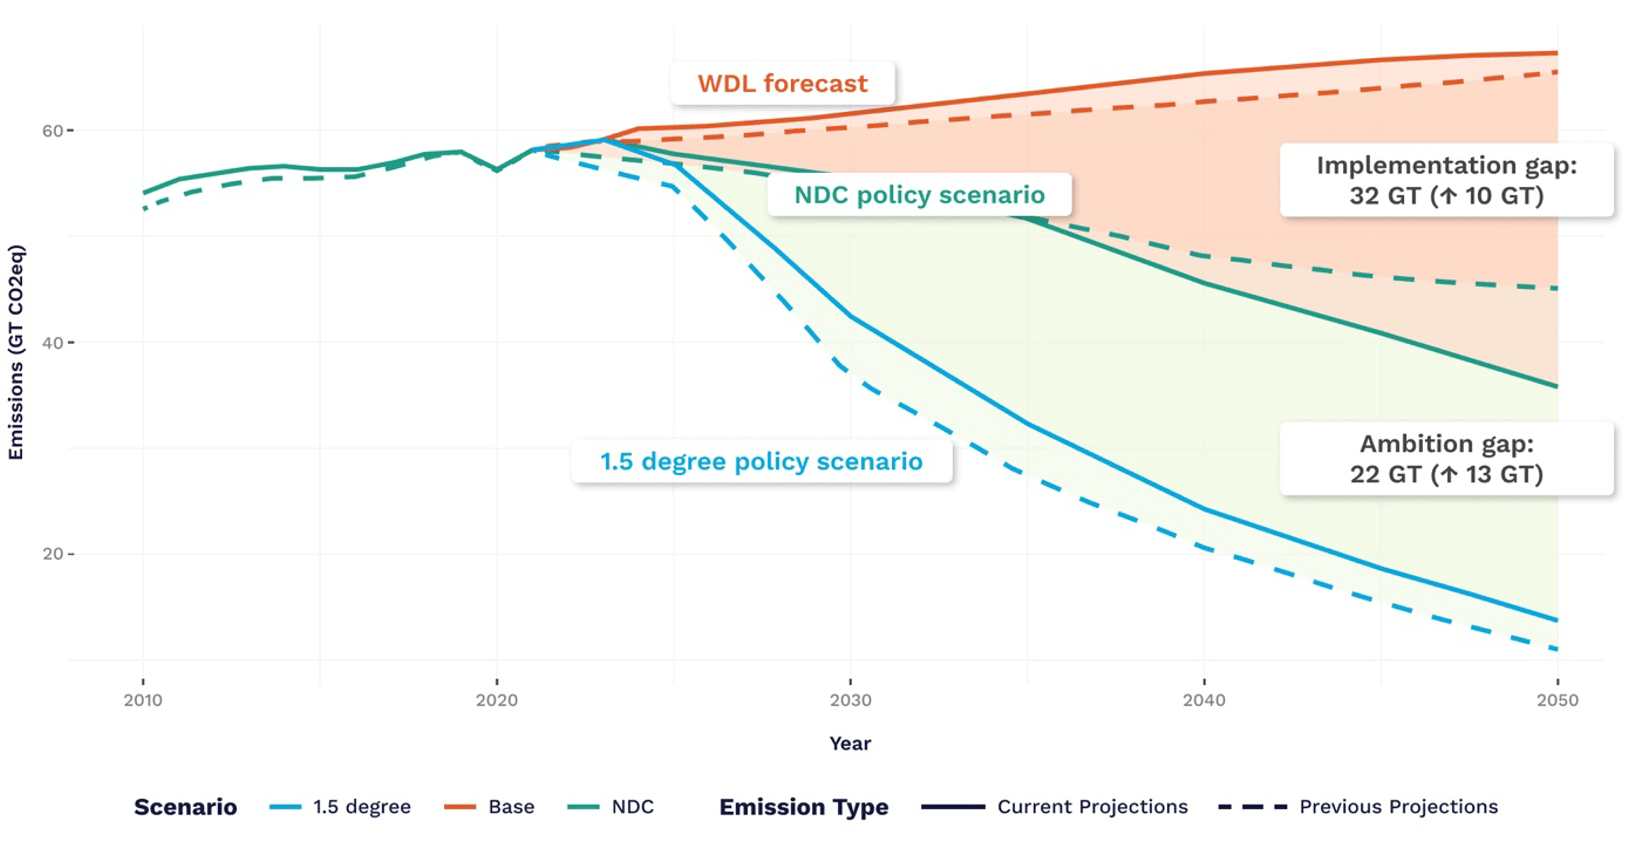
Source: World Emissions Clock; Note: Dotted lines show the previous projection; solid lines reflect the updated data. The ambition gap narrows, but the implementation gap widens.
Stronger climate commitments reduce emissions across all main sectors
Updated WEC data suggests that, under the NDC scenario, every major sector will see declining emissions through 2050. Among them, transport and industry stand out as the biggest decliners. By 2050, projected emissions reductions relative to previous forecasts are 3.6 GT for Transport, 2.7 GT for Industry, and 2 GT for Energy.
These shifts are driven by stronger climate commitments in some of the major emitting countries, notably the EU, Brazil, and oil-exporting economies. Moreover, improvements in fuel efficiency, the uptake of electrified transport, industrial decarbonization, and power sector reforms will all play a role as well.
Figure 2. Sectoral emissions pathways under the updated NDC scenario
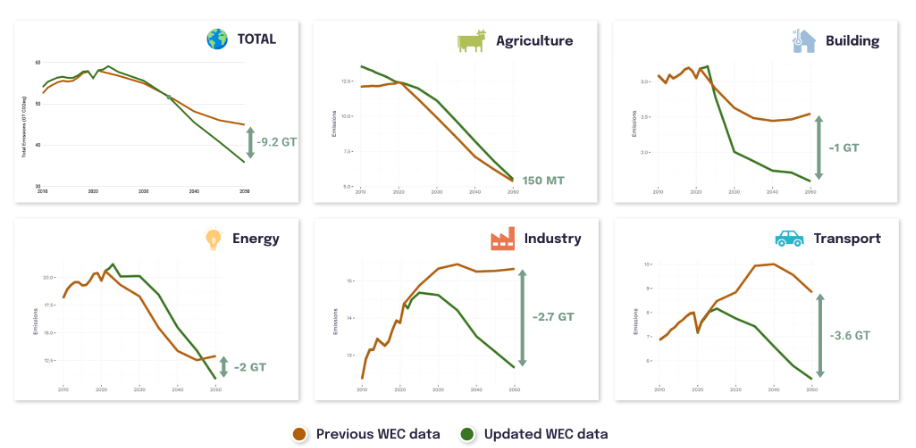
Source: World Emissions Clock; Note: The steepest declines come from transport, industry, and energy, reflecting strengthened climate targets. Overall, the updated data shows that every sector is forecast to decline in total emissions along the NDC scenario.
Gains in a growing number of countries are not yet enough to bend the global curve
We are currently experiencing two major types of emissions trajectories: traditionally high-emitting rich countries reducing emissions, while many emerging economies, especially in South Asia and Africa, are increasing their emissions, typically from a low base.
While the world currently emits 60 GT, similar to last year, there are now 43 countries, accounting for over 53% of global emissions, which are experiencing declining emissions, even under the Business as Usual (BAU) scenario. This not only includes most of the OECD, but also China, which represents a major milestone.
- China, the world’s largest emitter accounting for 27% of global emissions in 2025, has peaked at 16.1 GT in 2024. Our projections show a decrease of 1.8 GT in annual emissions by 2050 along the BAU scenario.
- Having peaked before 2010, the United States continues to show declining emissions, with a projected decline of 25% until 2050, when it is projected to have 4.3 GT in annual emissions. These projections do not take into account the efforts of the Trump administration to roll back emissions regulations and other climate-related measures.
- Germany, Sweden, and Finland, with relative declines under BAU to 2050 of 39%, 53% and 42% respectively, lead among major economies in reducing emissions, but even their 2050 levels under BAU remain above what would be required to meet Paris-aligned benchmarks.
- Many countries also show relative increases to 2050, such as India (relative BAU increase of 95% taking it to just under 9 GT in 2050) and Indonesia (relative BAU increase of 63% taking it to just under 3.5 GT in 2050).
The data update of the WEC reclassifies five countries—Estonia, Croatia, Latvia, Trinidad and Tobago, and Libya—as having peaked. While these nations contribute relatively little to global totals, they demonstrate that declining emissions are compatible with rising prosperity, especially considering all but Libya in this group are high-income economies.
To capture the interplay between income and emissions, in 2023 World Data Lab proposed a new emissions classifications framework: an income-emissions matrix, highlighting countries that become or stay high-income while driving down emissions. Following the 2025 data update, two countries have been reclassified as high-income low-emitters, which is the target for all countries: Switzerland and Croatia. Switzerland moved from middle-emitting to low-emitting, reflecting strengthened NDCs, including a 65% reduction target by 2035 (vs. 1990 levels), while Croatia’s reclassification stems from both higher income and maintained low emissions levels.
These shifts underscore that prosperity and emissions reduction are not mutually exclusive: They are the benchmark for sustainable development. Learning best practices from countries that excel at sustainable economic success in each sector is a tangible way for more economies to become high-income-low-emitters.
The updated data from the World Emissions Clock shows a world at record-high emissions, but with signs of progress. Sectoral trends are improving, national targets are becoming more ambitious, and a small group of countries is showing that low emissions and high income can coexist. The challenge is to move from selective successes to global momentum.
Note: For questions regarding the underlying data model, please contact Tedi Yankov ([email protected])
Authors


Related Content

-
Acknowledgements and disclosures
The authors of this commentary are affiliated with World Data Lab, including its non-profit division. Data from the World Data Lab mentioned in this post are publicly available.
The Brookings Institution is committed to quality, independence, and impact.
We are supported by a diverse array of funders. In line with our values and policies, each Brookings publication represents the sole views of its author(s).


Commentary
The world at 60 gigatonnes of greenhouse gas emissions
September 20, 2025