The COVID-19 pandemic disrupted the normal flow of economic data. This may be especially important for inflation, where menu costs mean that some price changes have traditionally been postponed until the start of a new calendar year. This “lumping” of price changes into the early part of the year is typically filtered out by standard seasonal adjustment tools, but—as seasonal adjustment factors are conditioned on the pre-COVID decade of low inflation—they may not adequately filter out recent start-of-year price resets. This Global Economy and Markets blog—our fourth—reviews the U.S. inflation data for signs of “residual” seasonality, which may have made inflation look worse than it really was in early 2023 and 2024. If this is true, U.S. disinflation should resume in the months ahead, which would be good news for emerging and frontier markets.
Start-of-year price resets and US disinflation
Recent U.S. inflation data have looked worrisome. Indeed, some believe the “last mile” of disinflation will be harder, as goods disinflation—the primary driver of disinflation in recent years—runs out of steam and services disinflation proves more difficult given the tight labor market. This is certainly in line with recent core CPI (consumer price index) and core PCE (personal consumption expenditures) prints (Figures 1 and 2), which suggest that the momentum driving disinflation has stalled. For example, core CPI inflation on a quarter-over-quarter basis rose to 4.2% in April 2024, up from 3.0% in September 2023. However, this rise repeats a similar pickup in inflation in early 2023, so it potentially reflects “residual” seasonality.1
Figure 1. US core CPI
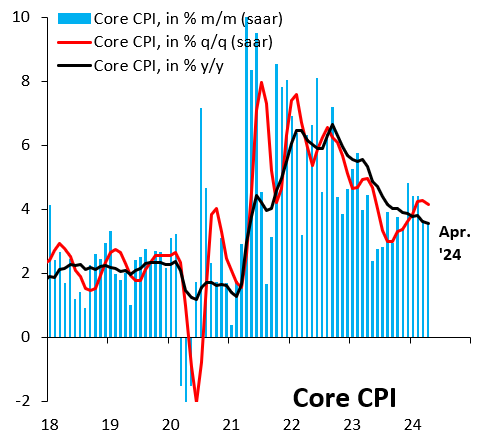
Source: U.S. Bureau of Labor Statistics
Figure 2. US core PCE
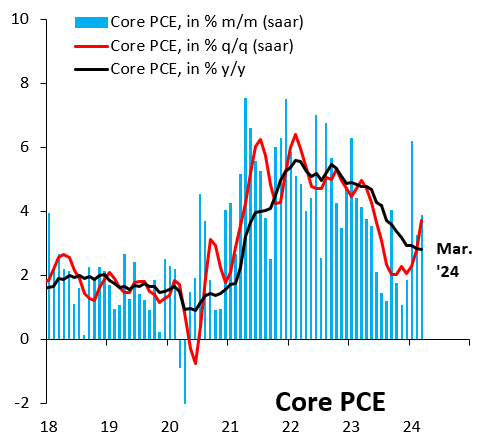
Source: U.S. Bureau of Economic Analysis
We decompose core inflation into its most important drivers, breaking out things like used cars and trucks, a category that saw very high inflation in the immediate aftermath of COVID. Most important, we construct a “core” services inflation category, which excludes owners’ equivalent rent (OER) as well as health care and transportation services. The idea behind this category is to focus on services where start-of-year price resets might be especially important, i.e., run-of-the-mill services that are part of everyday consumption, like recreation or food services and accommodation. Seasonally adjusted month-over-month inflation for core CPI (Figure 3) and core PCE (Figure 4) spiked in Q1 2023 as well as Q1 2024, pointing to “residual” seasonality as a driver behind this year’s rise in inflation. Importantly, half the rise of core inflation in Q1 2024 from the previous six months—whether for CPI or PCE—is due to this “core” services category, consistent with the idea that start-of-year price resets may be playing an important role.
Figure 3. Contributions to US core CPI
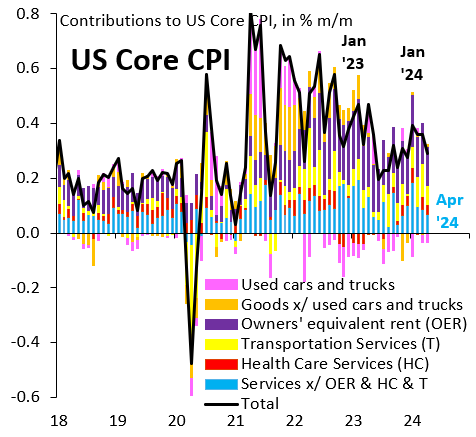
Source: U.S. Bureau of Labor Statistics
Figure 4. Contributions to US core PCE
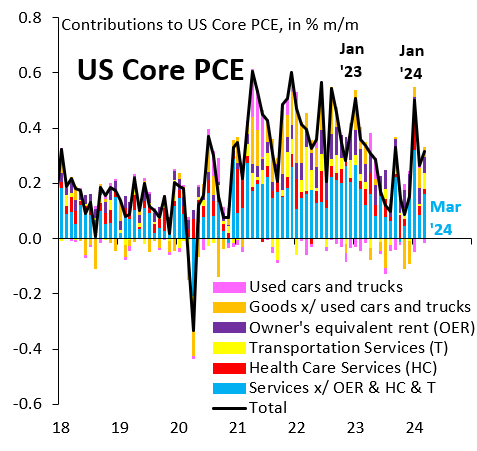
Source: U.S. Bureau of Economic Analysis
It is possible to look at monthly price changes in the CPI and PCE with even greater granularity. We calculate month-over-month inflation for all the most disaggregated items in both indices. For the CPI, we use 133 of the most disaggregated categories, which we seasonally adjust in Haver Analytics. For the PCE, we use seasonally adjusted data from the U.S. Bureau of Economic Analysis for 209 categories. We calculate the combined weight of items with month-over-month inflation above 2% on an annualized basis. We make these inflation generalization indices for the CPI (Figure 5) and PCE (Figure 6) baskets. In both cases, there is a rise in the weight of items with inflation above 2% at the start of 2023 and 2024. Indeed, the rise in inflation generalization looks more severe in early 2024 than in 2023. At the same time, this perspective is arguably less useful than our focus on “core” services above, as start-of-year price resets are likely concentrated in services rather than goods. Figures 5 and 6 also show the same generalization indices using year-over-year inflation for reference.
Figure 5. Inflation generalization: Combined weight of items in US CPI with m/m (saar) inflation > 2%
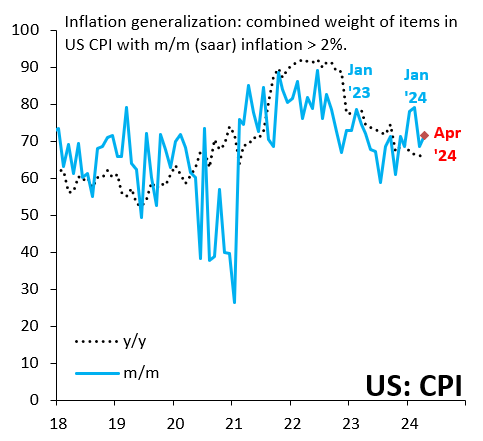
Source: U.S. Bureau of Labor Statistics
Figure 6. Inflation generalization: Combined weight of items in US PCE with m/m (saar) inflation > 2%
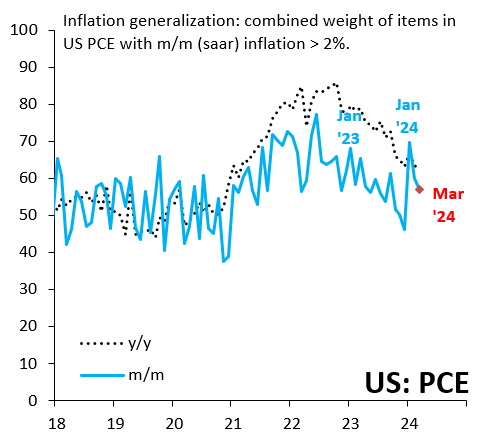
Source: U.S. Bureau of Economic Analysis
Market implications of residual seasonality
If “residual” seasonality turns out to be a material force behind the recent pickup in inflation, it is worth revisiting 2023 for the implications. After high monthly readings for core PCE inflation in the early part of the year, month-over-month inflation slowed sharply in the second half of 2023 (Figure 7). If this year follows in those footsteps, that will reinvigorate market expectations for Fed rate cuts, which have scaled back due to the recent uptick in inflation. This would be good news for emerging and frontier markets, which have struggled to attract nonresident portfolio inflows during the recent inflation scare (Figure 8). More broadly, if U.S. inflation slows going forward, this will boost risk assets and tend to weaken the dollar on a broad basis.
Figure 7. Start-of-year price reset effects in core PCE m/m inflation since COVID-19
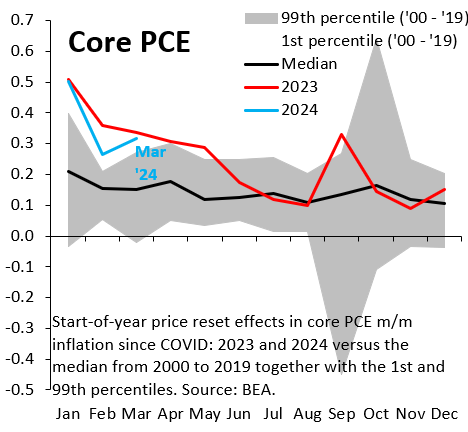
Source: U.S. Bureau of Economic Analysis
Figure 8. Foreign portfolio flows into emerging market stocks and bonds
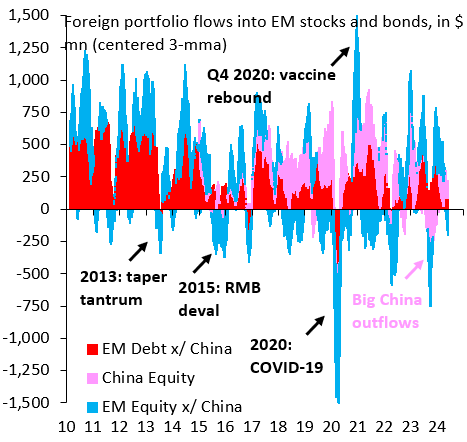
Source: Bloomberg
Author

Related Content

-
Footnotes
- A recent note by the Richmond Fed concludes that “residual” seasonality is not an issue over long horizons in core inflation. That however does not preclude “residual” seasonality in recent years, if the seasonal factors have been conditioned largely on the pre-COVID period of low inflation.
The Brookings Institution is committed to quality, independence, and impact.
We are supported by a diverse array of funders. In line with our values and policies, each Brookings publication represents the sole views of its author(s).

Commentary
Start-of-year price resets and US disinflation
May 23, 2024