

This post updates with complete year-end 2022 data the External Wealth of Nations database [Excel download], which assembles data on external claims and liabilities of economies around the world. The database is described in more detail in a series of papers (Lane and Milesi-Ferretti 2001, 2007, 2018), and in a companion post. The data are annual for the period 1970-2022 and cover 212 countries and territories, plus the euro area and the Eastern Caribbean Currency Union (ECCU). A blog published in October 2023 describes the evolution of net creditor and debtor positions during 2022, highlighting the role of global inflation, declining stock prices, and rising energy prices in shaping that evolution.
Global cross-border assets and liabilities declined in 2022, both in nominal U.S. dollar terms and as a share of global GDP. Figure 1 shows this decline for global cross-border liabilities, dividing countries into three groups: financial centers, advanced economies excluding financial centers, and emerging and developing economies excluding financial centers. Financial centers are economies for which international financial intermediation (as opposed to end-use of funds) is the main cross-border financial activity. They include large economies such as the United Kingdom, the Netherlands, Switzerland, and Ireland, as well as smaller financial centers such as Luxembourg, Bermuda, and the Cayman Islands. The decline was common across regions.
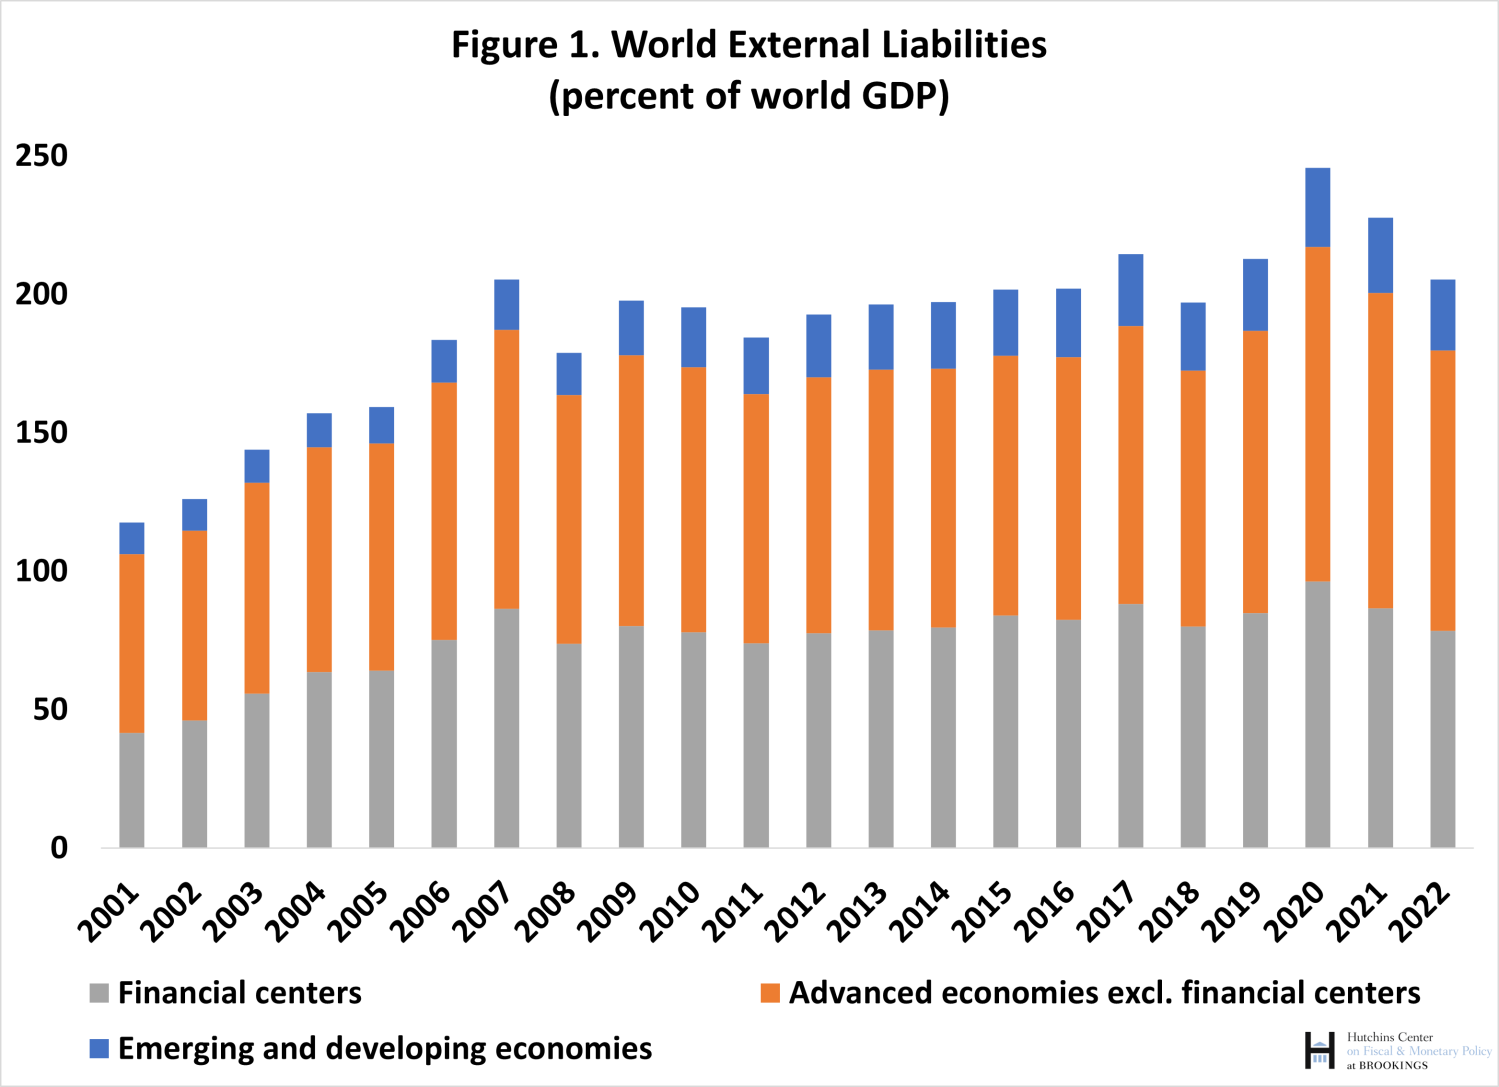
Three main factors triggered this decline: declining asset price values, global inflation, and weak financial flows.
Asset prices
The decline in asset prices reflected lower worldwide stock prices and the decline in long-term bond prices because of higher interest rates. As a result of these asset price declines, the value of cross-border holdings of portfolio equity (stocks and investment fund shares) and portfolio debt (bonds) fell. Lower stock prices also reduced the value of foreign direct investment (FDI), albeit to a lesser extent, given that not all countries report market-value estimates of FDI, reflecting the difficulty of calculating such market value for unlisted affiliates of multinational corporations.
Inflation
Global inflation increased nominal GDP, thus reducing the ratios of asset values to GDP. It also contributed indirectly to the decline in asset prices through its impact on interest rates.
Financial flows
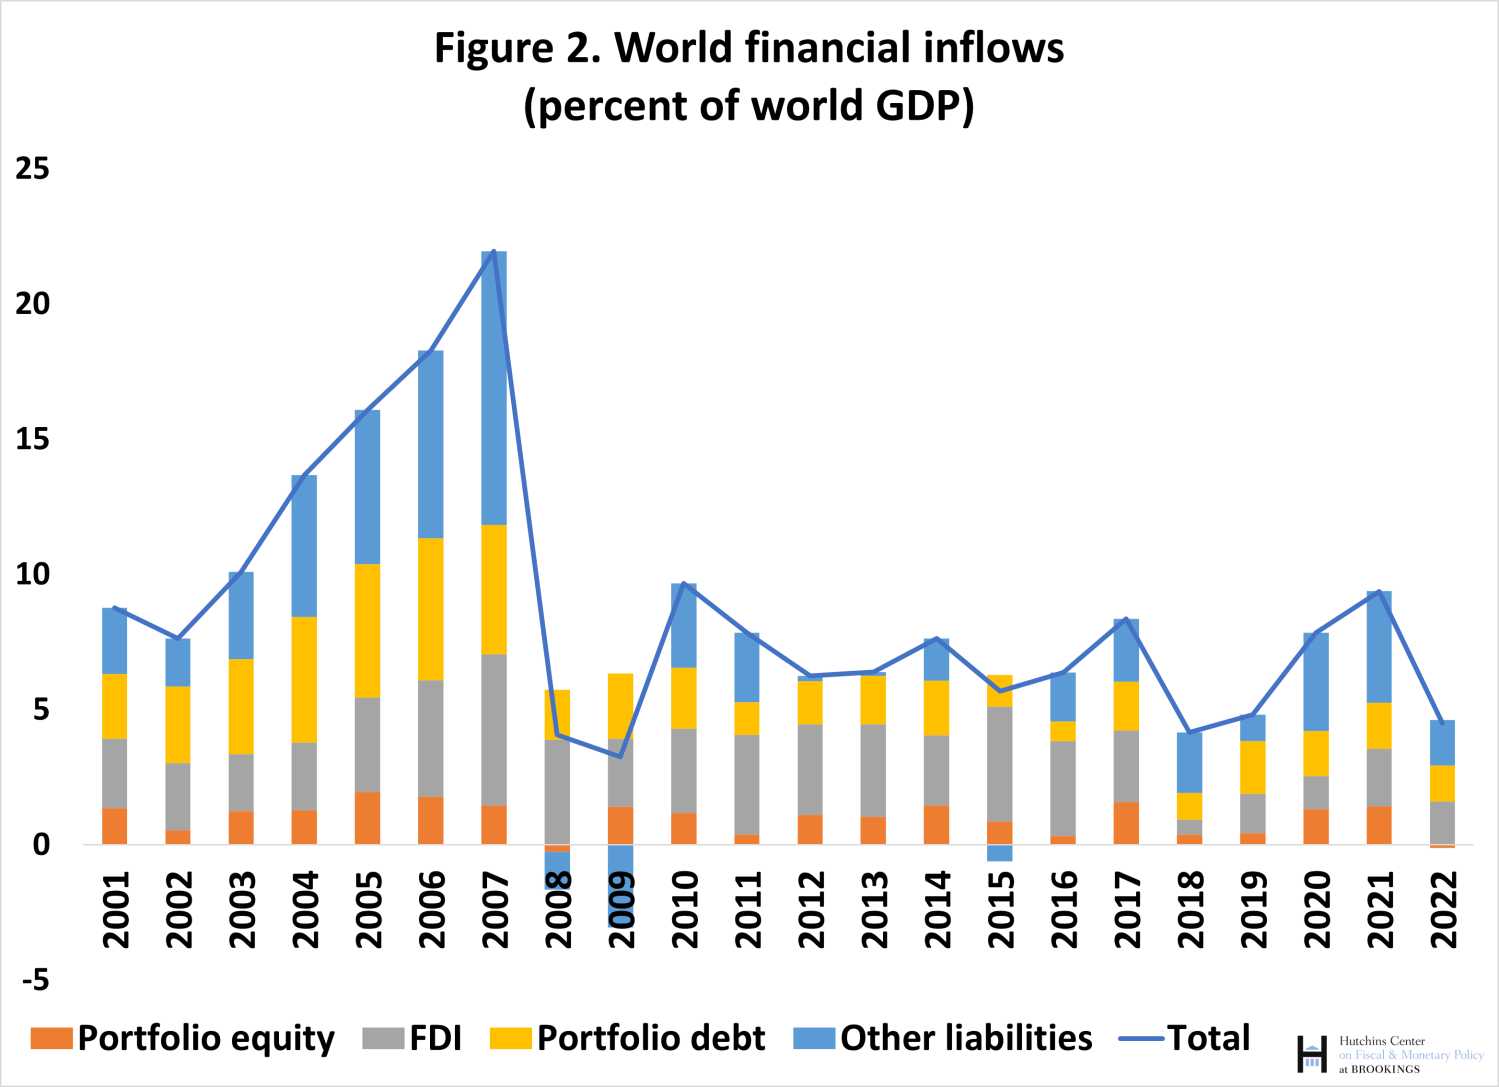
Financial flows in 2022 in U.S. dollar terms were 50% lower relative to their 2021 level. As a ratio of global GDP (Figure 2) they fell below 5%, compared to an average of 7% since 2010. Portfolio equity and FDI flows were particularly weak. Rising global risk aversion and geopolitical tensions played a role—flows to China were slightly negative in 2022, compared to $670 billion the year before.
We now dig deeper into the decline in global external assets and liabilities by focusing on different asset categories and regional patterns.
Global FDI
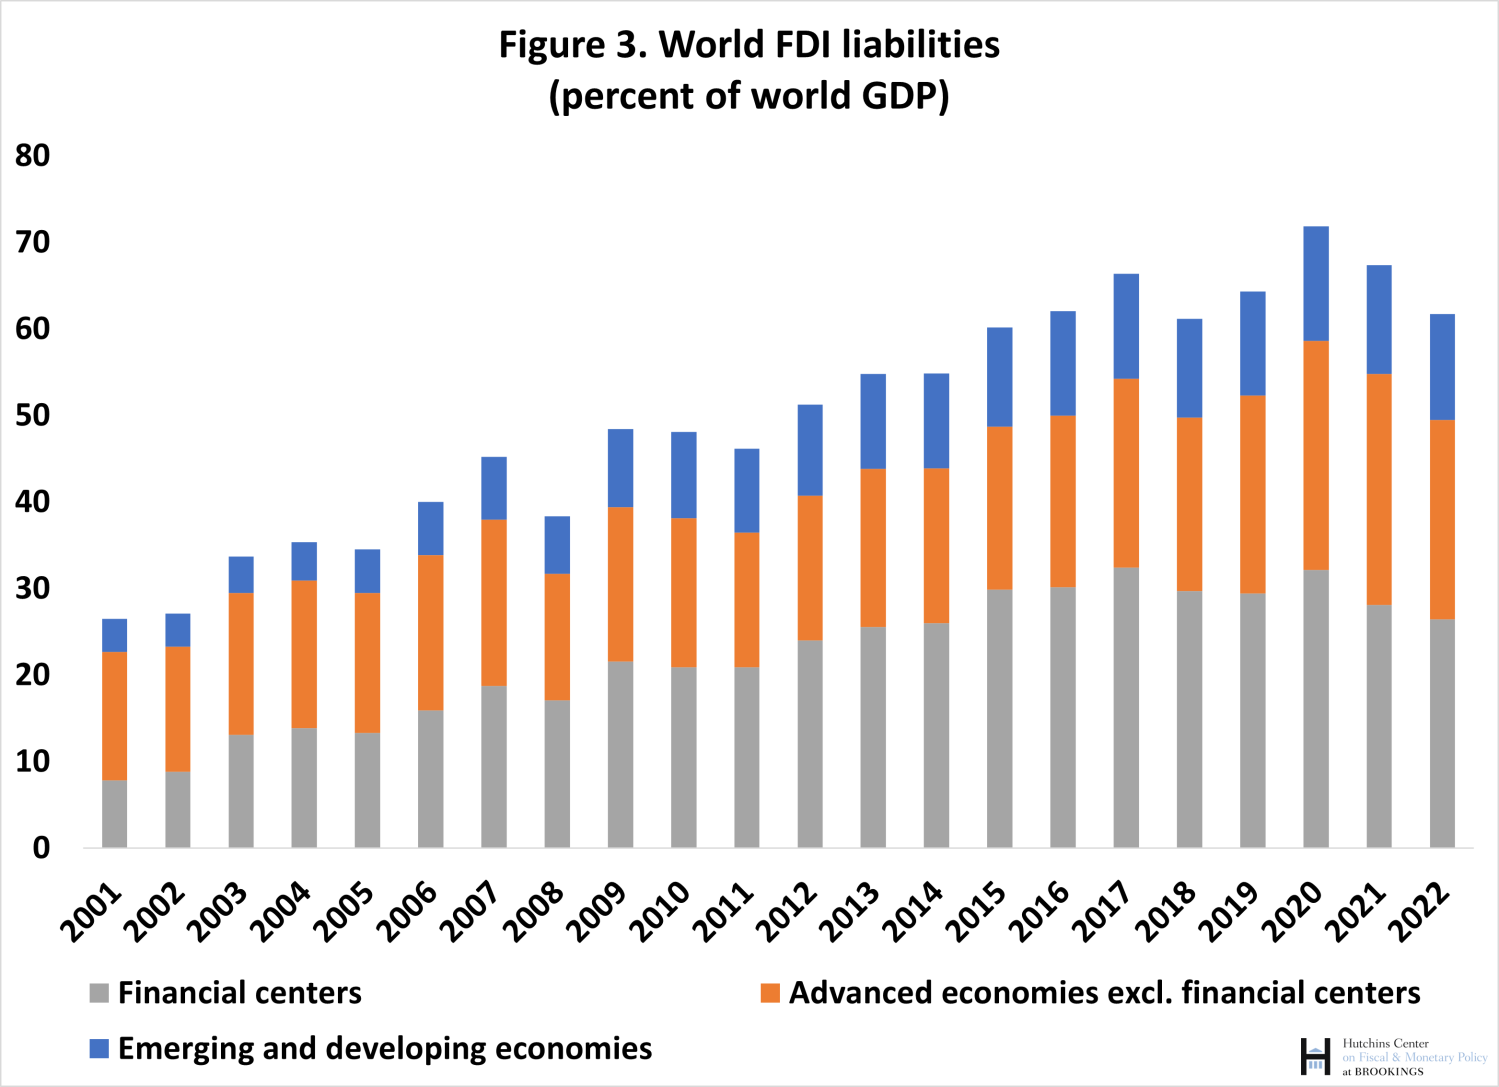
Figure 3 shows global FDI liabilities by country group, scaled by world GDP. FDI in financial centers (grey bars) is very important because multinational enterprises (MNEs) actively use (mostly financial) subsidiaries in those centers to hold intangible assets, such as intellectual property, and more generally for tax and regulatory reasons. But the figure also shows how FDI positions in financial centers have been declining since 2017—by some 6 percentage points of global GDP. This decline reflects to an important extent the unwinding of special purpose entities1 domiciled in Luxembourg and the Netherlands, a development associated with the U.S. tax reform of 2017, as well as increased pressure on countries and MNEs to comply with the Base Erosion and Profit Shifting (BEPS) project of the OECD and the G-20. In contrast, positions in advanced economies excluding financial centers as well as in emerging markets and developing economies have remained broadly stable as a ratio of global GDP since 2017, even though the fall in stock prices in 2022 reduced the size of inward FDI in countries such as the U.S. that use such prices to estimate FDI at market value. The often-mentioned impact of increased geopolitical tensions and fragmentation on global FDI is not as clearly visible with such aggregate data, and studying it requires more granular bilateral information on country-to-country FDI flows and positions.2
Global portfolio equity
Portfolio equity liabilities, depicted in Figure 4, include the shares of domestic firms owned by nonresidents (mostly large firms listed in the main world stock markets) as well as shares in investment funds (including hedge funds) owned by nonresidents, regardless of whether such funds invest in equities, bonds, or other financial instruments. Hence countries with large stock markets open to foreign investment are heavily represented in the global total—for instance, the global share of equity liabilities accounted for by holdings in the U.S. exceeds 25% in 2022 (over half of the orange bar in Figure 4). Given that the investment fund industry is domiciled to an important extent in financial centers such as Ireland, Luxembourg, and the Cayman Islands, financial centers account for a large share of global portfolio equity liabilities. Their share of portfolio equity assets is instead much lower because investment funds hold a diversified set of financial instruments, not just equity.
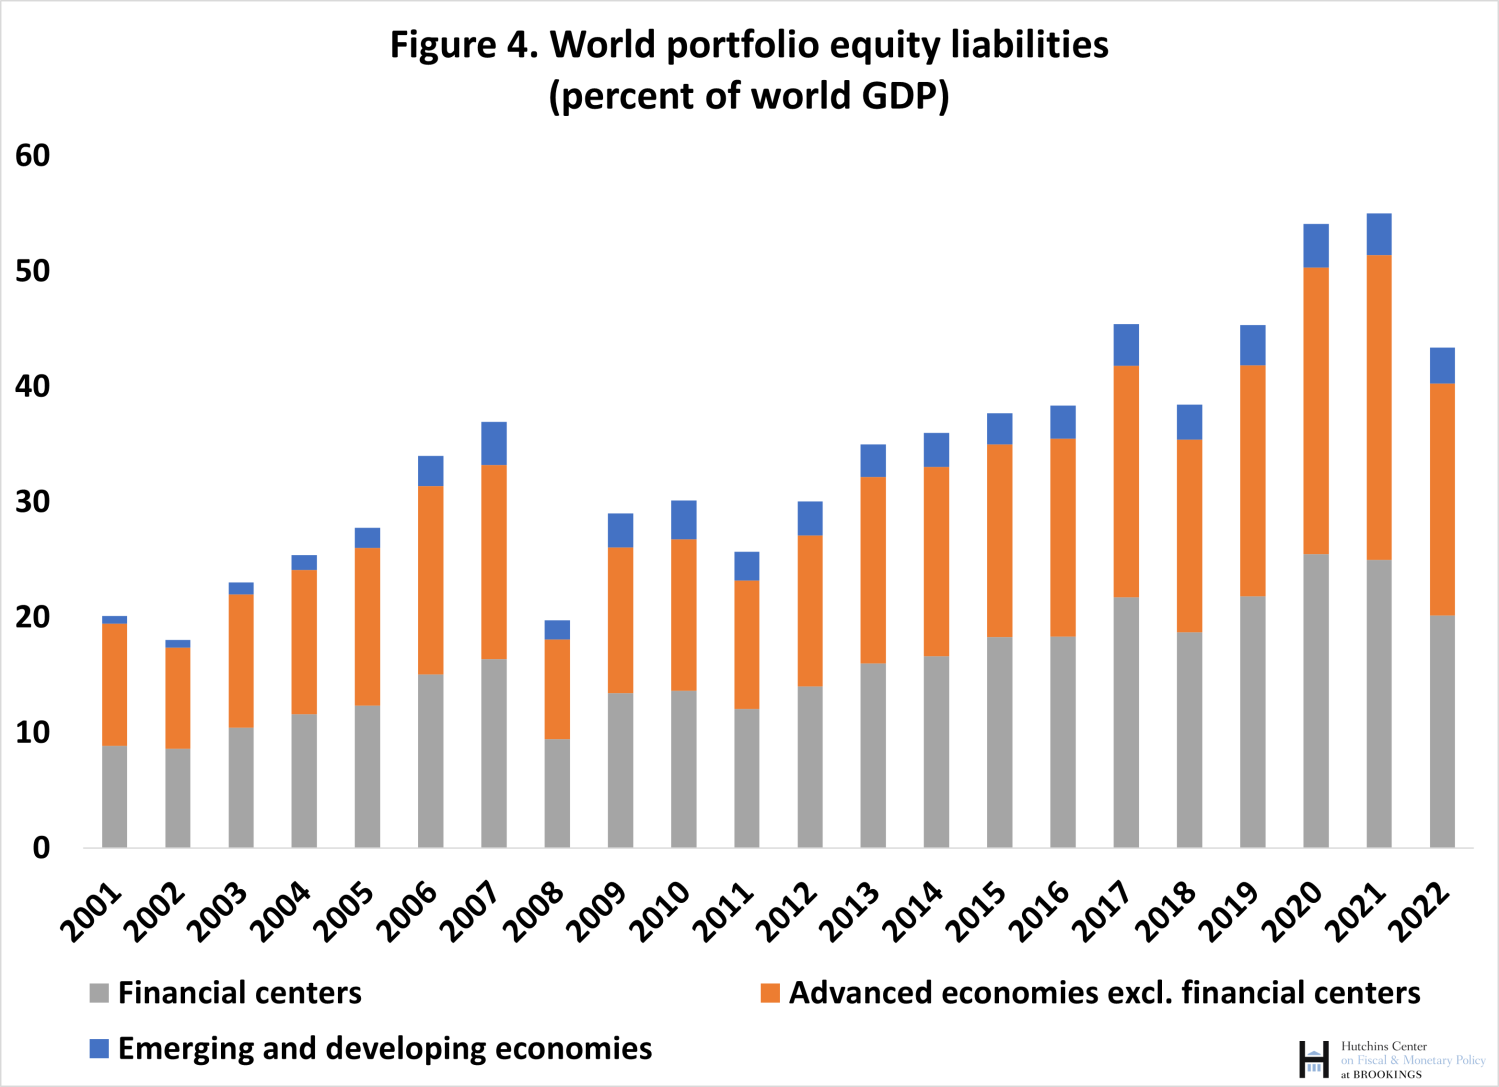
The reason for the decline in 2022 is a 20% fall in world stock prices in U.S. dollars between end-2021 and end-2022 (measured with the MSCI all-countries world stock price index), while new net purchases of foreign shares during 2022 dried up (see Figure 2). With the strong stock market recovery in the latter part of 2023, U.S. share prices at end-December were only marginally lower than at the end of 2021, and hence the value of global portfolio equity holdings is poised for a strong rebound in 2023.
Global portfolio debt (bonds)
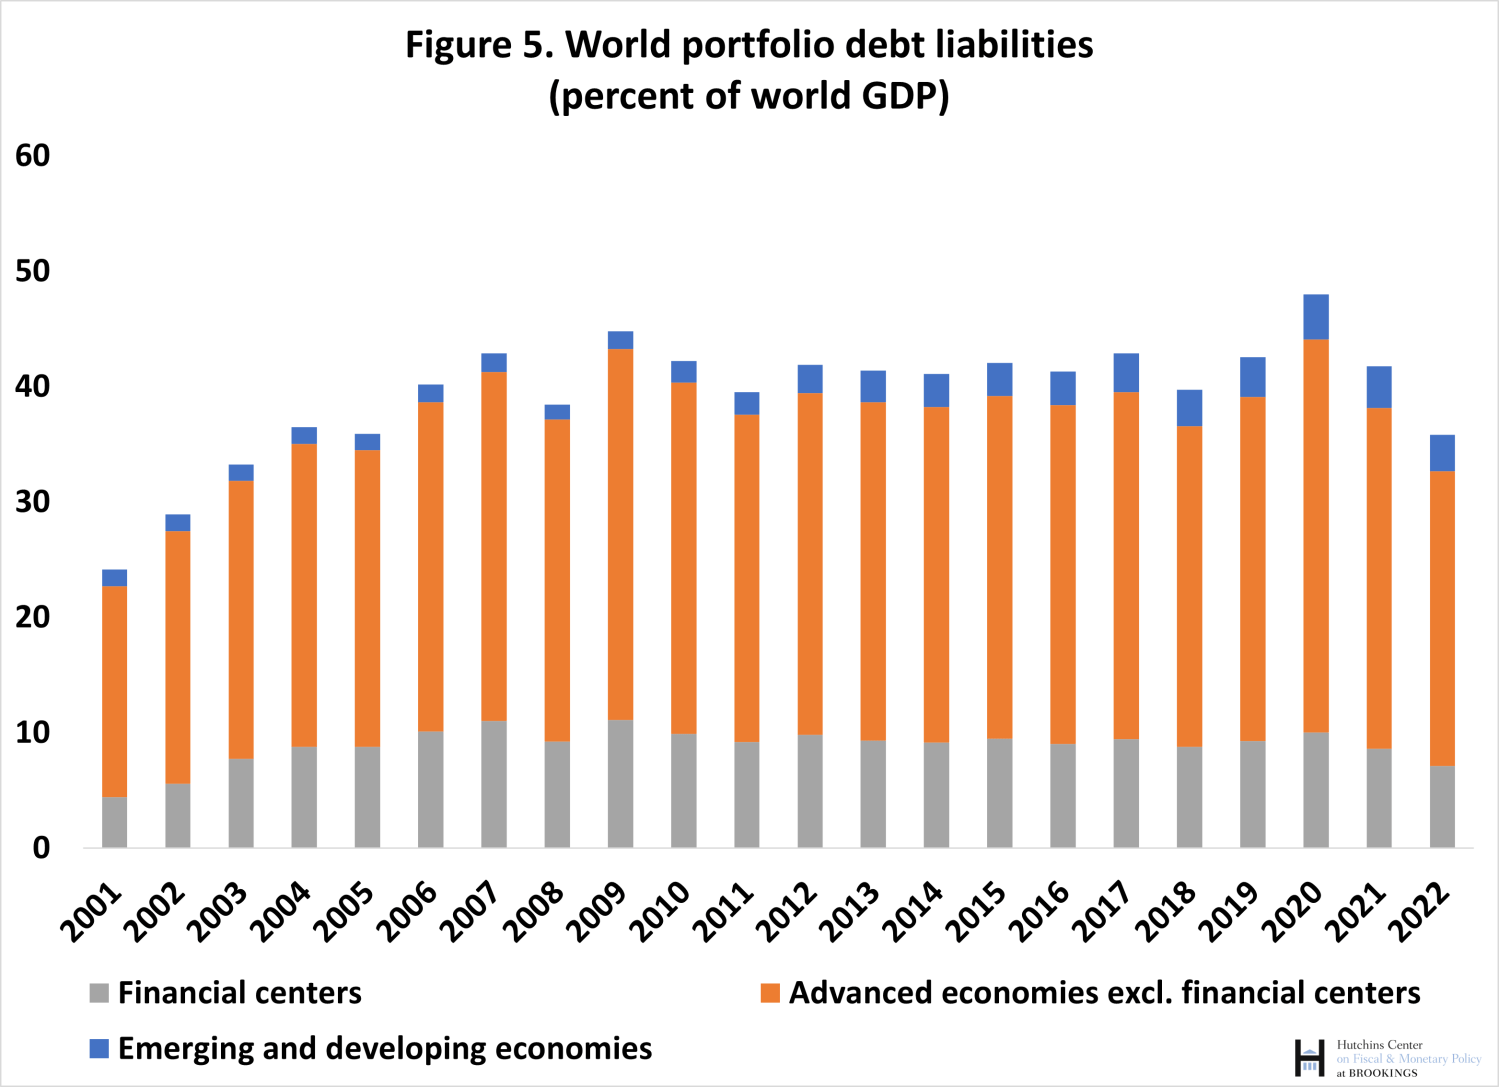
Portfolio debt securities are held both by private investors and official ones, such as central banks and sovereign wealth funds. The main issuers are advanced economies, with financial centers representing a smaller share of the global total compared to portfolio equity. Given the size of its bond market and the use of U.S. securities, especially Treasuries, as foreign exchange reserves by central banks around the world, the U.S. plays a particularly important role. Holdings of U.S. bonds ($12.7 trillion at end-2022) account for over a third of global holdings of foreign bonds by private and official investors.
During 2022 the market value of longer-term bonds declined sharply as a result of higher global interest rates (Figure 5). U.S. data provides a vivid illustrative example: in 2022, nonresidents’ net purchases of U.S. bonds totaled $870 billion, yet the value of the stock of their U.S. bond holdings at the end of 2022 was $1 trillion lower than at end-2021 because of higher interest rates.
Global “other investment”
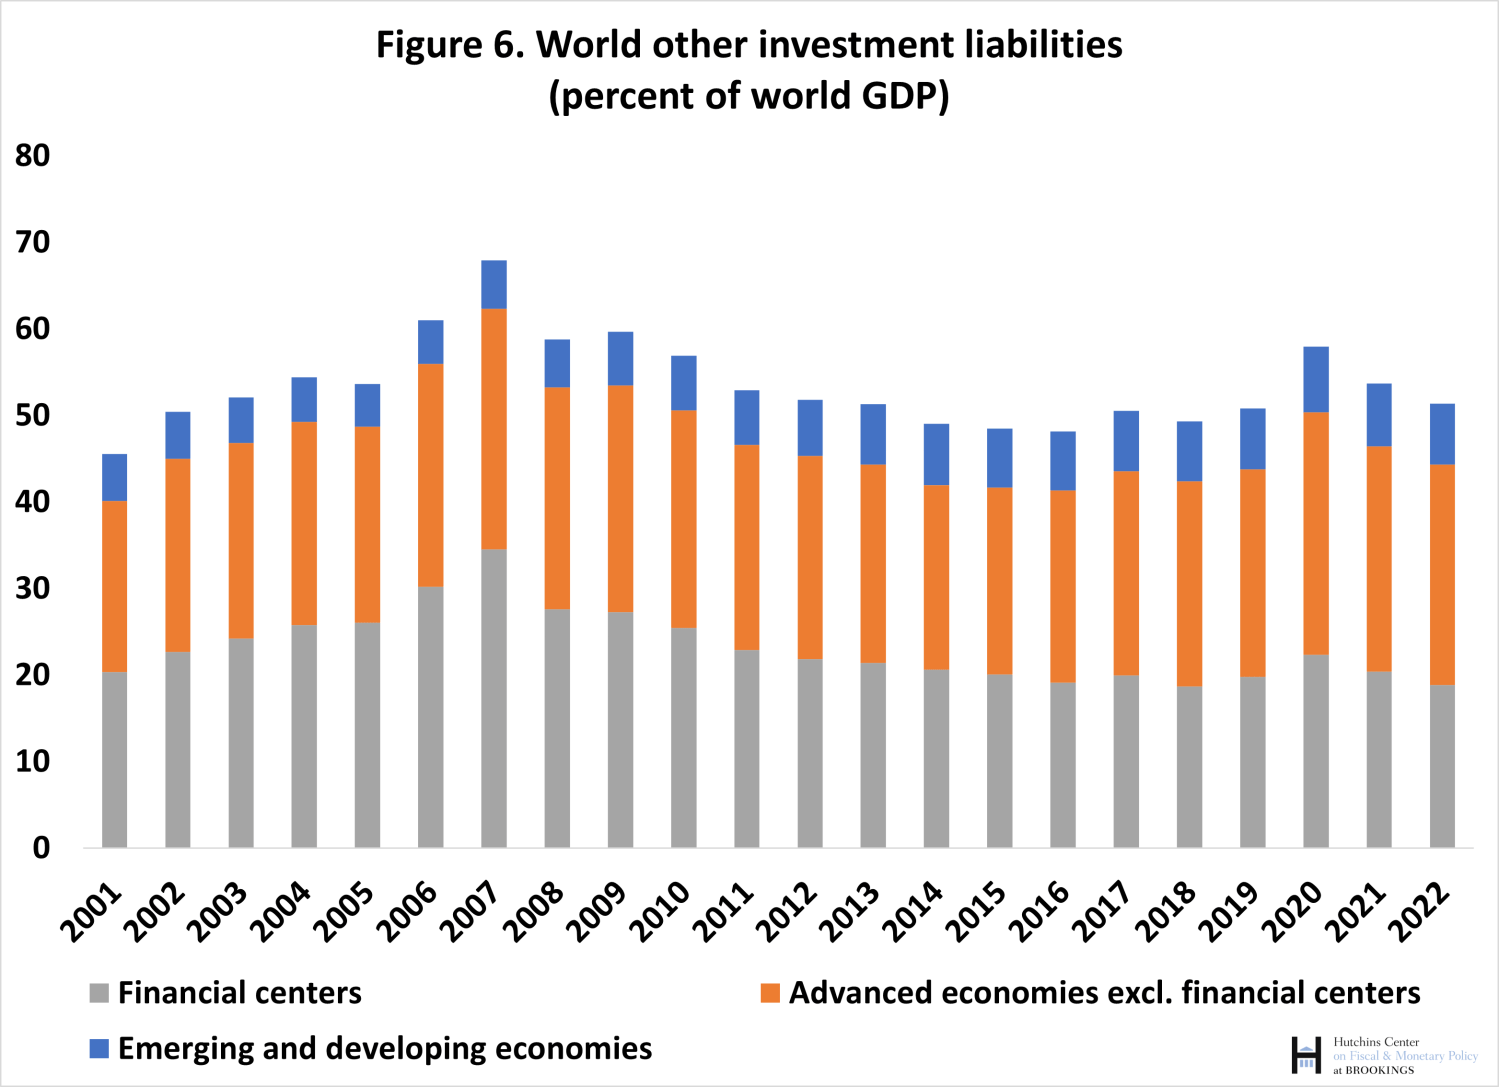
This residual category includes primarily financial instruments, such as loans, deposits, and trade credits. Bank activity represents the majority of such holdings and transactions, but, for instance, loans by official creditors are also included. Given that the value of these financial instruments is generally not marked to market, fluctuations are driven primarily by financial flows or changes in exchange rates.
The data are shown in Figure 6. There is a trend decline in cross-border holdings for a number of years since the peak in 2007 prior to the global financial crisis, reflecting the retrenchment in cross-border activity by global banks, especially from Europe. The decline since 2020 reflects primarily the impact of rising nominal GDP (fast growth in 2021 and inflation in both years).
In sum, year-to-year fluctuations in global external assets and liabilities are primarily driven by changes in asset prices, which were particularly large in the past 3 years. During periods of asset price declines, such as 2022, financial flows also tend to wane, thus enhancing the impact of asset price changes. Developments in major financial markets—the United States in primis—play a crucial role, particularly in portfolio instruments such as stocks and bonds. The size of holdings in emerging markets and developing economies is relatively small (with the partial exception of FDI), especially when compared to their weight in global GDP (over 40% at market exchange rates and close to 60% at purchasing power parity). Financial centers such as Ireland, Luxembourg, the Netherlands, and the United Kingdom loom large in virtually all categories of external sector statistics given their role as financial intermediaries. Shocks to that intermediation role can trigger large movements in financial flows and positions, even though the macroeconomic repercussions are modest. This makes it harder to provide structural interpretations to shifts in external sector data without a careful examination of their potential sources.
Author
Related Content


-
Acknowledgements and disclosures
The Brookings Institution is financed through the support of a diverse array of foundations, corporations, governments, individuals, as well as an endowment. A list of donors can be found in our annual reports published online here. The findings, interpretations, and conclusions in this report are solely those of its author(s) and are not influenced by any donation.
-
Footnotes
- Special purpose entities are pass-through corporations established for tax and regulatory reasons. They have virtually no staff and typically hold assets and liabilities vis-à-vis countries different from their host.
- See, for instance, Chapter 4 of the IMF’s World Economic Outlook, Spring 2023.
The Brookings Institution is committed to quality, independence, and impact.
We are supported by a diverse array of funders. In line with our values and policies, each Brookings publication represents the sole views of its author(s).