When it comes to school finance, researchers have mainly focused on questions about how much money schools and districts receive.
But what about the mechanics of how those amounts are determined—does that matter? Does it change school district behavior?
In this piece, I attempt to unpack these questions by comparing school district staffing levels in two states, California and Washington, which have very similar funding levels but very different funding mechanisms. California uses a student-based formula that funds school districts based on the number and types of students they serve. In contrast, Washington’s formula is known as a “resource-based” model. It derives a total funding amount for districts based on assumptions around how many teachers and other staff a district might need, and how much money those staff should earn, given the number and type of students they serve.
Theoretically both models could be structured and weighted to deliver the same amount of money to districts, and districts in both states have the flexibility to staff their schools as they see fit.
But I find that staffing decisions look very different across the two states. Although the two states have similar staffing levels per student, Washington schools tend to have more teachers whereas California schools employ many more janitors, bus drivers, and cafeteria workers. California districts also look different from each other, whereas Washington districts tend to staff their schools in similar ways.
Although this analysis focuses on the staffing decisions in two states, about one-third of states continue to use a resource-based funding model, like Washington does, for at least a portion of their allocations. In addition, the vast majority of school districts use resource-based models to fund their schools. Advocates in favor of a student-based methodology argue that it provides greater flexibility for on-the-ground leaders to make staffing choices that are tailored to their unique needs or goals. This analysis provides suggestive evidence that the mechanics of how money gets allocated to schools can influence the decisions district leaders make.
Comparing the California and Washington funding formulas
Since 2013, California has funded its school districts through a student-weighted formula known as the Local Control Funding Formula (LCFF). Districts receive a base amount for each student they enroll, plus extra funding for each high-need student and “concentration” funding if they serve a high percentage of high-need students. Districts have to work with their local community to craft spending plans, but they have wide discretion over how the money gets spent.
Washington has a very different process for funding its school districts. Its resource-based formula delivers money to districts based on the state legislature’s assumed staffing levels. After calculating how many students a district serves, the state assigns precise position counts, such as 28.53 students per teacher in grades seven and eight, and 28.74 students per teacher in grades nine through 12. Funds from local sources are separate from these state funds, which can be used to hire even more teachers or other support staff, though these state allocations tend to be very influential, as I show below.
After determining the position counts, the Washington formula multiplies those counts by its assumed salary figures by role to arrive at a total base funding amount for each district. The state’s assumptions for salaries and benefits add more layers of potential standardization. The salary calculation starts with a “maintenance” figure, the average salary level earned by educators in that role in the prior year. State legislators occasionally increase the salary assumptions by a fixed percentage statewide (ex: 2% in 2019-20). District totals are adjusted based on regional cost differences, and they also receive a precise dollar amount per employee to provide health insurance benefits (for example, $11,968 in FY 2021).
Theoretically, the state says the resulting figures, “shall be for state allocation and equalization purposes only and shall not be construed as mandating specific operational functions of local school districts . . .” But in practice, a handful of other state policies reinforce the funding formula and put pressure on districts to mirror its assumptions. Those policies include:
- Minimum and maximum class sizes in grades K-3, and additional state funding in direct proportion to the district’s actual staffing levels.
- A minimum salary requirement for beginning teachers and teachers with at least five years of experience, and a maximum salary. Combined, these limits effectively anchor Washington educator salary scales at the state’s recommended levels.
- A requirement for districts to submit monthly staffing and salary information, at the employee level, which the state Department of Public Instruction uses to publish comparisons between funded and actual staffing levels and funded versus actual salaries, at the district and school levels. The results of these comparisons are for informational purposes only, but they serve as an informal check on district leaders to staff their schools in line with the state’s recommendations.
In other words, California and Washington fund their schools in very different ways. And anecdotally, Washington district leaders speak publicly as if the state formula does constrict their staffing choices. The next section looks at the empirical data on how the states differ.
Comparing California and Washington school district staffing
To compare funding and staffing levels in the two states, I used pre-pandemic data from 2018-19 from the Common Core of Data (CCD). I removed charter schools and small districts serving fewer than 1,000 students in order to minimize the effects of very small districts affecting the results. I also converted raw staffing numbers into a ratio of full-time equivalent staff per 1,000 students to allow for easier comparisons of staffing levels across districts of varying size.
At a high level, Washington school districts spend slightly more per pupil than California districts do, but the differences are small ($16,328 versus $15,812, respectively). Districts in the two states are also similar on total staffing levels, although California districts employ slightly more staff per student (91 staff per 1,000 pupils in Washington versus 96 in California).
Figure 1 shows a box plot of total staffing levels across the two states. There are fewer outlier districts across Washington districts (in orange), and staffing levels are more homogenous within Washington than they are across California districts (in blue).
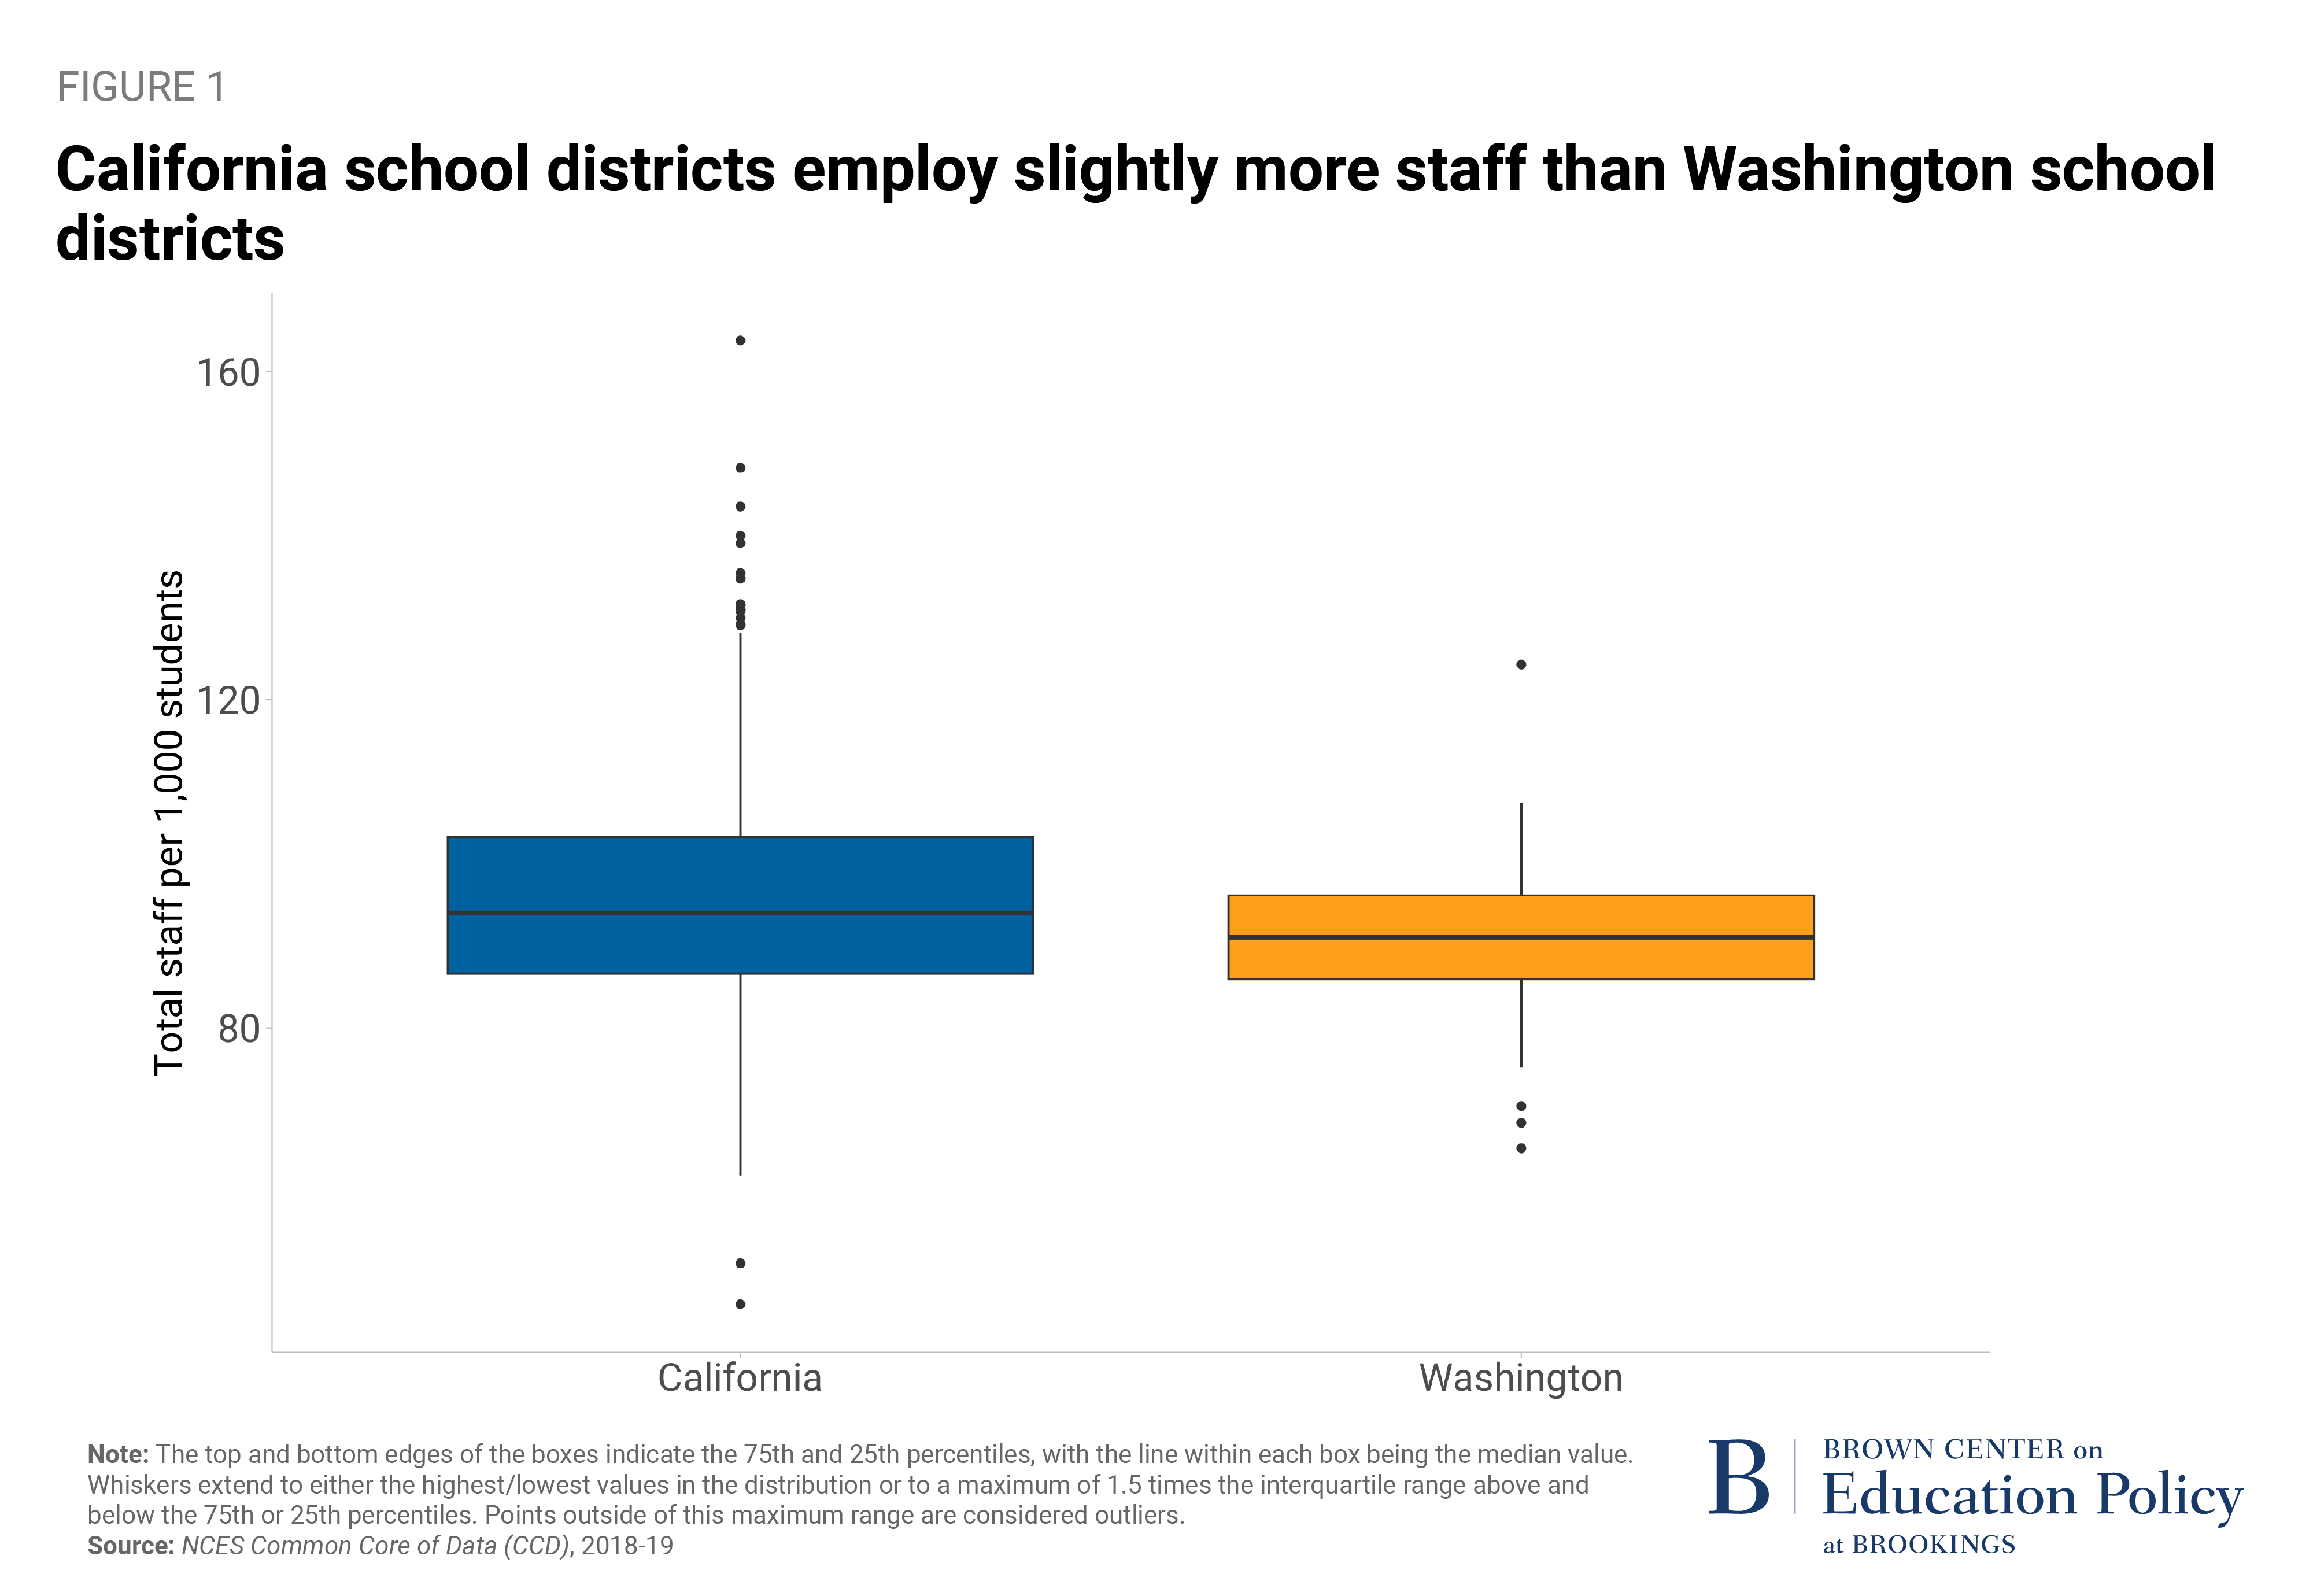
It’s possible these differences are driven by the dollar amounts that districts receive, or the sheer number of districts in California versus Washington, or by larger systemic or cultural factors rather than the state funding formula. For instance, the variance among California school districts in terms of revenue and expenditures is higher than it is in Washington.
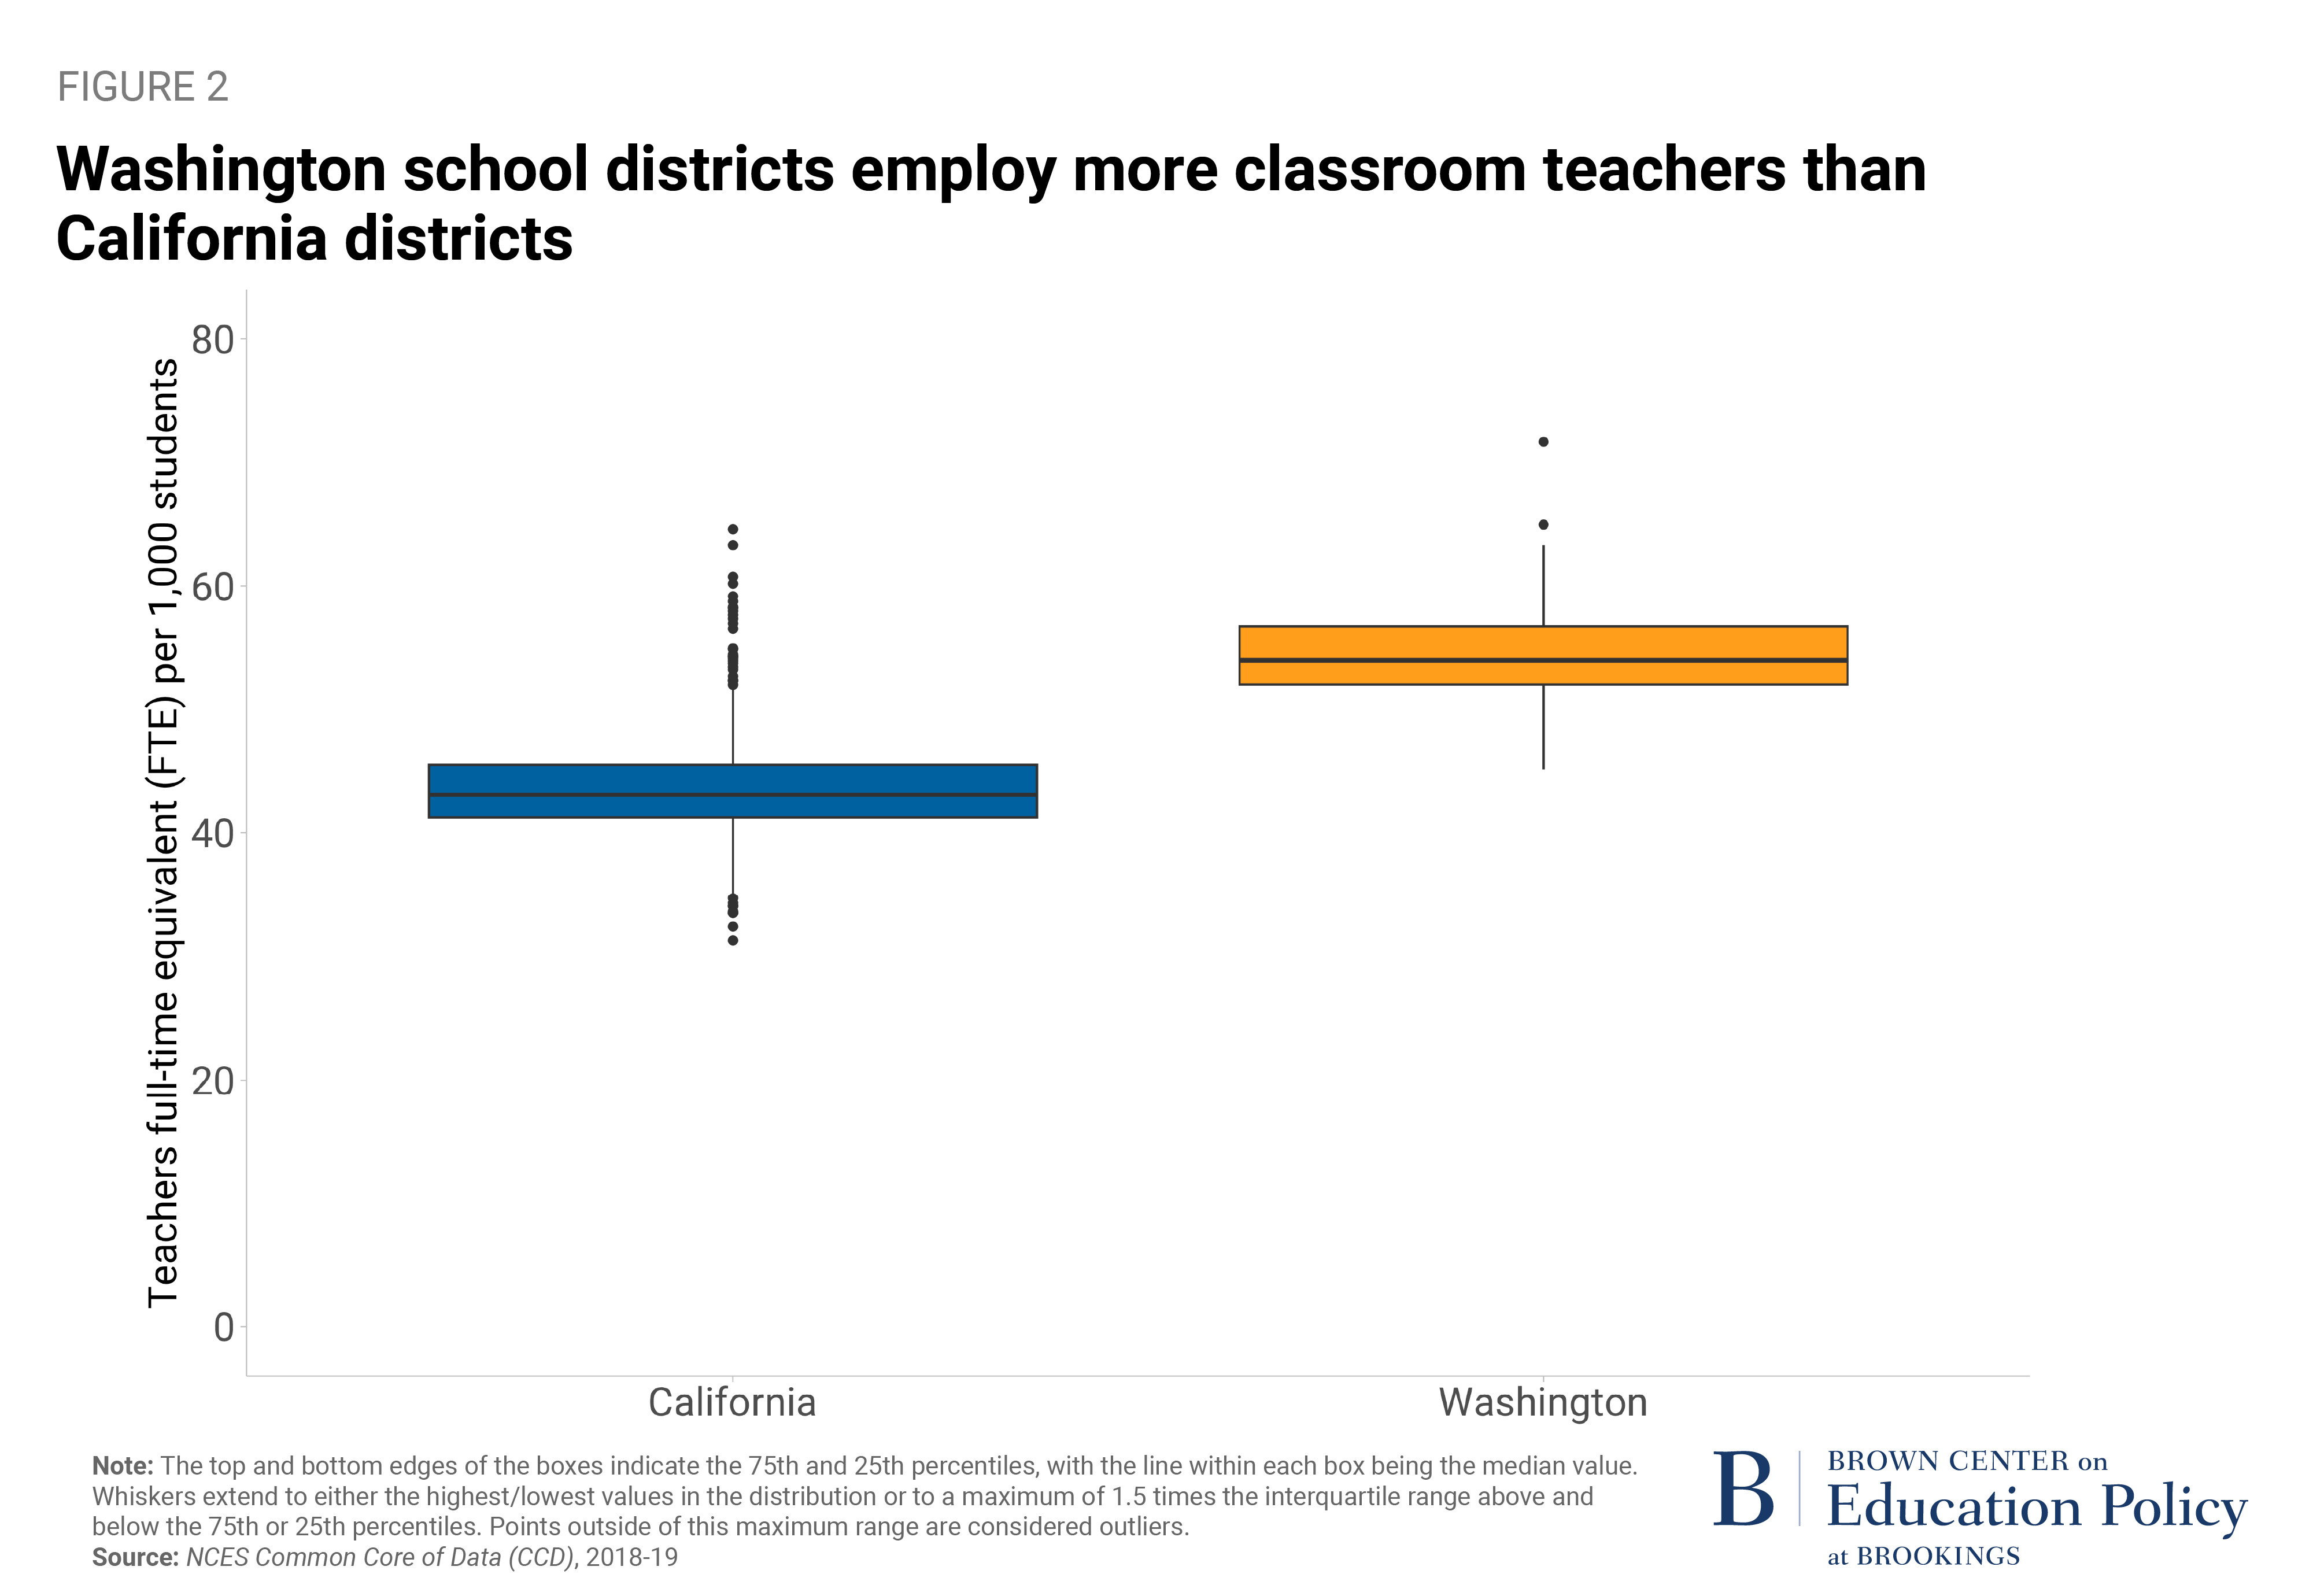
But California school district staffing looks differently than Washington in two main staffing areas. One is classroom teachers. Figure 2 shows the same box plot ratios just for classroom teachers. Despite lower staffing levels overall, Washington districts employ more teachers (about 11 more teachers for every 1,000 students). California also has more outlier districts, with either much higher or much lower teacher staffing levels.
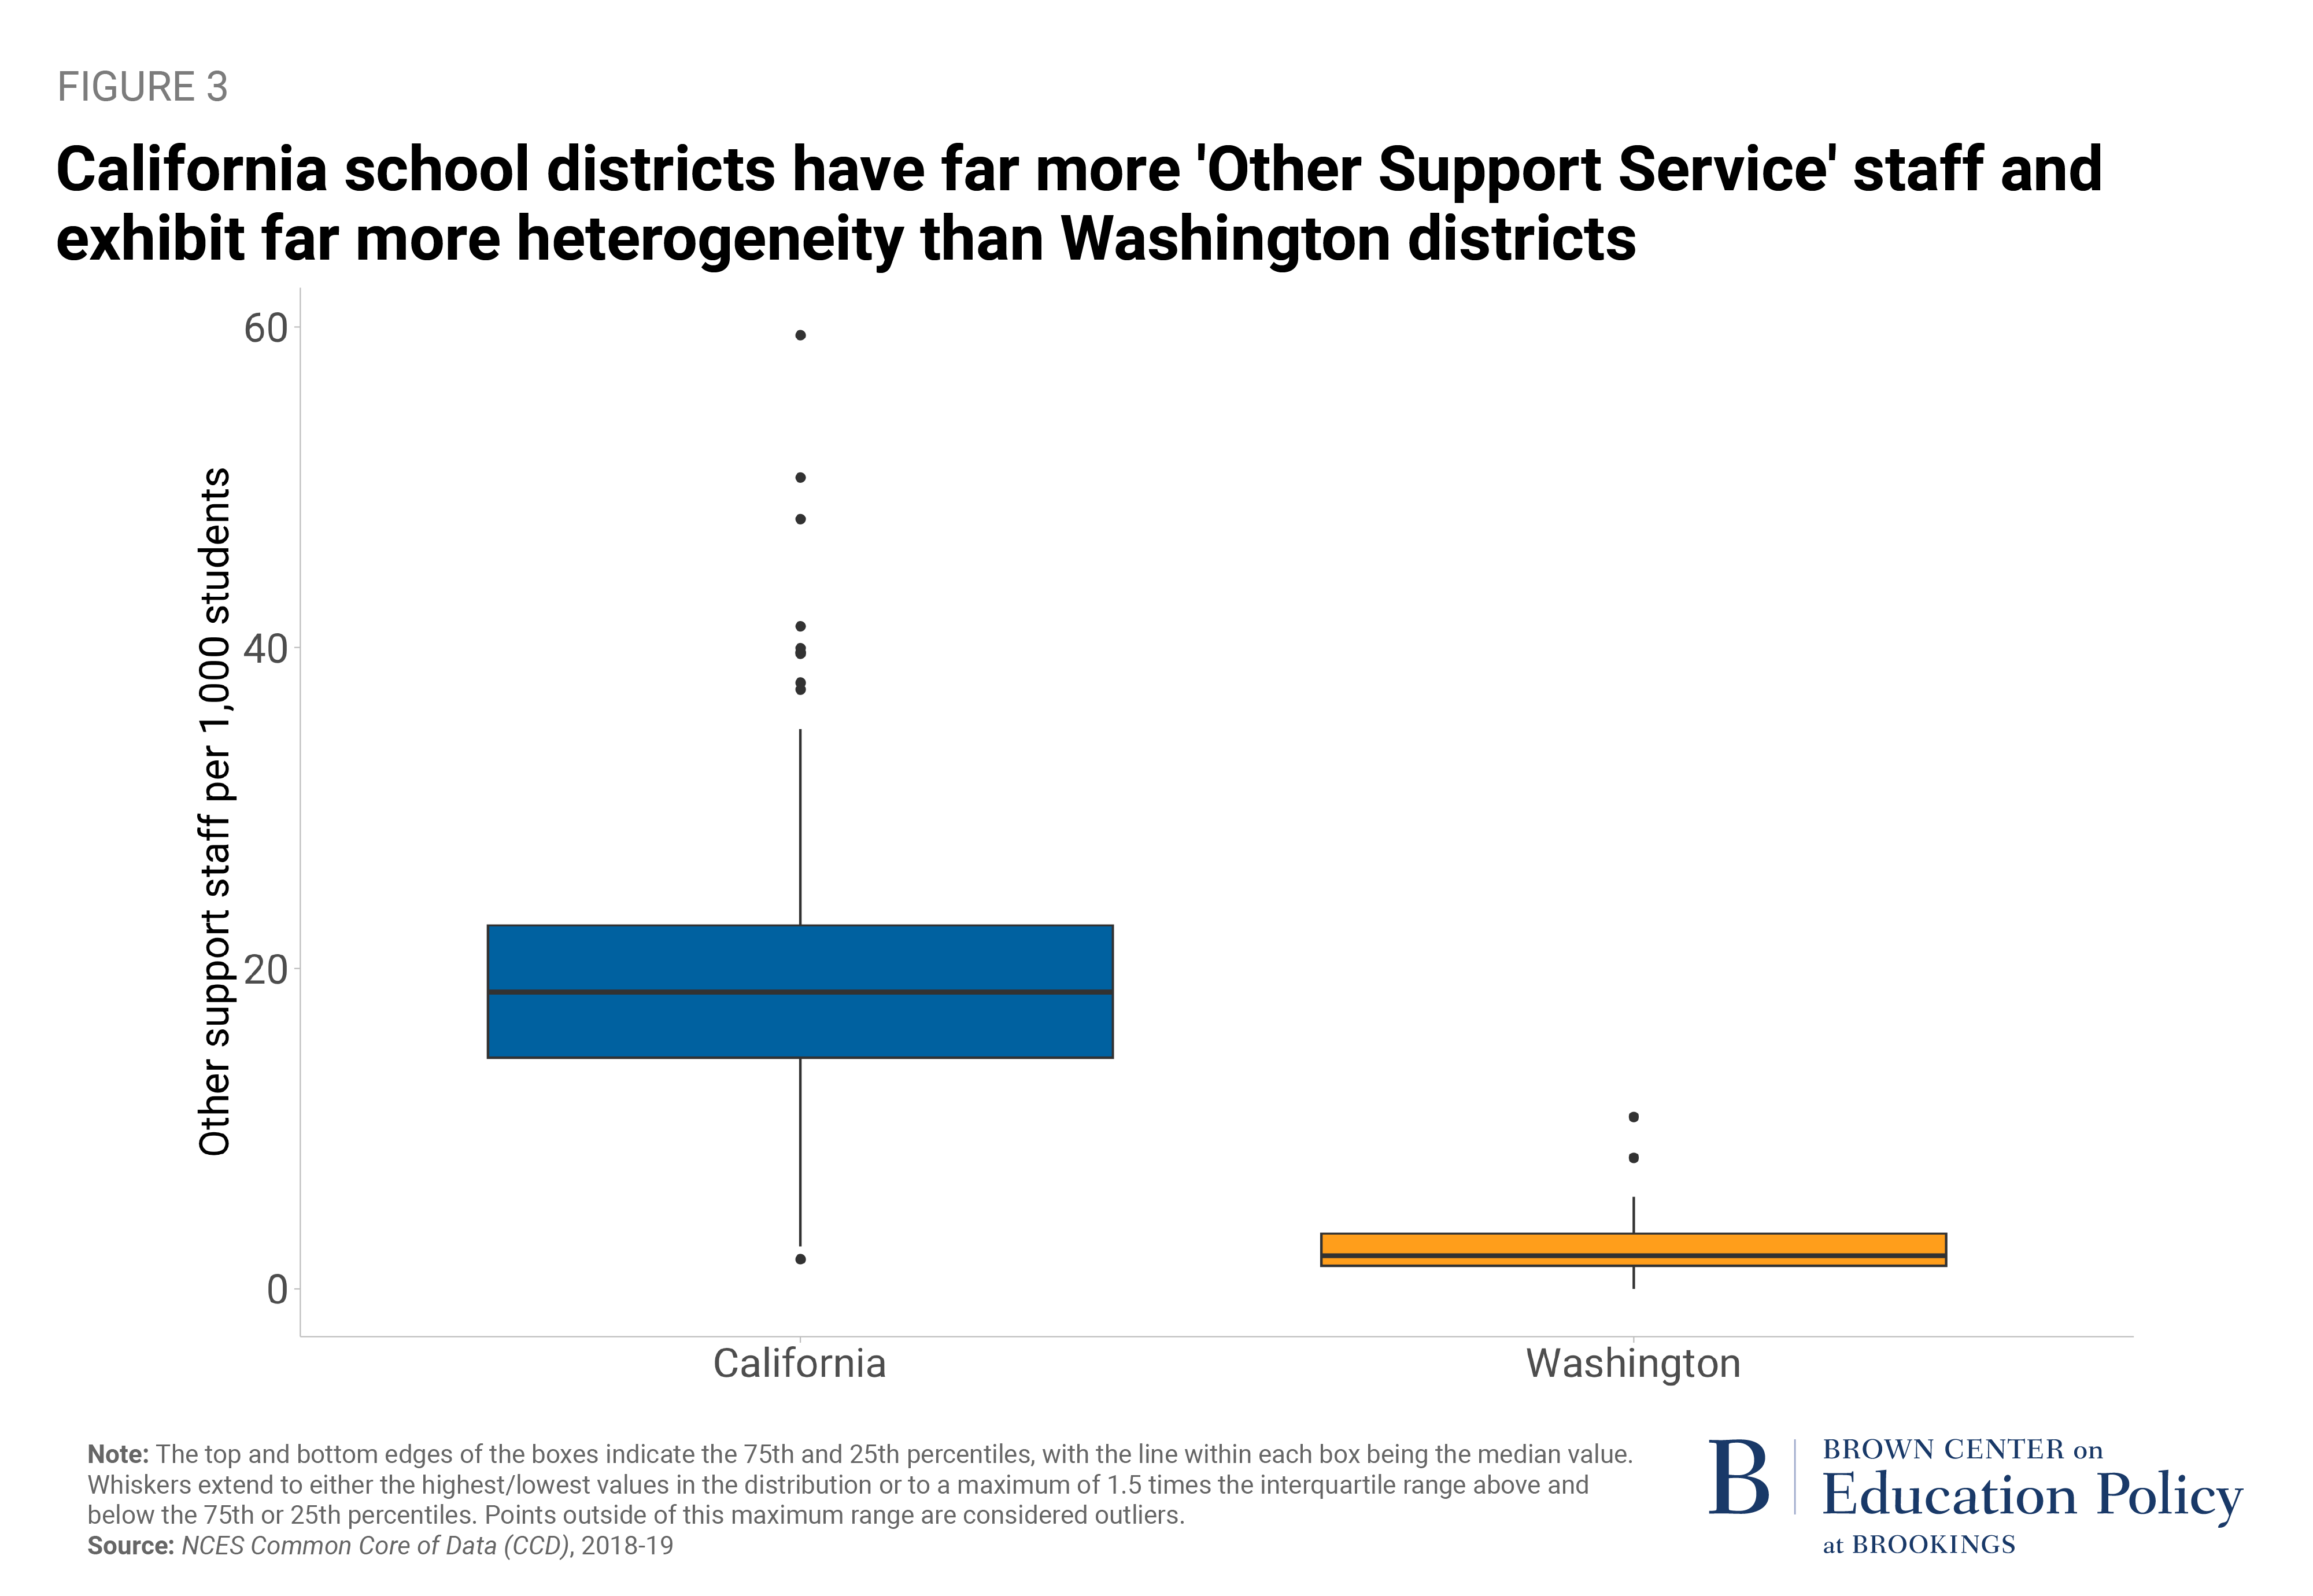
The other large difference across the two states comes from a category the CCD calls “Other Support Services Staff.” It includes employees such as plant and equipment maintenance, bus drivers, security, and food service workers. For every 1,000 students, California districts employ 17 more workers in these roles than Washington districts do. Figure 3 shows the results visually. There are a handful of California districts that look similar to Washington in this category, but there are a lot more California districts that have chosen to employ many more workers in these roles.
Lessons for policymakers
Despite its statements regarding district flexibility, Washington’s resource-based funding model appears to be constricting district staffing choices, especially when it comes to deciding how many teachers and other support staff to employ. If Washington legislators want to see districts exercise their full flexibility, they may need to take more proactive steps or shift to a student-based funding model.
In other words, the choice of district funding methods implicitly alters the locus of control over spending decisions. Resource-based allocation models allow the state to retain some measure of control, which might be a good thing if bureaucrats at the state level have better information about staffing or research or just want to ensure a standard quality of service throughout the state. However, those decisions open the state up to constant accusations that they aren’t providing sufficient funding for any given line of operation.
In contrast, student-based formulas provide lump-sum distributions for local leaders to use at their discretion. That potentially allows for more optimal local decisions and more heterogeneity across communities, but state leaders may be ultimately dissatisfied with how the money is spent. For example, in response to the Red for Ed teacher strikes in 2018, Arizona legislators provided additional funding that was enough to raise each teacher’s salary by 20%. But because Arizona has a student-based funding model, districts had flexibility over how they actually spent the money, and few districts ultimately used all of the money to raise teacher pay.
Tennessee has gone through a similar push and pull over flexibility more recently. In 2022, it switched from a resource-based funding model to a student-based one, and it invested heavily in that transition. But this year, the governor championed a bill raising the minimum teacher salary by $15,000 by 2026, which may help teachers but could indirectly shape how districts staff their schools. One plausible consequence from a higher state salary mandate might be districts hiring fewer (high-cost) teachers and instead putting more resources into support staff, even though that was not the intended response to the policy.
Overall, the latest research on school funding amounts is clearer than the research on specific funding mechanisms and constraints. Funding increases targeted to low-income students tend to improve student outcomes, but the research is less clear about particular mechanisms for how to allocate that money to schools. Schools in general have been adding staff over time, and there’s some evidence those increases can benefit students, but more research is needed about how districts use funding increases and whether different staffing choices affect student outcomes.
In the absence of that evidence, policymakers should be willing to distribute money flexibly based on student need, without conditions or requirements. The evidence from Washington suggests that school districts interpret even non-binding policies as more constraining than they appear to be.
Related Content


Author

-
Acknowledgements and disclosures
This analysis was funded and conducted as part of a study at Georgetown University’s Edunomics Lab and shared at the Association of Education Finance and Policy annual conference.
The Brookings Institution is committed to quality, independence, and impact.
We are supported by a diverse array of funders. In line with our values and policies, each Brookings publication represents the sole views of its author(s).